Báo cáo hóa học: " Measuring and analyzing tissue specificity of human genes and protein complexes" potx
Bạn đang xem bản rút gọn của tài liệu. Xem và tải ngay bản đầy đủ của tài liệu tại đây (608.07 KB, 6 trang )
RESEARC H Open Access
Measuring and analyzing tissue specificity of
human genes and protein complexes
Dorothea Emig
*
, Tim Kacprowski and Mario Albrecht
Abstract
Proteins and their interactions are essential for the survival of each human cell. Knowledge of their tissue
occurrence is important for understanding biological processes. Therefore, we analyzed microarray and high-
throughput RNA-sequencing data to identify tissue-specific and universally expressed genes. Gene expression data
were used to investigate the presence of proteins, protein interactions and protein complexes in different tissues.
Our comparison shows that the detection of tissue-specific genes and proteins strongly depends on the applied
measurement technique. We found that microarrays are less sensitive for low expressed genes than high-
throughput sequencing. Functional analyses based on microarray data are thus biased towards high expressed
genes. This also means that previous biological findings based on microarrays might have to be re-examined using
high-throughput sequencing results.
Keywords: gene expression, protein interaction, tissue specificity
Introduction
It is essential for human systems biology and medicine
to understand the tissue specificity of expressed genes
and their produ cts, which are involved in important cel-
lular processes a nd diseases. Over the last years, many
studies were based on the freely available Novartis Gene
Atlas data to investigate the tissue specificity of human
gene expression and its biological impact on protein
expression and protein interaction networks [1,2]. The
Gene Atlas data consists of comprehensive gene expres-
sion datasets for a wide variety of tissues and cell lines
[3]. However, these data were already published in 2004,
and the microarrays employed to obtain the data we re
of low probe density and specifi cally designed to mea-
sure genes that were assumed to exist at that time. This
raises the question whether these relatively old datasets
should still be regarded as reliable source for tissue spe-
cificity of human genes. A more recently developed
microarray is the Affymetrix Exon Tiling Array, which
has been developed to measure exon expression rather
than gene expression [4]. Its probe density per gene is
much larger than the microarray technology used to
generate the Gene Atlas. Furthermore, the advent of
next-generation sequencing machines allows further
technological advances in accurate transcriptome mea-
surements [5].
In the following, we explore three tissue-dependant
gene expression datasets produced by microarray tech-
nologies and high-throughput sequencing of RNA. We
first study the detection sensitivities of the technologies
and compare the measured gene expression datasets.
Furthermore, we investigate protein interactions to iden-
tify tissue-specific a nd housekeeping interactions. Last,
we utilize expression data for the detection and compar-
ison of tissue-specific protein complexes and analyze to
what extent functional implicat ions on tissue specificity
depend on the applied expression detection method.
Materials and methods
Databases and identifier unification
All analyses are based on the Ensembl database, version
52 (genome build hg18) [6]. Gene and protein identifiers
of all data sources were unified by mapping them to
Ensembl gene identifiers via Ensembl BioMart [7].
Tissue samples
We downloaded the raw Novartis Gene Atlas data from
GEO (GSE1133) together with probeset-to-gene annota-
tions for the GNF1H and Affymetrix U133A arrays. The
* Correspondence: pg.de
Max Planck Institute for Informatics, Campus E1.4, 66123 Saarbrücken,
Germany
Emig et al. EURASIP Journal on Bioinformatics and Systems Biology 2011, 2011:5
/>© 2011 Emig et al; licensee Springer. This is an Open Access article distributed under the terms of the Creative Commons Attribution
License
data contains samples for 79 human tissues and cell
lines. For the Affymetrix Exon Array, we downloaded
sample data for 11 tissues as provided by Affymetrix,
with three assay replicates for each tissue. RNA-sequen-
cing data for 15 tissues and cell lines was obtained from
the supplementary data provided by Wang et al. [8].
Five human tissue samples were contained in all three
expression datasets: heart, liver, testis, skeletal muscle,
and cerebellum.
Probeset to gene mapping
Probesets for the Gene Atlas arrays were mapped to
Ensembl genes using all gene identifiers as given in the
GEO probeset-to-gene annotat ion files. For the GNF1H
array, we were able to map 8,875 probesets to 6,086
Ensembl genes, out of which 5,943 encode proteins. For
the Affymetrix U133A array, we were able to map
21,778 probesets to 12,489 Ensembl genes, out of which
12,448 encode proteins. The Gene Atlas data are based
on both microarrays and consists of a total of 16,989
distinct protein-coding genes.
The Exon Array probesets were mapped to Ensembl
genes according to the genomic coordinates of the pro-
besets as given in the NetAffx release 28 [9]. Altogether,
the probesets could be mapped to 20,444 protein-coding
genes.
Gene expression estimates
The raw Novartis Gene Atlas data were normalized using
the Affymetrix Expression Console software. All samples
were normalized together by applying the MAS5.0 algo-
rithm with default parameters. The resulting presence/
absence calls (P-/A-calls, automatically derived by
MAS5.0 from computed detection p-values) for the pro-
besets were then used to identify genes expressed in the
respective samples. For simplification, we treated mar-
ginal calls (M-calls) as present. We regarded a probeset
as being present in a sample if it was present in at least
one of t he two replicates. If more than one probeset
mapped to on e gene, we require d at least one of the pro-
besets to be present for gene expression.
The Exon Array data were processed using AltAnalyze
with default parameters [10]. AltAnalyze computes a
detection p- value for every Ensembl gene in each of the
three replicates per sample. The p-values are derived
using the DABG (’detection above background’) method,
which is the standard method for computing P-/A-calls
for Exon Arrays. W e obtained gene presence a nd
absence calls by taking the median of the three p-values
for every gene in each sa mple, and set the presence p-
value threshold to 0.05, w hich is the recommended
threshold for DABG p-values.
Gene expression estimates (RPKM values) for the
RNA-sequencing data were obtained from Wang et al.
[8]. We chose a very conservative expression threshold
and treated all genes having an RPKM value ≥ 1 as pre-
sent and all others as absent [5]. In contrast to the
other tissues with a single sample each, six different
samples were available for cerebellum. To obtain a sin-
gle RPKM value per gene in cerebellum, we took the
mean of these expression estimates and regarded genes
as expressed if their mean RPKM values were ≥ 1.
Comparison of detection calls
Although the three datasets contain many tissue and cell
line samples, the overlap consists of five tissues only.
Thus, we defined a gene to be tissue-specific if it is
expressed in exactly one of these five tissues.
The gene presence and absence calls amount to a bin-
ary classification of gene expression results that does
not take expression levels into account. Therefore, we
used the Matthews correlation coefficient (MCC) to
compute pairwise correlations between the datasets. The
MCC is computed as follows:
MCC =
TP · T
N
− FP · F
N
(TP + FP) · (TP + FN) · (TN + FP) · (TN + FN)
.
Here, TP is the number of true positives, i.e. genes
classified as expressed in both datasets. TN is the num-
ber of true negatives, i.e. genes classified as not
expressed in both datasets. FP is the number of false
positives, i.e. genes classified as expressed only in the
one, but not the other dataset. FN is the number of
false negatives, i.e . genes classified as expressed only in
the other dataset.
Protein interaction data
We obtained a human protein interaction network from
a recent study by Bossi and Lehner [1]. The protein
interactions had been compiled from more than 20 data
sources and required to have experimental evidence of
physical interaction. We mapped all proteins to Ensembl
gene identifiers. We kept a protein interaction if both
interacting partners could be mapped and had expres-
sion estimates in all datasets. This gave 60,760
interactions.
Protein complex data
Human protein complexes were obtained from P DB and
CORUM (downloaded July 2009) [11,12]. We mapped all
complex members to Ensembl gene identifiers. We kept
only those complexes for which all proteins could be
mapped and had gene expression estima tes in all three
expression datasets. We also required the complexes to
be composed of at least three di fferent proteins and
removed duplicates contained in CORUM and PDB data.
This resulted in 572 distinct protein complexes.
Emig et al. EURASIP Journal on Bioinformatics and Systems Biology 2011, 2011:5
/>Page 2 of 6
Results and discussion
Gene expression analysis
We first extracted those protein-coding genes contained
in all three expression datasets, a total of 14,718
Ensembl genes, to compare their presence/absence calls
(i.e. expression detected or not). We find that RNA-
sequencing and Exon Array data have a comparatively
high agreement in their presence and absence calls,
while the Novartis Gene Atlas shows inverse calls for
many genes. More precisely, the correlation between the
RNA-sequencing and Exon Array data is clearly higher
than the correlation of any of these datasets to the Gene
Atlas data (MCC was used for all analyses). On average,
the correlation between RNA-sequencing and Exon
Array data is 0.56, with a maximum of 0.61 in liver and
a minimum of 0.44 in testis. The average correlation
between the Gene Atlas and RNA-sequencing data is
0.27 and between Gene Atlas and Exon Array data 0.28.
The respective maximal correlations are 0.31 (in liv er)
and 0.32 (in testis), and the minimal correlations 0.18
and 0.20 (both in muscle).
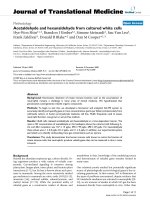
RNA-sequencing is the most sensitive method for
detecting gene expression. Figure 1 shows that, for each
tissue (except for cerebellum), the number of expressed
genes is the highest when using RNA-sequencing, a
finding that is in agreement with a recent study by
Ramskold et al. [5]. Of course, the number of expressed
genes depends on the RPKM expression threshold to
some extent. However, the study by Ramskold and col-
leagues showed that an RPKM threshold below our
choice still yields reasonable results. Thus, lowering the
threshold would increase the number of expressed genes
using RNA-sequencing even further.
As seen from the correlation of the A-/P-calls above,
the Gene Atlas arrays are not able to detect many of the
genes found expressed according to the Exon Array and
RNA-sequencing. The number of tissue-specific genes
(expressed in exactly one of the five tissues) is low for
all methods. The fewest tissue-specific genes are
detected in skeletal muscle and the highest in testis. We
also compared the actual genes found to be expressed
acco rding to the different methods. We observed a high
agreement of genes with P-calls for RNA-sequencing
and Exon Arrays, with t he lowest agreement (37%) in
skeletal muscle and the highest (56%) in cerebellum.
The Gene Atlas, however, is not able to detect many of
these genes and, on average, shows a low agreement
with the other datasets.
A closer look at the tissue specificity of expressed
genes reveals that the gene expression detection results
vary significantly between the datasets and across tis-
sues. While RNA-sequencing detects more than 6,00 0
genes (41% of all shared genes) to be expressed in all
tissues, the Exon Array identifies only about 4,500 genes
(31%) and the Gene Atlas indicates only about 1,500
genes (10%) to be expressed in all tissues. The reverse
can be observed for those genes not expressed in any of
the five t issues: RNA-sequencing identifies the lowest
number of abse nt genes (approx. 2,100), while the Gen e
Atlas is not able to detect more than 6,000 genes. For
genes expressed in one to four tissues, the numbers are
very similar for all datasets.
Figure 1 Number of all expressed genes and the tissue-specific fraction in each t issue as detect ed by the Gene Atlas (2 left bars),
Exon Array (2 middle bars), and RNA-Seq (2 right bars).
Emig et al. EURASIP Journal on Bioinformatics and Systems Biology 2011, 2011:5
/>Page 3 of 6
These results demonstrate clearly that more genes are
widely expressed than previously thought and that tissue
expression studies will need to be re-examined using the
novel RNA-sequencing method [5]. Obviously, microar-
rays are less sensitive regarding gene expression detec-
tion than RNA-sequencing methods. Statistical methods
used for normalizing microarray data often cannot dis-
tinguish between very low gene expression and experi-
mental noise. The refore, it is likely that low expression
is mistakenly reported as noise and thus the r espective
gene is regarded as not expressed. RNA-sequencing
methods, which are based on read-to-gene mappings,
can reliably detect genes at very low expression levels.
We also compared the detection sensitivity of RNA-
sequencing and the microarrays. For each tissue, we first
extracted all shared genes with an RPKM ≥ 1fromthe
RNA-sequencing data. We found that RNA-sequencing
detects a high number of genes expressed at low levels.
Next, we investigated the fraction of these genes that
are also detected as expressed by the microarray meth-
ods and annotated the respective RPKM values to them.
We observed that, for all tissue samples, the Exon Array
identifies a greater number of genes expressed at low
levels (with a low RPKM value according to the RNA-
sequencing data) than the Gene Atlas. This suggests
that the high probe density of the Exon Array can partly
compensate the errors due to experimental noise.
Tissue specificity of protein interactions
Gene expression often leads to the production of pro-
teins in the cells. Therefore, we re-examined a study
regarding the tissue specificity of physical protein
interactions, which was based on the Gene Atlas [1]. In
this study, a high n umber of tissue-specific protein
interactions was reported, which mainly occurred due to
the interaction of a tissue-specific protein with a house-
keeping protein. Using the Gene Atlas data, we can
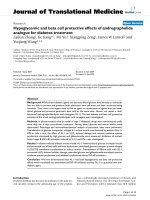
reproduce these findings. However, Figure 2 shows that
the number o f protein interactions occurring in the tis-
sues rapidly grows when applying the Exon Array or
RNA-sequencing data. While the number of absent pro-
tein interactions compared to present ones is always
higher when applying the Gene Atlas, the results are
reversed using the other methods. This finding suggests
that fewer protein interactions are tissue-specific than
assumed previously, and relatively few protein interac-
tions contribute to tissue-specific functions.
Tissue specificity of protein complexes
Additionally, we investigated whether microarrays and
RNA-sequencing are able to detect the expression of
protein complexes in different tissues. We distinguished
between completely expressed complexes (all involved
genes are expressed), partially expressed complexes (at
least one of the involved genes is not expressed, but we
require the partial complex to consist of at least two
expressed proteins), and completely absent complexes
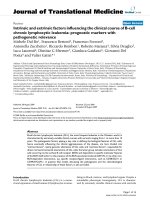
(atmostoneinvolvedgenesisexpressed).Asshownin
Figure 3, R NA-sequencing is the most sensitive method,
and the highest number of completely expressed pro tein
complexes is found in all tissues. In contrast, the Exon
Array identifies fewer complexes, and the Gene Atlas
hardly detects any complexes as completely expressed.
Since the detection sensitivity of the Gene Atlas has
Figure 2 Histogram of the numbers of present and absent protein interactions in each tissue. The two leftmost bars show presence and
absence according to the Gene Atlas, the third and fourth bars according to the Exon Array, and the two rightmost bars according to RNA-
sequencing.
Emig et al. EURASIP Journal on Bioinformatics and Systems Biology 2011, 2011:5
/>Page 4 of 6
been shown to be the lowest, we expected to find fe w
completely expressed complexes. However, the detection
rate for pr otein complexes is even lower th an thought,
with only 0.01% in skeletal muscle (compared to 51%
using RNA-sequencing). Conversely, it is interesting that
the number of completely absent complexes is low for
all methods, suggesting that most of t hem contain high
expressed gene products detectable by all methods.
To compare the expression measurements of the
microarrays and RNA-sequencing, we computed their
correlations regarding the detection of protein com-
plexes. For this purpose, we calculated the detection
percentage for each complex and each measurement
method. Detection percentages of 0% and 100% indi-
cated that the complex is completely absent and present,
respectively, while everything in between was a partially
expressed complex. As f or the gene expression correla-
tion, the expression correlation for protein complexes is
clearly higher for RNA-sequencing and the Exon Arra y
than for any method correlated to the Gene Atlas. The
average correlation for RNA-sequencing and the Exon
Array is 0.66, with a maximum of 0.73 in muscle and a
minimum of 0.48 in testis. F or the Gene Atlas and
RNA-sequencing as well as the Gene Atlas and the
Exon Array, the average correlation is 0.31 in both
cases, with a minimum of 0.23 (muscle) and a maximum
of 0.39 (cerebellum), and a minimum of 0.26 (cerebel-
lum) and a maximum of 0.36 (testis), respectively.
Conclusions
Our analysis revealed that gene expression varies
depending on the method used for detection. We found
that, using RNA-sequencing technologies, a considerably
larger number of genes is f ound to be widely expressed
than previously thought and that many of the detected
genes are expressed at low levels. Using the very com-
mon, yet low-density, 3’ microarrays, we were not able
to detect many of these genes. However, it is remarkable
that the Exon Array results correlate well with the RNA-
sequencing results, which suggests that the high probe
density of this microarray is partially able to identify low
gene expression.
In addition, we i ntegrated the gene expression results
obtained by the different technologies with protein
interactions and protein complexes to investi gate to
what extent the discovered differences in gene expres-
sion might affect the outcome of functional analyses.
We observed that, in case of 3’ microarrays, the overall
number of protein interactions and complexes expressed
in each tissue is low and that many interactions and
complexes are classified as highly tissue-specific. In con-
trast, based on RNA-sequencin g, a considerably larger
number of protein interactions and complexes is found
per tissue, and we classified much fewer of them as tis-
sue-specific. These results indicate that previous func-
tional analyses that relied on 3’ microarrays should be
reconsidered because t hey suggested a large number of
tissue-specific proteins and interactions. However, these
earlier findings were likely biased towards highly
expressed genes and thus could not provide accurate
insight into tissue specificity and its functional impact.
List of Abbreviations
DABG: detection above background; MCC: Matthews correlation coefficient.
Acknowledgements
This work was supported by the German National Genome Research
Network NGFN and the German Research Foundation DFG (KFO 129/1-2).
Figure 3 Expression of prot ein complexes in each tissue according to the Gene Atlas (thr ee leftmost bars), Exon Array (three middle
bars), and RNA-Seq (three rightmost bars). The respective three bars are ordered according to complete expression, partial expression, and
complete absence of the protein complexes.
Emig et al. EURASIP Journal on Bioinformatics and Systems Biology 2011, 2011:5
/>Page 5 of 6
The work was conducted in the context of the DFG-funded Cluster of
Excellence for Multimodal Computing and Interaction.
Competing interests
The authors declare that they have no competing interests.
Received: 1 November 2010 Accepted: 5 April 2011
Published: 4 August 2011
References
1. A Bossi, B Lehner, Tissue specificity and the human protein interaction
network. Mol Syst Biol. 5, 260 (2009)
2. B Lehner, AG Fraser, Protein domains enriched in mammalian tissue-specific
or widely expressed genes. Trends Genet. 20, 468–472 (2004)
3. AI Su, T Wiltshire, S Batalov, H Lapp, KA Ching, D Block, J Zhang, R Soden,
M Hayakawa, G Kreiman, MP Cooke, JR Walker, JB Hogenesch, A gene atlas
of the mouse and human protein-encoding transcriptomes. Proc Natl Acad
Sci USA. 101, 6062–6067 (2004)
4. TA Clark, AC Schweitzer, TX Chen, MK Staples, G Lu, H Wang, A Williams, JE
Blume, Discovery of tissue-specific exons using comprehensive human exon
microarrays. Genome Biol. 8, R64 (2007)
5. D Ramskold, ET Wang, CB Burge, R Sandberg, An abundance of
ubiquitously expressed genes revealed by tissue transcriptome sequence
data. PLoS Comput Biol. 5, e1000598 (2009)
6. TJ Hubbard, BL Aken, S Ayling, B Ballester, K Beal, E Bragin, S Brent, Y Chen,
P Clapham, L Clarke, G Coates, S Fairley, S Fitzgerald, J Fernandez-Banet, L
Gordon, S Graf, S Haider, M Hammond, R Holland, K Howe, A Jenkinson, N
Johnson, A Kahari, D Keefe, S Keenan, R Kinsella, F Kokocinski, E Kulesha, D
Lawson, I Longden, K Megy, P Meidl, B Overduin, A Parker, B Pritchard, D
Rios, M Schuster, G Slater, D Smedley, W Spooner, G Spudich, S Trevanion,
A Vilella, J Vogel, S White, S Wilder, A Zadissa, E Birney, F Cunningham, V
Curwen, R Durbin, XM Fernandez-Suarez, J Herrero, A Kasprzyk, G Proctor, J
Smith, S Searle, P Flicek, Ensembl 2009. Nucleic Acids Res. 37, D690–D697
(2009)
7. D Smedley, S Haider, B Ballester, R Holland, D London, G Thorisson, A
Kasprzyk, BioMart - biological queries made easy. BMC Genomics. 10,22
(2009)
8. ET Wang, R Sandberg, S Luo, I Khrebtukova, L Zhang, C Mayr, SF Kingsmore,
GP Schroth, CB Burge, Alternative isoform regulation in human tissue
transcriptomes. Nature. 456, 470–476 (2008)
9. G Liu, AE Loraine, R Shigeta, M Cline, J Cheng, V Valmeekam, S Sun, D Kulp,
MA Siani-Rose, NetAffx: Affymetrix probesets and annotations. Nucleic Acids
Res. 31,82–86 (2003)
10. N Salomonis, B Nelson, K Vranizan, AR Pico, K Hanspers, A Kuchinsky, L Ta,
M Mercola, BR Conklin, Alternative splicing in the differentiation of human
embryonic stem cells into cardiac precursors. PLoS Comput Biol. 5,
e1000553 (2009)
11. HM Berman, J Westbrook, Z Feng, G Gilliland, TN Bhat, H Weissig, IN
Shindyalov, PE Bourne, The Protein Data Bank. Nucleic Acids Res. 28,
235–242 (2000)
12. A Ruepp, B Brauner, I Dunger-Kaltenbach, G Frishman, C Montrone, M
Stransky, B Waegele, T Schmidt, ON Doudieu, V Stümpflen, HW Mewes,
CORUM: the comprehensive resource of mammalian protein complexes.
Nucleic Acids Res. 36, D646–D650 (2008)
doi:10.1186/1687-4153-2011-5
Cite this article as: Emig et al.: Measuring and analyzing tissue
specificity of human genes and protein complexes. EURASIP Journal on
Bioinformatics and Systems Biology 2011 2011:5.
Submit your manuscript to a
journal and benefi t from:
7 Convenient online submission
7 Rigorous peer review
7 Immediate publication on acceptance
7 Open access: articles freely available online
7 High visibility within the fi eld
7 Retaining the copyright to your article
Submit your next manuscript at 7 springeropen.com
Emig et al. EURASIP Journal on Bioinformatics and Systems Biology 2011, 2011:5
/>Page 6 of 6