Báo cáo hóa học: " Single wave extraction in continuous intracranial pressure signal with lifting wavelet transformation and discrimination rules" pot
Bạn đang xem bản rút gọn của tài liệu. Xem và tải ngay bản đầy đủ của tài liệu tại đây (536.17 KB, 8 trang )
RESEARCH Open Access
Single wave extraction in continuous intracranial
pressure signal with lifting wavelet
transformation and discrimination rules
Zhong Ji
*
, Lan Zhu, Xing Yang and Lipeng Jiang
Abstract
Objective: This article describes a novel method for processing continuous intracranial pressure (ICP) signals with
lifting wavelet transformation and discrimination rules for ICP waveform morphology.
Methods: First, lifting wavelet was applied to detect the extreme points of ICP waveform preliminarily; then, the
extreme points that were undetected or falsely detected are determined by using the discrimination rules
repeatedly; finally, those falsely detected and undetected points were removed or corrected to improve the
accuracy of identified individual pulse.
Results: The algorithm was employed to analyze continuous ICP signals of nine patients. Signals wer e recorded for
30 min each. Each signal was divided into 30-s segments and analyzed. The accuracy rate of 98.58% was obtained.
Conclusion: The method described in this article has given a possibility for the clinical use of ICP waveform. By
identifying the single ICP wave effectively, not only mean ICP but also single ICP wave amplitude and latency can
be computed precisely with this new method.
Keywords: intracranial pressure, single wave extraction, lifting wavelet, discrimination rules
1. Introduction
Mean intracranial pressure (ICP) is often regarded as a
clinical indicator during continuous ICP monitoring,
and is computed according to the sum of pressure levels
divided by number of samples. However, t he ICP wave
parameters of a single ICP wave, such as ICP wave
amplitude and latency, can provide the inf ormation that
is not given in mean ICP [1-3]. Many studies have indi-
cated that the ICP wave parameters are related to intra-
cranial pressure-volume compensatory reserve capacity.
Hu et al. [4] also pointed out that ICP elevation could
be predicted by the prescient change of ICP waveform
morphology. The present research situation of single
ICP wave identification and its importance in clinical
practice has been discussed in other articles very well,
and there are several methods developed to analyze the
continuous ICP signals [1-7]. We have developed an
alternativesinglewaveidentification method that com-
bined liftin g wavelet transform with waveform discrimi-
nation rules. In the premise of not reducing the
accuracy of single wave identification, the method
decreased the single wave parameters that required
identification, and simplified the identification process.
Since the continuous ICP signal is dynamic and oft en
interfered by noise, the feature points used to identify
the single ICP wave may be inconspicuous. Wavelet
transform is a signal processing method broadly used
for s ignal de-noising and feature extraction [8,9]. How-
ever, in practice, because of the variation of wavelet
bases, it is often needed to try different wavelet bases to
find a suitable one according to the wave features of
analyzed signal. The research and discussion for the first
generation of wavelet are conducted within the frame-
work of Fourier analysis, i.e., the problem is analyzed in
the view of frequency domain. Sweldens used a new
wavelet construction algorithm that does not rely on
Fourier transformation, but on lifting scheme to con-
struct wavelet in time domain, then he established the
* Correspondence:
Key Laboratory of Biorheological Science and Technology of Ministry of
Education, Bioengineering College of Chongqing University, Chongqing,
400030, China
Ji et al. EURASIP Journal on Advances in Signal Processing 2011, 2011:43
/>© 2011 Ji et al; licensee Springer. This is an Open Ac cess article distributed unde r the terms of the Creative Commons Attribution
License ( which permits unrestricted use, distribution, and reproduction in any medium,
provided the original work is properly cited.
second generation wavelet transform theory [10,11].
Compared with the first gener ation wavelet, the lifting
wavelet can be used to self-define wavelet construction
based on the characteristics of the analyzed signal. It
contributes to a better real-time performance of the
diagnosis system by reducing calculation. Based on the
lifting scheme, according to the characteristics of a sin-
gle ICP wave, an appropriate wavelet can be constructed
to remove noise effectively; furthermore, the discrimina-
tion rules can be developed for the extraction of single
ICP waves. In this way, the extreme points of single ICP
waves can be detected with higher accuracy.
2. Methods
2.1. Wavelet transform based on lifting scheme
The wavelet decomposition based on lifting scheme
could be divided into the following three stages: split,
prediction, and update [10,11].
(1) Split
First, the input signal s
i
was divided into two smaller
subsets s’
i-1
and d’
i-1
,whered’
i-1
was also known as
wavelet subset. The simplest split was that s
i
was divided
into two groups according to parity, then s’
i-1
was
known as t he even sequence and d’
i-1
known as the odd
sequence. This split wavelet was called the Lazy Wave-
let, which could be expressed as
split
(
s
i
)
=
s
i−1
, d
i−1
.
(1)
(2) Prediction
Based on the correlation of raw data, the predicted P(s’
i-
1
) of the even sequence s’
i-1
was used to predict (or
interpolate) the odd sequence d’
i-1
. In practice, even
though it was impossible to predict the subset d’
i-1
accu-
rately, it was possible to make P(s’
i-1
)veryclosetod ’
i-1
,
so P(s’
i-1
) could be used to replace the origin al d’
i-1
with
the difference between d’
i-1
and P(s’
i-1
), then the gener-
ated d
i-1
would contain less information than the origi-
nal d’
i-1
, that is
d
i−1
= d
i
−1
− P(s
i
−1
)
.
(2)
(3) Update
The idea of update was to find a bet ter subset s
i-1
,which
maintained some scalar features Q(s
i
) (such as invariant
mean and vanishing moment) of the original signal, i.e.,
Q(s
i-1
)=Q(s
i
). The computed wavelet subset d
i-1
could
be used to update s’
i-1
, which made the latter maintain
the same scalar features. An operator U could be con-
structed to update s’
i-1
, which was defined as follows:
s
i−1
= s
i
−1
+ U(d
i−1
),
(3)
where the obtained subset s
i-1
was smaller than the
original signal set s
i
, and the wavelet subset d
i-1
could
also be obtained, i.e., the signal had been implemented
wavelet transformation.
Among the three stages, the prediction and the updat-
ing steps were the core of wavelet lifting. The high-fre-
quency and suitable low-frequency information could be
acquired, respectiv ely, by predicting and updating steps.
It is easy to understand that the above algorithm only
needs the output of former updating step, so that the
former data stream of each point could be replaced by
the new one. Namely bit operation, which did not
occupy the system memory, could be achieved.
It is easily to obtain the inverse transformation of the
lifting scheme from its positive transformation, only by
changing the direction, as well as plus and minus sign
of the data stream. Namely, the reconstruction was
composed of restoring update, prediction, and the
decomposed subset combination, that is
s
i
−1
= s
i−1
− U
(
d
i−1
)
,
(4)
d
i
−1
= d
i−1
+ P(s
i
−1
)
,
(5)
s
i−1
d
i−1
=merge(s
i
)
.
(6)
In the algorithm, P and U could be chosen to c on-
struct the wavelet and scaling functions with some char-
acteristics. The split and merging process of a single
lifting are shown in Figure 1.
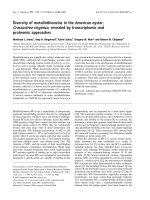
2.2. Definitions of single ICP wave parameters
The definitions of parameters were introduced to
describe the characteristics of a single ICP wave [1]. In
Figure 2, the starting minimum diastolic press ure of the
single wave (Pmin1) defines its start, the ending mini-
mum diastolic pressure (Pmin2) defines the end, and
the maximum systolic pressure (Pmax1) defines the
maximum of the single wave. In this article, the time
duration dW2 of two maximum systolic pressures of
adjacent ICP waves, a new parameter, was also intro-
duced to discriminate whether the detected extreme
points were correct. The single ICP wave amplitude dP
was defined as the pressure difference between Pmin1
and Pmax1, the latency of a single ICP w ave was the
time interval when the pressure changed from Pmin1 to
Pmax, the dW1 defined the time duration of a single
ICP wave between Pmin1 and Pmin2, and the dW2
defined the time duration between the two peaks Pmax1
and Pmax2 of two adjacent ICP waves.
Based on the definitio ns, the single ICP wave para-
meters could be computed with the following formulas
after extracting the single ICP wave with the lifting
wavelet algorithm shown in Section 4:
dP = Pmax1.
y
− Pmin1.
y
(7)
Ji et al. EURASIP Journal on Advances in Signal Processing 2011, 2011:43
/>Page 2 of 8
d
T = Pm
a
x1
.x
− Pmin1
.x
(8)
dW
1=Pmin2
.x
− Pmin1
.x
(9)
dW
2=Pm
a
x2
.x
− Pm
a
x1
.x
(10)
where .x was the time value of the feature point and .y
was the pressure value.
2.3. Algorithm process for single ICP wave extraction
According to the feature of a single ICP wave, the
peak and valley of a single ICP wave were r egarded as
singular points in continuous ICP wave, so we devel-
oped a new algorithm to extract single ICP wave
based on lifting wavelet and discrimination rules as
follows:
(1) Preprocess th e sampled ICP signals and segment
them by N section per minute, where 2 ≤ N ≤ 10;
(2) Split every segment of ICP wave into LEVEL layers
with lifting wavelet. Thereby, the detail signal D ={d
i
}
and approximate signal S ={s
i
}, i = 1,2, ,LEVEL of
every layer was obtained. Then, the detail parts were
summed up to get the total odd sequence (detail signals)
which was transformed from original signal with lifting
wavelet;
(3) Construct sliding window to further process the
odd sequence. The width o f sliding window was w = f
s
/
2f, and the sliding coe fficient was δ = f
s
/2f,whichwas
determined by the samplin g frequency f
s
and the cardiac
beat period f;
(4) Calculate module mini-max values of ICP signal in
every sliding window as the feature p oints of the single
ICP waves. These compu ted positive and negat ive mod-
ule maximums were regarded as the peaks and valleys.
Lifting wavelet transformation was applied to the
above four steps to get the mini-max points. However, if
only lifting wavelet transformation was used to identify
thesingleICPwave,someextremepointsmightbe
undetected or detected falsely. Further analysis indicated
that after the above four steps, several abnormal cases
of extreme points existed, which were identified with
frames in Table 1. These abnormal cases included: (a)
two minimum points close to each other were identified
between two maximum points; (b) two maximum points
close to each other were identified between two mini-
mum points; (c) no maximum point was identified
between two minimum points ; and (d) no minimum
point was identified between two maximum points.
Based on the above-mentioned definitions in Figure 2
and formulas (7) to (10), dW1, dW 2, dT,anddP were
calculated, and the ranges of the first three parameters
were determined: 500 ms < dW1 < 1200 ms, 500 ms <
dW2<1200ms,100ms<dT < 250 ms; and single ICP
wave amplitude (dP)shouldbebetween3and20.0
mmHg. Further discrimination processing was made to
find out the missing extreme points and filter the false
ones, therefore the identification ability of ICP waveform
was improved.
Specific discrimination rules were as follows:
(5) Arrange the mini-max points acquired by steps (1)
to (4) in chronological order, and then calculate wave-
form parameters dT,dW1, dW2, and dP;
(6) Discriminate whether extreme points are mis sing
or detected false according to the ranges of above-men-
tioned parameters. The followings were specific ways for
discrimination:
(a) When dW1 was within the normal range, if two
maximum points were identified between two minimum
points and this dW2 was below the lower limit, then a
maximum point was detected false. Comparing the
amplitudes of these two maximumpoints,andthebig-
ger one was chosen as t he final maximum point, under
the premise that dP was within the normal range;
(
a
)
(b)
-
Psplit U
+
S
i
d'
i-1
S'
i-1
S
i-1
d
i-1
+
mergeU P
-
d
i-1
S
i-1
d'
i-1
S'
i-1
S
i
Figure 1 Splitting and merging process of once lifting.
Pmax2
Pmin2
Pmin2
d
W1
dW2
Pmax1
Pmin1
dT
dP
(t/ms
)
X
y
(P/mmHg)
Figure 2 Definitions of single ICP wave parameters.
Ji et al. EURASIP Journal on Advances in Signal Processing 2011, 2011:43
/>Page 3 of 8
(b) When dW1 was within the normal range, if no
maximum point was identified between two minimum
points and dW2 was beyond the normal range, then a
maximum point was missing. After further analysis of
the data between the two minimum points and estima-
tion of the value of dP, the missing maximum point was
found out;
(c) When dW2 was within the normal range, if two
minimum points were identified between two maximum
points and this dW1 was below the lower limit, then a
minimum point was detected false. Comparing the
amplitudes of these two minimum points, and the smal-
ler one was chosen as the final minimum point, under
the premise that dT was within the normal range;
(d) When dW2 was within the normal range, if no
maximum point was identified between two minimum
points and dW1 was out of the normal range, then a
minimum point was missing. After further analysis of
the data between the two maximum points and estima-
tion of the value of dT, the missing minimum point was
found out.
Step (5) and (6) should be repeated till no more unde-
tected or falsely detected points could be identified.
The flow chart of the algorithm is shown in Figure 3
and the discrimination rules in Figure 4. In the figure,
L
1low
= L
2low
= 500 ms, L
1high
= L
2high
= 1200 ms.
3. Results and discussion
Continuous ICP monitoring is usually applied to the
patients with head injury, cerebral hemorrhage, cerebral
tumor, etc. The continuous ICP signals in this study
were monitored using Codman intraparenchymal micro-
sensors (Codman and Schurtleff, Raynaud, MA) situated
in the right frontal lobe. The ICP signals were recorded
from nine patients, including th ree traumatic brain
injury patients, three cerebral hemorrhage patients, tw o
hydrocephalus patients, and one cerebral tumor patient.
The sampling frequency is 400 Hz. At the same time,
electrocardiograph(ECG) and arterial blood pressure
(ABP) signals were also recorded. Figure 5 shows 6-s
simultaneously recorded ECG and ICP signals of a
patient. It demonstrates that the ICP wave is related to
the cardiac beat and is disturbed by noise , which makes
it technically challenging to extract the single ICP wave
because its feature points cannot be located accurate ly.
Wavelet transformation as an effective de-noising
method was applied to the continuous ICP wave. Figure
6 illustrates the decomposition results with the first gen-
eration wavelet and Figure 7 with lifting wavelet. By
comparing the two figures, it could be seen that more
noises existed in the detail signals of the first generation
wavelet transform, which would affect the subsequent
computation of modulus maxima if noises were severe.
Thereby, the feature points of a single ICP wave could
not b e located accurately. In that case, artificial estima-
tion was needed to obtain better de-noised results.
However, the problem did not exist in the detail signals
of Figure 7, thus it was simpler to de-noise the results
with lifting wavelet.
The maximum and minimum values of a single ICP
wave could be computed by employing modulus maxi-
mum algorithm to the de-noised continuous ICP wave
[12]. Figure 8 illustrates that every single ICP wave is
located precisely and identified effectively.
The parameters of every single ICP wave could be
obtained by computing t he eight ICP waves in 6-s time
window shown in Figure 8, then the continuous ICP
monitoring wave could b e described with more para-
meter s, which made the monito ring ICP data reflect the
change of ICP more objectively and accurately.
Furthermore, to testify the validity of the algorithm
developed in this article, clinical continuous ICP signals
with the l ength of 30 min of nine patients are c hosen.
Based on our algorithm, the analyzed ICP s ignals were
divided into N segment/min first, here N =2,soevery
Table 1 Relative sampling positions of maximum and
minimum points of first 30-s signal segment, the boxed
values denoted the false detected points, or there were
undetected points between the two adjacent boxed
values
Pmax 192 471 733 1016
Pmin 140 383 686 947
Pmax 1272 1542 1819 1821
Pmin 1231 1486 1749 2029
Pmax 2081 2367 2619 2923
Pmin 2288 2572 2829 3097
Pmax 3160 3416 3707 3963
Pmin 3374 3381 3661 3920
Pmax 4241 4505 4761 5053
Pmin 4174 4663 4720 4977
Pmax 5304 5561 5865 6107
Pmin 5251 5517 5777 6056
Pmax 6415 6650 6907 7195
Pmin 6320 6574 6862 7123
Pmax 7285 7736 8024 8076
Pmin 7406 7692 7960 8239
Pmax 8570 8581 8856 9145
Pmin 8526 8811 9071 9359
Pmax 9403 9688 9982 10258
Pmin 9361 9641 9907 10293
Pmax 10521 10819 11064 11354
Pmin 10467 10738 11024 11286
Pmax 11612 11904
Pmin 11565 11825
Ji et al. EURASIP Journal on Advances in Signal Processing 2011, 2011:43
/>Page 4 of 8
ICP signal was divided into 60 segments with the length
of 30 s. Applying our algorithm to every segment ICP sig-
nals, Figure 9 shows the identification of a segment
before using discriminat ion rules, and Table 1 shows the
detected extreme points. The time duration between two
adjacent sampling points was 2.5 ms. As inferred from
the table, the abnormal cases demonstrated in Section 4
occurred. By employing the algorithms, the false and
missing extreme points could be detected, and further
processing could remove the false extreme points and
supplement the missing extreme points, as shown in Fig-
ures 9 and 10. In Figure 9, a green square represents that
multi-maximum points exist between two minimum
points; a megenta square represents that multi-minimum
points exist between two maximum points; a black penta-
gram represents that a maximum point is missing nearby;
a blue diamond represents that a minimum point is miss-
ing nearby. In Figure 10, a green square represents the
reconfirmed maximum pointinthefalseones;ablack
square represents the missing maximum point; a megen-
ata square represents the reconfirmed minimum point in
the false ones; a blue diamond represents the missing
minimum point. Use the discri mination rules repeatedly,
till no more undetecte d and falsely detected extreme
points can be discriminated.
For all the continuou s ICP waves of nine patients,
compared with the diagnosis results of clinical expertise,
the analysis results with our algorithm are shown in
Table 2. It can be seen that the accuracy rate was
improved from 92.95 to 98.58% by using our algorithm
with discrimination rules after lifting wavelet. Therefore,
the method descr ibed in this article has given a possibi-
lity for the clinical use of ICP waveform.
4. Conclusions
A new novel method was developed to identify single
ICP wave based on lifting scheme and the discrimina-
tion rules. In this way, not only mean ICP but also
Sample ICP signals with fs=200~1000Hz
Preprocess the sampled ICP signals and segment
them by N section/minute
De-noising every segment ICP signal with
lifting wavelet transform
Calculate the module mini-max values of
the wave as feature points
Calculate the feature parameters
Apply the discrimination rules
Find the undetected point and
remove the falsely detected points
Exist undetected or
Falsely detected points?
Get all true feature points
N
Y
Figure 3 Flow chart of our algorithm.
Ji et al. EURASIP Journal on Advances in Signal Processing 2011, 2011:43
/>Page 5 of 8
The discrimination rules
Case 1: the feature
parameters are right
Case 2: dW1<L
1low
Case 3: dW1>L
1
high
and L
2low
<dW2<L
2high
Case 4: dW2<L
2low
Case 5: dW2>L
2high
and L
1low
<dW1<L
1
high
There exists falsely
detected mini point
There exists un-
detected mini
-
point
There exists falsely
detected max
-
point
There exists un-
detected
max-
point
Compare the
amplitudes of the
two mini-points
If dT is right, the
smaller one is the
right mini-point
Compare the signal
amplitudes between
Pmax1 and Pmax2
Compare the
amplitudes of the
two max-points
Compare the signal
amplitudes between
Pmin1 and Pmin2
If dP is right, the point
corresponding to the
smallest amplitude is
the mini-point
If dT is right, the
larger one is the right
max-point
If dP is right, the point
corresponding to the
largest amplitude is
the max-point
Figure 4 Discrimination rules.
Figure 5 ECG and ICP signals.
Figure 6 Continuous ICP signal decomposed with the first generation wavelet.
Ji et al. EURASIP Journal on Advances in Signal Processing 2011, 2011:43
/>Page 6 of 8
Figure 7 Continuous ICP signal decomposed with lifting wavelet.
Figure 8 Identification of single ICP waves during 6-s time window.
Figure 9 Detected extreme points with lifting wavelet and abnormal cases found out by discrimination rules.
Ji et al. EURASIP Journal on Advances in Signal Processing 2011, 2011:43
/>Page 7 of 8
single ICP wave amplitude and latency could be com-
puted accurately; therefore, more information about ICP
change could be provided in clinical practice.
List of abbreviations
ICP: intracranial pressure; ECG: electrocardiograph; ABP: arterial blood
pressure.
Acknowledgements
The present work is supported by Scientific Research Foundation for Returned
Researchers of Ministry of Education (Foreign Secretary Education, No. 1341),
the Key Sci & Tech Research Project of Chongqing (CSTC2009AB5200,
CSTC2009AA5045, CSTC2010AA5049, CSTC2010AA5050) and Natural Science
Foundation of Chongqing (CSTC2009BB5035). The author would like to thank
Dr. Gurinder K Singh for critically reviewing the manuscript.
Competing interests
The authors declare that they have no competing interests.
Received: 19 April 2011 Accepted: 17 August 2011
Published: 17 August 2011
References
1. PK Eide, A new method for processing of continuous intracranial pressure
signals. Med Eng Phys. 28, 579–587 (2006). doi:10.1016/j.
medengphy.2005.09.008
2. CJ Kirkness, PH Mitchell, RL Burr, KS March, DW Newell, Intracranial pressure
waveform analysis: clinical and research implications. J Neurosci Nurs. 32(5),
271–277 (2000). doi:10.1097/01376517-200010000-00007
3. PK Eide, Intracranial pressure parameters in idiopathic normal pressure
hydrocephalus patients treated with ventrilculo-peritoneal shunts. Acta
Neurochir (Wien). 148,21–29 (2006). doi:10.1007/s00701-005-0654-8
4. X Hu, P Xu, S Asgari, P Vespa, M Bergsneider, Forecasting ICP elevation
based on prescient changes of intracranial pressure waveform morphology.
IEEE Trans Biomed Eng. 57(5), 1070–1078 (2010)
5. F Scalzo, P Xu, S Asgari, M Bergsneider, H Xiao, Regression analysis for peak
designation in pulsatile pressure signals. Med Biol Eng Comput. 47,
967–977 (2009). doi:10.1007/s11517-009-0505-5
6. M Balestreri, M Czosnyka, LA Steiner, E Schmidt, P Smielewski, B Matta, JD
Pickard, Intracranial hypertension: what additional information can be
derived from ICP waveform after head injury? Acta Neurochir (Wien) 146,
131–141 (2004). doi:10.1007/s00701-003-0187-y
7. X Hu, P Xu, F Scalzo, P Vespa, M Bergsneider, Morphological clustering and
analysis of continuous intracranial pressure. IEEE Trans Biomed Eng. 56(3),
696–705 (2009)
8. J-H Zhang, K Janschek, JF Bohme, Y-J Zeng, Multi-resolution dyadic wavelet
denoising approach for extraction of visual evoked potentials in the brain.
IEE Proc- Vis Image Signal Process. 151(3), 180–186 (2004). doi:10.1049/ip-
vis:20040315
9. Z Ji, T Jin, S-R Qin, Signal feature extraction based upon independent
component analysis and wavelet transform. Chin J Mech Eng. 18(1),
123–126 (2005). doi:10.3901/CJME.2005.01.123
10. W Sweldens, The lifting scheme: a custom-design construction of
biorthogonal wavelet. Appl Comput Harmon Anal. 3(2), 186–200 (1996).
doi:10.1006/acha.1996.0015
11. W Sweldens, The lifting scheme: a construction of second generation
wavelets. SIAM J Math Anal. 29(2), 511–546 (1997)
12. W Wang, Y-T Zhang, G-Q Ren, Denoising by self-adaptive lifting algorithm
based on modulus maximum analysis, in IEEE ICMTMA’09 Proceeding of the
2009 International Conference on Measuring Technology and Mechatronics
Automation. 1, 449–452 (2009)
doi:10.1186/1687-6180-2011-43
Cite this article as: Ji et al.: Single wave extraction in continuous
intracranial pressure signal with lifting wavelet transformation and
discrimination rules. EURASIP Journal on Advances in Signal Processing 2011
2011:43.
Figure 10 Detected and determined extreme points with our algorithm.
Table 2 Analysis results with our algorithm
Patients Before using discrimination rules After using discrimination rules
Undetected False detected Detected extreme points Undetected False detected Detected extreme points
1 60 140 2560 25 18 2717
2 58 143 2558 24 18 2717
3 62 138 2560 20 20 2720
4 55 140 2565 18 16 2726
5 58 140 2560 22 18 2718
6 44 128 2478 21 18 2611
7 52 130 2518 19 16 2665
8 60 135 2565 22 16 2722
9 59 138 2563 20 18 2722
Total 508 1232 22927 191 158 24318
Accuracy rate 92.5% Accuracy rate 98.58%
Ji et al. EURASIP Journal on Advances in Signal Processing 2011, 2011:43
/>Page 8 of 8