Phiếu bài tập ielts writing task 1 dạng gap filling vol 2
Bạn đang xem bản rút gọn của tài liệu. Xem và tải ngay bản đầy đủ của tài liệu tại đây (3.29 MB, 37 trang )
The graph below shows the consumption of fish and different kinds of meat in a European country between
1979 and 2004. Summarise the information by selecting and reporting the main features and make
comparisons where relevant. Write at least 150 words.
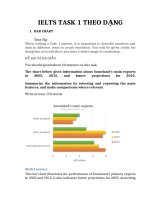
The graph illustrates the quantities of fish and different kinds of meats consumed in a European country
between the time period of 1979 and 2004. Over this span of 25 years, the consumption of beef, lamb and
fish have all decreased while the consumption of chicken has dramatically risen.
The biggest consumption in 1979 was beef (about 220 grams per person was consumed every week) while
the lowest consumption in 1979 was fish (around 60 gram per week was consumed by a person). The
amount of fish which was eaten has remained almost constant at about 50 grams from 1979 and 2004. The
trends of beef and lamb consumption were similar, with decreases in amount in between the years. While
beef consumption had declined from over 200 grams per person per week to around 100 grams during 25
years, lamb’s was starting 150 grams to approximately 50 grams at the same period.
In contrast, chicken consumption had grown up gradually to year of 194, reaching a peak at 250grams
per person every week in between 1994 and 2004.
The graph below shows the proportion of the population aged 65 and over between 1940 and 2040 in three
different countries. Summarise the information by selecting and reporting the main features and make
comparisons where relevant. Write at least 150 words.
The line graph compares the percentage of people aged 65 or more in three countries over a period of
100 years.
It is clear that the proportion of elderly people increases in each country between 1940 and 2040. Japan
is expected to see the most dramatic changes in its elderly population.
In 1940, around 9% of Americans were aged 65 or over, compared to about 7% of Swedish people and 5%
of Japanese people. The proportions of elderly people in the USA and Sweden rose gradually over the
next 50 years, reaching just under 15% in 1990. By contrast, the figures for Japan remained below 5%
until the early 2000s.
Looking into the future, a sudden increase in the percentage of elderly people is predicted for Japan,
with a jump of over 15% in just 10 years from 2030 to 2040. By 2040, it is thought that around 27% of the
Japanese population will be 65 years old or more, while the figures for Sweden and the USA will be
slightly lower, at about 25% and 23% respectively.
The graph below shows the number of Internet users as percentage of population. Summarise the information
by selecting and reporting the main features and make comparisons where relevant. Write at least 150 words.
The line graph compares the percentage of people in three countries who used the Internet between
1999 and 2009.
It is clear that the proportion of the population who used the Internet increased in each country over
the period shown. Overall, a much larger percentage of Canadians and Americans had access to the
Internet in comparison with Mexicans, and Canada experienced the fastest growth in Internet usage.
In 1999, the proportion of people using the Internet in the USA was about 20%. The figures for Canada
and Mexico were lower, at about 10% and 5% respectively. In 2005, Internet usage in both the USA and
Canada rose to around 70% of the population, while the figure for Mexico reached just over 25%.
By 2009, the percentage of Internet users was highest in Canada. Almost 100% of Canadians used the
Internet, compared to about 80% of Americans and only 40% of Mexicans.
The bar chart shows the relative electricity consumption and cost per year of various household devices.
Summarise the information by selecting and reporting the main features, and make comparisons where
relevant. Write at least 150 words.
The bar chart compares the energy consumption and expense of operating 16 different items of
household equipment. Overall, we can see significant differences in both cost and consumption.
To begin with, there are some common household items which consume relatively little energy. These
include an electric blanket (approx. $10 or 100kwh/year), a microwave oven (approx. $15 or 150kwh/year)
and a television (approx. $17 or 170kwh/year).
By contrast, devices that might be classified as ‘luxury’ items such as a pool pump or spa are
comparatively expensive and energy-intensive, at nearly $125 or 1500kwh/year and around $190 or
2225kwh/year respectively.
It is interesting to note that even among household items normally considered alike, such as a microwave
and refrigerator, there are enormous discrepancies in cost and energy use. The former uses only around
$15 or 150kwh/year, while the latter consumes at least six times that amount at $90 or 1150kwh/year.
In conclusion, it appears that there is no clear pattern in the relative energy consumption of domestic
equipment, although households had better be aware of the high running costs of luxury items such as a
pool pump and spa.
The bar chart below shows the percentage participation of men in senior development in three companies
between 1980 and the year 2010. Summarise the information by selecting and report in the main features, and
make comparisons where relevant. Write at least 150 words.
The bar chart shows the percentage of men in senior development position in three companies from 1980
to 2010.
While more men were in senior positions at Apple than other two companies in 1980 at 15%, the trend
was fairly erratic with a 2% drop to 13% in 1985, followed by a rise of 1% five years later. In 1995, men
held 7% more top development jobs than in 1990. After a slight drop back to 19% in 2000, by 2010 25% of
top posts were filled by men.
By contrast, at IBM men fared much better. In 1980, 2% of senior posts were occupied by men with no
change five years on. By 1990, the figure had increased to 13%, doubling to 26 per cent in 1995. Five
years afterwards, there was a 6% increase in male senior development jobs with a near twofold jump in
2010 to stand at 63%, the highest for the three companies.
The situation was less remarkable at Microsoft than the other two firms except for the year 2010. In
1980, the percentage of senior posts held by men was 8% climbing at the rate of 2% in each subsequent
period until 2000, after which it leapt to 45%. From the data, it is clear that men dominated senior posts
at IBM by 2010.
The chart below shows numbers of incidents and injuries per 100 million passenger miles travelled (PMT) by
transportation type in 2002. Summarize the information by selecting and reporting the main features and make
comparisons where relevant. Write at least 150 words.
The bar chart compares the number of incidents and injuries for every 100 million passenger miles
travelled on five different types of public transport in 2002.
It is clear that the most incidents and injuries took place on demand-response vehicles. By contrast,
commuter rail services recorded by far the lowest figures.
A total of 225 incidents and 173 injuries, per 100 million passenger miles travelled, took place on
demand-response transport services. These figures were nearly three times as high as those for the
second highest category, bus services. There were 76 incidents and 66 people were injured on buses.
Rail services experienced fewer problems. The number of incidents on light rail trains equalled the figure
recorded for buses, but there were significantly fewer injuries, at only 39. Heavy rail services saw lower
numbers of such events than light rail services, but commuter rail passengers were even less likely to
experience problems. In fact, only 20 incidents and 17 injuries occurred on commuter trains.
The chart illustrates the amount of money spent on five consumer goods (cars, computers, books, perfume
and cameras) in France and the UK in 2010. Units are measured in pounds sterling.
Overall, the UK spent more money on consumer goods than France in the period given. Both the British
and the French spent most of their money on cars whereas the least amount of money was spent on
perfume in the UK compared to cameras in France. Furthermore, the most significant difference in
expenditure between the two countries was on cameras.
In terms of cars, people in the UK spent about £450,000 on this as opposed to the French who spent
£400,000. Similarly, the British spent more money on books than the French (around £400,000 and
£300,000 respectively). In the UK, expenditure on cameras (just over £350,000) was over double that of
France, which was only £150,000.
On the other hand, the amount spent on the remaining goods was higher in France. Above £350,000 was
spent by the French on computers which was slightly more than the British who spent £300,000. Neither
of the countries spent much on perfume which accounted for £200,000 of expenditure in France but
under £150,000 in the UK.
The bar chart illustrates how many children, divided by gender, played six kinds of sports (tennis,
badminton, cycling, swimming, football and hockey) in a town in England in 2012.
Overall, the number of boys playing sport exceeded that of girls in the given period and the sport with
the most significant difference between the genders was football. Football was also the most popular
sport for boys while the majority of girls preferred swimming. Furthermore, both males and females least
preferred playing hockey.
There were four sports in which boys participated more than girls. While 60 boys played football, the
number of girls playing that sport was considerably lower (around 20). With regards to tennis, the figure
for boys who played that sport was 50 as opposed to just under 40 for girls. Similarly, more boys cycled
than girls (approximately 35and 20 respectively). The difference, in terms of hockey, was minimal with
only about 5 more boys playing that sport than girls.
On the other hand, more girls took part in the two remaining sports which both showed a difference of
about 10 between the genders. As many as 50 girls preferred swimming in comparison to 40 girls for
badminton.
The following pie charts show the results of a survey into the most popular leisure activities in the United
States of America in 1999 and 2009. Summarise the information by selecting and reporting the main features,
and make comparisons where relevant. You should write at least 150 words.
The graphs reveal information about the most common leisure activities which the American engaged in
between 1999 and 2009.
Overall, the largest percentage of people living in the US enjoyed walking.
As can be seen clearly, the figures for soccer, camping and walking increased slightly by 1%-2% to 18%,
9% and 31% respectively during the ten-year period. On the other hand, there was a nearly doubling in the
proportions of people joining in yoga (5 to 10 % ) and swimming ( 9 to 18% ) over the same period.
By contrast, the period shown witnessed a significant decrease in the percentages of American people
participating in the remaining activities. To be more specific, the figure for jogging nearly halved from
7% to 3%. What is more, there was a dramatic fall in the proportion of aerobics players from 13% to 4%
from 1999 to 2009 . Finally, when it comes to bicycling, the figure for this activity dropped from 14% to
7%.
The pie charts below show the comparison of different kinds of energy production of France in two years.
Summarise the information by selecting and reporting the main features, and make comparisons where
relevant. You should write at least 150 words.
The two pie charts illustrate five types of energy production in France in 1995 and 2005.
Overall, in both years, the most significant sources of energy were gas and coal, which together
accounted for over half the production of energy, while nuclear and other kinds of energy source generated
the least amount of energy in France. In all types of energy production there was only minimalchange over
the 10 year period.
Energy produced by coal comprised of 29.80% in the first year and this showed only a very slight
increase of about a mere 1 % to 30.9% in 2005. Likewise, in 1995, gas generated 29.63% which rose
marginally to 30.1% 10 years later.
With regards to the remaining methods of producing energy, there was an approximate 5% growth in
production from both nuclear power and other sources to 10.10% and 9.10% respectively. Petrol, on the
other hand, was the only source of energy which decreased in production from 29.27% in 1995 to around a
fifth (19.55%) in 2005.
Summarise the information by selecting and reporting the main features, and make comparisons where
relevant. Write at least 150 words.
The pie charts compare the highest level of education achieved by women in Someland across two years,
1945 and 1995.
It can be clearly seen that women received a much higher level of education in Someland in 1995 than
they did in 1945.
In 1945 only 30% of women completed their secondary education and 1% went on to a first degree. No
women had completed post-graduate studies. This situation had changed radically by 1995. In 1995, 90%
of women in Someland had completed secondary education and of those, half had graduated from an
initial degree and 20% had gone on to postgraduate studies.
At the other end of the scale we can see that by 1995 all girls were completing lower secondary, although
10% ended their schooling at this point. This is in stark contrast with 1945 when only 30% of girls
completed primary school, 35% had no schooling at all and 35% only completed the third grade.
In conclusion, we can see that in the 50 years from 1945 to 1995 there have been huge positive
developments to the education levels of women in Someland.
The table below gives information about consumer spending on different items in five different countries in
2002. Summarise the information by selecting and reporting the main features, and make comparisons where
relevant. Write at least 150 words.
The table illustrates the proportion of national expenditure in Ireland, Italy, Spain, Sweden and Turkey on
three categories of items in 2002.
Overall, all countries spent most on food, drinks and tobacco, which was almost three times that of the
other items. The lowest expenditure was on leisure and education in the five countries. The expenditure
of Turkey overall was higher than the other countries.
In terms of food, drinks and tobacco, Turkey spent the most at 32.14%. The expenditure of Ireland was
also high (28.91%) compared to Sweden which spent the least (15.77%). Spain and Italy spent 18.80% and
16.36% respectively.
Italy spent more than the other countries on clothing and footwear (9%) as opposed to the lowest
expenditure which could be seen in Sweden at 5.40%. The other three countries spent on average around
6.5%.
The lowest expenditure was on leisure and education which accounted for under 5% in all countries.
Turkey spent most on these items at just 4.35% of their national expenditure which is around double that
of Spain who spent the least at just 1.98%.
The table below gives information about the underground railway systems in six cities. Summarise the
information by selecting and reporting the main features, and make comparisons where relevant. Write at
least 150 words.