báo cáo hóa học: " Influence of dietary state and insulin on myocardial, skeletal muscle and brain [18F]fluorodeoxyglucose kinetics in mice" pptx
Bạn đang xem bản rút gọn của tài liệu. Xem và tải ngay bản đầy đủ của tài liệu tại đây (2.22 MB, 9 trang )
ORIGINAL RESEARCH Open Access
Influence of dietary state and insulin on
myocardial, skeletal muscle and brain [
18
F]-
fluorodeoxyglucose kinetics in mice
Michael C Kreissl
1,2*
, David B Stout
3
, Koon-Pong Wong
1
, Hsiao-Ming Wu
1
, Evren Caglayan
4
, Waldemar Ladno
3
,
Xiaoli Zhang
1
, John O Prior
1,5
, Christoph Reiners
2
, Sung-Cheng Huang
1
and Heinrich R Schelbert
1
Abstract
Background: We evaluated the effect of insulin stimulation and dietary changes on myocardial, skeletal muscle
and brain [
18
F]-fluorodeoxyglucose (FDG) kinetics and uptake in vivo in intact mice.
Methods: Mice were anesthetized with isoflurane and imaged under different conditions: non-fasted (n =7;
“controls“), non-fasted with insulin (2 IU/kg body weigh t) injected subcutaneously immediately prior to FDG (n =6),
fasted (n = 5), and fasted with insulin injection (n = 5). A 60-min small-animal PET with serial blood sampling and
kinetic modeling was performed.
Results: We found comparable FDG standardized uptake values (SUVs) in myocardium in the non-fasted controls and
non-fasted-insulin injected group (SUV 45-60 min, 9.58 ± 1.62 vs. 9.98 ± 2.44; p = 0.74), a lower myocardial SUV was
noted in the fasted group (3.48 ± 1.73; p < 0.001). In contrast, the FDG uptake rate constant (K
i
) for myocardium
increased significantly by 47% in non-fasted mice by insulin (13.4 ± 3.9 ml/min/100 g vs. 19.8 ± 3.3 ml/min/100 g; p =
0.030); in fasted mice, a lower myocardial K
i
as compared to controls was observed (3.3 ± 1.9 ml/min/100 g; p <0.001).
Skeletal muscle SUVs and K
i
values were increased by insulin independent of dietary state, whereas in the brain, those
parameters were not influenced by fasting or administration of insulin. Fasting led to a reduction in glucose metabolic
rate in the myocardium (19.41 ± 5.39 vs. 3.26 ± 1.97 mg/min/100 g; p < 0.001), the skeletal muscle (1.06 ± 0.34 vs.
0.34 ± 0.08 mg/min/100 g; p = 0.001) but not the brain (3.21 ± 0.53 vs. 2.85 ± 0.25 mg/min/100 g; p =0.19).
Conclusions: Changes in organ SUVs, uptake rate constants and metabolic rates induced by fasting and insulin
administration as observed in intact mice by small-ani mal PET imaging are consistent with those observed in
isolated heart/muscle preparations and, more importantly, in vivo studies in larger animals and in humans. When
assessing the effect of insulin on the myocardial glucose metabolism of non-fasted mice, it is not sufficient to just
calculate the SUV - dynamic imaging with kinetic modeling is necessary.
Background
The development of high-spatial-resolution small-animal
PET has opened a new field for translational research.
With these dedicated devices, regional organ tissue radio-
tracer concentrations can be visualized and measured.
Moreover, radiotracer tissue kinetic models initia lly
established and validatedinlargeranimalsandin
humans for measurements of regional functional
processes can now be applied to small animals. It is thus
possible to study myocardial substrate metabolism and
its determinants in intact animals rather than in isolated
hearts. Importantly, because PET allows simultaneous
measurements of radiotracer uptake and tissue kinetics
in multiple or gans such as skeletal muscle, brain, and
myocardium, system-wide response of individual organ
metabolic rates to physiological or pharmacological
stimuli can be evaluated.
The small organ size in these animals, together with
limitations in blood sampling, poses considerable metho-
dologi cal challenges. Accordingly, only few investigations
* Correspondence:
1
Department of Molecular and Medical Pharmacology, David Geffen School
of Medicine at UCLA, Los Angeles, CA, USA
Full list of author information is available at the end of the article
Kreissl et al. EJNMMI Research 2011, 1:8
/>© 2011 Kreissl et al; licensee Springer. This is an Open Access a rticle di stributed under the terms of th e Creative Commons Attribution
License ( which permits unrestricted use, distribution, and reproduction in any medium,
provided the original work is properly cited .
have attempted to measure glucose metabolic rates in the
myocardium, skeletal muscle, and brain in mice or rats
[1-6]; many of them addressed mainly methodological
aspects. Earlier studies from our laboratory have already
demonstrated the feasibility of determining the radiotra-
cer arterial input function and the tissue kinetics in myo-
cardium, skeletal muscle, and brain in intact mice [7-10].
The purpose of the current study was to determine, if
myocardial [
18
F]-fluorodeoxyglucose (FDG) kinetics in
mice in a non-fasting condition or a fasting condition dif-
fer after injection of insulin and furthermore assess the
effect on FDG kinetics in the muscle and brain. K nowl-
edge of the extent of these changes will assist in planning
future experiments for assessing glucose metabolism to
help decide if kinetic modeling is necessary or which
metab olic state would be the most suitable to answer the
scientific question.
Methods
Study design
Twenty-three male C57BL/6 mice (age 12-24 weeks,
Charles River Laboratories Inc., Wilmingt on, MA, USA)
were assigned to four study groups (Table 1). Non-
fasted, fed ad libitum mice served as “control group”
(n = 7). In the second group, defined as “non-fasted
insulin” (n = 6), mice were injected subcutaneously with
short-acting insulin (2 IU/kg body weight; Novolin R
Human, Novo Nordisk Pharmaceutical Industries Inc.,
Clayton, NC, USA) 30-60 s prior to the intravenous
(i.v.) FDG administration. In the third group, defined as
“ fasted,noinsulin” (n = 5), mice were kept without
chow overnight to assess the effects of fasting. Finally, in
the fourth group, defined as “fas ted, insulin” (n = 5), the
effect of acute insulin administration immediately prior
to the i.v. FDG on the FDG tissue kinetics was
examined.
All animals were kept on a normal 12-h day/night
cycle, had free access to water and were studied between
8 and 10 am to minimize circadian variations of sub-
strate metabolism. Standard chow (Teklad S-2335
Mouse Breeder Diet 7904, Harlan Teklad Animal Diets
& Bedding , Indianapolis, IN, USA; 17.0% protein, 11.0%
fat, and <3.5% fiber) was used. The study was approved
by the UCLA Animal Research Committee and per-
formed in accordance with NIH Guidelines for the Care
and Use of Laboratory Animals.
Animal preparation and imaging procedure
Mice were anesthetized by inhalation of 2% isof lurane
(Isoflo, Abbott Laboratories, North Chicago, IL, USA) in
100% oxygen in an induction box heated to 36°C. The
animals were placed on a heated PET-CT animal holder,
which provided anaesthesia through a nose cone [11]. A
29 G needle, attached to a 5-7 cm long polyethylene
catheter (PE 20; Intramedic, Clay Adams, Sparks, MD,
USA) was inserted into the proximal tail vein.
A 60-minute microPET list mode data acquisition was
started 2 - 5 seconds prior to an i.v. FDG bolus (18.1 ±
5.5 MBq in 30 μl). Five to 13 serial venous blood sam-
ples (warmed tail tip, 4-17 μl/sample) were collected
during the study from the tail tip for determination of
plasma FDG concentrations. Plasma glucose levels were
measured before and following insulin administration
(5-13 samples) using tail vein blood samples (~0.3 μl
each), with glucose test strips (Therasense
®
Freestyle
®
,
Therasense Inc., Alameda, CA, USA). Blood loss due to
blood sampling averaged 134.4 ± 40.0 μl, which was less
than 10% of the total blood volume of a mouse.
A microCT study (microCAT™ II, Siemens Preclinical
Solutions, Knoxville, TN, USA) was performed upon
completion of the PET study.
Image reconstruction and analysis
Small-animal PET was performed on a microPET
®
Focus
220 system (Siemens Preclinical Solutions). Starting at the
time of injection, the acquired list mode data were binned
into 30 image frames (15 × 0.5, 1 × 2, 1 × 4, 1 × 6, 1 × 15,
3 × 30, 1 × 60, 1 × 120, 3 × 180, 3 × 900 s). Reconstruction
incorporated a filtered backprojection algorithm with a
ramp filter and a cutoff frequency of 0 .5 of the Nyquist fre-
quency to obtain an image pixel size of 0.4 × 0.4 × 0.8 mm
and an inter-plane spacing and slice thickness of 0.8 mm
in a 128 × 128 matrix. The image reconstruction software
provided for correction of radioactivity de cay, random
coincidences, dead-time losses, and photon attenuation
(microPET
®
Manager v. 2.1.5.0; Siemens Preclinical Solu-
tions). Photon attenuation was corrected for by CT-derived
attenuation maps as described previously [12].
Quantitative image analysis
The software AMIDE [13] was used for image display and
volume of interest (VOI) analysis. A large cylindrical VOI
was assigned to the whole body of the mouse (109 cm
3
),
an ellipsoidal VOI to the brain (57.5 mm
3
) and four small,
same-size box VOIs (2.2 mm
3
each) to the myocardium as
visualized on the late phase PET images. Another small
box shaped VOI (1.4 mm
3
) was assigned to a proximal
foreleg muscle on the coregistered CT images. Finally, a
cylindrical VOI (2.6 mm
3
) was placed into the left ventri-
cle (LV) blood pool on the radiotracer first pass (early
time frame) images.
Table 1 Characteristics of the four study groups
Group no. n Metabolic condition Weight (g)
1 7 Non-fasted, no insulin; “controls” 28.9 ± 4.7
2 6 Non-fasted, insulin 28.3 ± 3.6
3 5 Fasted, no insulin 29.1 ± 4.1
4 5 Fasted, insulin 29.4 ± 5.1
Kreissl et al. EJNMMI Research 2011, 1:8
/>Page 2 of 9
Standardized uptake value (SUV) was calculated to
normalize the radiotra cer tissue concentrations to the
injected dose and body weight according to the follow-
ing equation:
S
UV =
mean tissue counts (count/milliliter/second)
injected dose
(
count/second
)
/body w eight
(
gram
)
(1)
The injected dose was estimated from the total counts
in the whol e-body VOI assigned to the last image frame
as described previously [14]. The tissue activity concen-
trations were obtained from the VOIs on the last 900-s
image.
Radiotracer concentrations in myocardium were deter-
mined from the average counts in the four myocardial
VOIs. For measurement of the radiotracer input func-
tion, blood sample radioactivity concentrations were
determined in a high-energy g counter (Packard Cobra
II Auto Gamma, Perkin Elmer Inc., Wellesley, MA,
USA). The input function was determined by a pre-
viously published method that uses the early portion
(t ≤ 1 min) of LV t ime-activity curve derived from
image data, adjusted for delay, dispersion, and partial-
volume effects, and two arterialized blood samples taken
from the tail vein at about 45 and 60 min p.i. [8].
Time-dependent changes in the distribution of FDG
concentrations in whole blood and plasma were cor-
rected for by the following equation established pre-
viously by our group [15]:
c
f=
0.386
·
e
−0.191·t
+1
.
1
65
(2)
where cf is the correction factor, t the time in minutes
after the FDG injection.
From the input function and the image-derived organ
FDG concentrations, the FDG uptake rate constant (K
i
)
was esti mated with the Gjedde-Patlak graphical analysis
[16,17]
C
T
(T)
C
P
(
T
)
= K
i
T
0
C
p
(t )dt
C
p
(T)
+IN
T
(3)
whereas C
T
(T)andC
p
(T) are the tissue and plasma
radioactivity concentrations at each sample time point T
(4 to 22 min; [9]), t is the integ rat ion variable, and INT
is the y-intercept of the graphical plot. All calculations
were performed with the internet-b ased software
“Kinetic Imaging System” [18]. Linearity of the graphical
plot was confirmed visually. For all assessed organs a
specific density of 1.00 g/ml was assumed.
Glucose metabolic rates (MR
gluc
)wereestimatedby
MR
gluc
=(K
i
× C
gluc
)/LC, where C
gluc
is the glucose con-
centration in plasma and LC the lumped constant. A
value of 1 was assumed for the lumped constant.
Because of marked changes in plasma glucose levels
after insulin administration, glucose metabolic rates
were estimated only for the groups without insulin
injection.
To evaluate group differences in the FDG plasma
clearance, the input function was normalized for body
weight and injected dose in the same way as the tissue
dataandexpressedasSUV.Sincethetimepointsof
blood sampling and plasma glucose measurements var-
ied slightly from mouse to mouse, interpolation was
applied for the inter-group analysis at predefined time
points.
Statistical analysis
Data are given with mean values and standard deviation.
Differences in SUVs, uptake rate constants, metabolic
rates, input functions, and plasma glucose levels in the
non-fasted control animals compared to the other ani-
mal g roups were evaluated for statistical significance by
one-way ANOVA analysis. Intra-group differences in
plasma FDG and glucose levels were evaluated using the
Student’s t test. When comparing more than two groups
Bonferroni post-hoc corrections were applied. p values <
0.05 were considered to indicate statistical significance.
Results
Influence of fasting and insulin administration on plasma
glucose and [
18
F]-activity concentrations
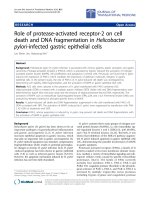
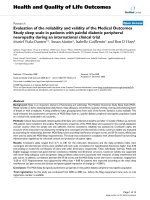
Plasma glucose levels in the control group were signifi-
cantly higher as compared to the fasted group (137 ± 17
vs. 98 ± 14 mg/dl; p = 0.009). Plasma glucose levels pro-
gressively increased in control animals within 60 min
(166 ± 25 mg/dl; p = 0.003), but remained relatively
constant in fasted animals (Figure 1). In both insulin
groups, plasma glucose levels steeply declined; by 30
min, they had decreased to 63.0 ± 4.8% and 70.8 ± 7.3%
of the initial values.
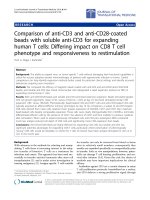
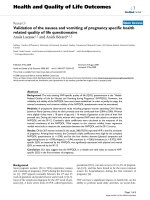
In fasted a nimals, plasma [
18
F]-activities declined less
rapidly during the microPET study as compared to non-
fasted controls (Figure 2). As early as 10 min p.i., [
18
F]-
activity concentrations were higher in fasted animals (p =
0.048), suggesting that circulating FDG remained avail-
able longer for uptake into tissue.
Insulin administration was associated with a faster
decline of [
18
F]-plasma activities especially in non-fasted
controls. Significantly lower values were noted already
after 15 min in the non-fasted insulin group and after
30 min in the fasted insulin group (Figure 2), consistent
with insulin-stimulated higher whole-body glucose and
FDG disposal rates.
FDG uptake, uptake rate constants, and glucose
utilization rates
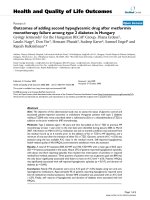
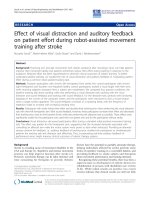
Figure 3 depicts representative PET images of the study
groups. Compared to the non-fasted control group, SUV
in myocardium of fasted mice was significantly lower
Kreissl et al. EJNMMI Research 2011, 1:8
/>Page 3 of 9
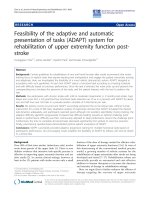
Figure 1 Plasma glucose levels in the four groups of mice. Insulin injection resulted in a rapid decline of plasma glucose levels.The
insulin injected groups were shifted by 0.3 min to reduce overlay of error bars. * p < 0.05 vs. non-fasted controls by ANOVA and after
Bonferroni correction.
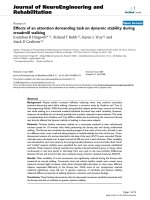
Figure 2 Plasma FDG concentrations in the four groups of mice. In both insulin groups FDG cleared from plasma more rapidly than in the
groups without insulin injection. Y axis is in logarithmic scale. The insulin injected groups were shifted by 0.3 min to reduce overlay of error
bars. * p < 0.05 vs. controls by ANOVA and after Bonferroni correction.
Kreissl et al. EJNMMI Research 2011, 1:8
/>Page 4 of 9
(3.48 ± 1.73 vs. 9.58 ± 2.44; p < 0.001, Table 2). In ske-
letal muscle, a trend for a lower SUV was observed
(0.40 ± 0.09 vs.0.55±0.11;p = 0.079). The brain SUV
was found to be higher in fasted compared to c ontrol
mice (2.87 ± 0.50 vs. 1.45 ± 0.42; p < 0.001). Interest-
ingly, myocardial SUV in non-fasted control mice did
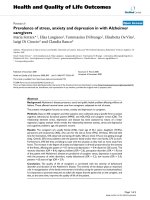
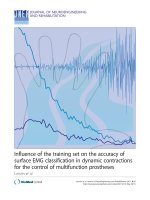
not increase with insulin administration. Graphical ana-
lysis was applied in all mice to calculate tissue specific
K
i
; correlation coefficients of least square fits averaged
R
2
= 0.984 ± 0.007. Examples of Patlak plots of a non-
fasted and an insulin treated mouse are shown in
Figure 4.
In parallel to calcul ated SUVs, myocardial K
i
values in
the fasted group were found to be significantly lower
(-75.5%) compared to non-fasted controls (Table 2; p <
0.001). Insulin administration produced a significant
increase in K
i
values in both groups. In contrast to SUV,
insulin led to an increase in K
i
in non-fasted animal s,
on average 43.5% (p = 0.030) compared to controls. In
fasted mice, insulin produced myocardial K
i
values,
which were more than 300% higher than without (20.0
± 12.7 vs.3.3±1.9;p < 0.001). Insulin stimulation led
to similar myocardial K
i
values in fasted mice as in non-
fasted controls despite a significant difference in plasma
glucose levels before the PET study.
In skeletal muscle, concordant changes in K
i
were
noted with the highest values after insulin administra-
tion (Table 2). Brain K
i
values were not affected by insu-
lin or fasting.
Consistent with the K
i
changes, MR
gluc
considerably
differed between the non-fasted and the fasted animals
in the insulin-sensitive organs (Table 2). Fasting was
associated with an 81% reduction in myocardial and a
68% reduction in skeletal muscle MR
gluc
when com-
pared to non-fasted controls.
Figure 3 Representative small-animal PET images. Myocardial uptake is very similar in control animals as compared to th e insulin-injected
animals, but in the skeletal muscle, more FDG uptake can be noted after insulin injection. In fasted animals, myocardial FDG is markedly
diminished. Sagittal (top) and transverse (bottom) views of one mouse of each group obtained 45-60 min p.i.
Table 2 Organ standardized uptake values (SUV), FDG
uptake rate constants (K
i
) and glucose metabolic rates
(MR
gluc
)
Myocardium Muscle Brain
SUV (45-60 min p.i.)
Non-fasted 9.5 ± 2.4 0.55 ± 0.11 1.45 ± 0.41
Non-fasted and insulin 9.98 ± 1.06 0.97 ± 0.29* 0.96 ± 0.11*
Fasted 3.48 ± 1.73* 0.40 ± 0.09 2.87 ± 0.50*
Fasted and insulin 9.35 ± 1.62 1.00 ± 0.24* 1.73 ± 0.41
K
i
(ml/min/100 g)
Non-fasted 13.44 ± 3.93 0.73 ± 0.25 2.24 ± 0.53
Non-fasted and insulin 19.79 ± 3.34* 1.89 ± 0.86* 2.52 ± 0.58
Fasted 3.34 ± 1.92* 0.36 ± 0.11* 2.99 ± 0.39
Fasted and insulin 20.01 ± 12.70 2.04 ± 1.80* 3.56 ± 1.21
MR
gluc
(mg/min/100 g)
Non-fasted 19.41 ± 5.39 1.06 ± 0.34 3.21 ± 0.53
Fasted 3.26 ± 1.97* 0.34 ± 0.08* 2.85 ± 0.23
*p < 0.05 vs. non-fasted contro ls by ANOVA and after Bonferroni correction.
Kreissl et al. EJNMMI Research 2011, 1:8
/>Page 5 of 9
Discussion
In this study, we in vestigated the effect of the metabolic
condition on the biodistribution and uptake rates of FDG
in mice. We found that FDG plasma clearance rates
depend on the dietary state and on insulin stimulation. It
was lowest in fasted animals, probably reflecting a dimin-
ished whole-body glucose disposal rate, as reflected in
the lower K
i
for myocardium and skeletal muscle and
possibly related to inhibitory effects of high plasma free
fatty acid concentrations on tissue uptake and a low
membranous expression of GLUT4. The marked increase
in plasma FDG clearance after insulin administration
corresponded to an increase in K
i
for myocardium and
skeletal muscle. Because skeletal muscle constitutes a sig-
nificant fraction of the body mass in mice [19], the
observed insulin-induced i ncrease in plasma clearance
rates can be attributed to an increase in skeletal muscle
FDG uptake and, thus, an increase in whole-body glucose
disposal rates.
Importantly, graphical analysis could be performed suc-
cessfully (Figure 4), even though plasma gluc ose concen-
trations differed between groups and markedly changed
over time. The finding suggests that F DG transmembra-
nous transport and phosphorylation rates remained
constant throughout the study, despite significant
changes in blood glucose levels. Insulin prompted
marked increases in transmem branous glucose transport
and phosphorylation rates, as re flected by K
i
. In addition,
progressively declining plasma glucose reduced substrate
competition for FDG transport and phosphorylation,
resulting in an increased FDG uptake rate constant that
probably compensated for any FDG clearance in tissue,
thus creating the apparent irreversible uptake of FDG
(i.e., linearity on the Patlak plot). In contrast, insulin had
no effect on cerebral K
i
, most likely due to the absence of
GLUT4 in the brain and insulin-independent cerebral
glucose metabolic rates.
Changes in myocardial SUV due to fasting and insulin
for the most part corresponded to changes in K
i
.How-
ever, this does not hold true for the non-fasted controls
and the non-fasted insulin group; here, myocardial K
i
was found to be increased after insulin injection even
though myocardial SUVs were similar in both groups.
This disparity may be related to a shortcoming of the
SUV as a widely employed measure of tissue FDG
uptake. Inherent in the use of SUV is the assumption of
a constant radiotracer input function. However, radio-
tracer input functions markedly differed between study
Figure 4 Results of the graphical analysis. Graphical analysis plots for myocardium, skeletal muscle, and brain in a non-fasted (A) and a non-
fasted, insulin injected (B) mouse. The actual observed data points are compared to the least square regression line.
Kreissl et al. EJNMMI Research 2011, 1:8
/>Page 6 of 9
groups. In the insulin-treated animals, FDG cleared
more rapidly from plasma so that a decreas e in circ ulat-
ing radiotracer activities was associated with a dispro-
portionately lower myocardial SUV.
Brain MR
gluc
, estimated only in the non-insulin-treated
mice with relatively stable plasma glucose l evels averaged
in a non-fasted state about 3.2 mg/min/100 g, a value very
comparable to that reported by o ur group in mice with
arterial catheters (2.2 mg/min/100 g) [9]. In the skeletal
muscle, the MR
gluc
in non-fasted control mice (about 1.1
mg/min/100 g) again was of a similar order of magnitude
as those reported for humans during insulin clamping
(about 4.9 mg/min/100 g) [20]. In the myocardium, the
MR
gluc
in mice (19.4 and 3.3 mg/min/100 g in non-fasted
and fasted mice, respectively) again were similar to those
in humans (12.4 and 4.3 mg/min/100 g after glucose load-
ing and fasting, respectively) [21].
Reduced heart a nd skeletal muscle glucose or FDG
metabolism under insulin clamping conditions in
patients with type 2 diabetes and coronary artery disease
(CAD) has been reported [22]. It has also been reported
that there was no difference in myocardial glucose meta-
bolism under glucose loading and under insulin clamping
in patients with CAD [23]. Reduced myocardial FDG
metabolism under fasting, g lucose loading, and insulin
clamping in patients with type 2 diabetes without CAD
has been reported [24]. On the other hand, myocardial
glucose metabolism in response to i nsulin clamping is
not always parallel to that in s keletal muscle and/or
whole-body glucose metabolism. For instance, myocar-
dial glucose metabolism was increased or unchanged
with insulin clamping in patients with essential hyperten-
sion, although skeletal muscle and whole-body glucose
metabolism were significantly reduced with insulin
clamping [25]. Myocardial glucose metabolism was not
reduced in patients with type 2 diabetes and essential
hypertension, even though skeletal muscle and whole-
body glucose metabolism was reduced [26]. In patients
with hypertriglyceridemia with out hypertension and dia-
betes, myocardial glucose metabolism was not signifi-
cantly reduced under insulin clamping, but skeletal
muscle and whole-body glucose metabolism was signifi-
cantly reduced [27]. These clinical results and the current
results, which showed different responses to insulin sti-
mulation regarding glucose metabolism between heart
and skeletal muscle, indicate that myocardium and skele-
tal muscle might have different mechanisms for regula-
tion of glucose or FDG uptake in response to insulin-
stimulation or insulin clamping.
Regardless of absolute values of K
i
and MR
gluc
,itis
important to note that dietary changes as well as insulin
administrations exerted responses in mice that are com-
parable to those in humans. Fasting diminished the
whole-body glucose disposal rates and glucose uptake in
myocardium and skeletal m uscle. Conversely, insulin
raised whole-body FDG and glucose disposal rates and
increased transmembranous transport of FDG and, by
inference, glucose into myocardium and skeletal muscle.
Some limitations have to beconsideredwheninter-
preting our findings. Firstly, no corrections were made
for spillover of activity between arterial blood and myo-
cardium. Activity spillover from myocardium into the
LV blood pool VOI during the initi al bolus passage and
the first 60 s used for determining the input f unction
was likely to be low as seen on the first-pass time-activ-
ity curves (Figure 5). Blood sampling for determination
of FDG plasma concentrations in the current study
eliminated spillover effects on the late phase of the
arterial input function; the validity of this method has
been shown before [8]. Secondly, it has been reported in
humans, that the lumped constant in the myocardium is
influenced by the insulin levels [28]. However in the
current study, a fixed value of 1.0 was used for all
groups because insulin levels were not available and also
because lumped constants have yet to be determined.
Thirdly, isoflurane anesthesia is known to affect myocar-
dial glucose uptake [29,30] and may have influenced the
results. These limitations are, however, unlikely to
reduce the validity of the inter-group comparison,
because the animals in the four study groups were of
similar body weight and, by infe rence, had similarly
sized organs and were exposed to the same anesthesia.
Identification of effects of substrate competition on
organ glucose utilization rates would have been useful
but would have required measurements of plasma free
fatty acid and lactate levels. The blood volume of mice
limits the amount of blood that can be taken from the
animals. Blood sampling was minimized to avoid exces-
sive stress and its effect on the metabolic state, as
reported previously [31]. The use of arterialized venous
blood samples for estimating glucose metabolic rates
has been well established in humans [32,33], as well as
in rats and mice [1,8].
Conclusions
In this study, we not only measured organ SUVs, uptake
rate constants, and glucose metabolic rates in intact
mice; we were also able to monitor alterations induced
by dietary changes and insulin administration. When
assessing the effect of insulin on the myocardial glucose
metabolism of non-fasted mice, it is not sufficient to
just calculate the SUV; dyna mic imaging with kine tic
modeling is necessary. The observed dietary and insulin-
induced changes in organ metabolic rates, as observed
in the current study, are similar to those reported for
humans.
Kreissl et al. EJNMMI Research 2011, 1:8
/>Page 7 of 9
Acknowledgements
This work was supported by NIH (National Institute of Health) grant R01
EB001943, NIH grant P50 CA086306, NIH-NCI grant 2U24 CA092865, and
DOE (Department of Energy) contract DE-FG02-06ER64249 and the IZKF
(Interdisciplinary Centre for Clinical Research) Würzburg. This publication was
funded by the German Research Foundation (DFG) and the University of
Würzburg in the funding programme Open Access Publishing.
Author details
1
Department of Molecular and Medical Pharmacology, David Geffen School
of Medicine at UCLA, Los Angeles, CA, USA
2
Klinik und Poliklinik für
Nuklearmedizin, Universitätsklinikum Würzburg, Würzburg, Germany
3
The
Crump Institute for Molecular Imaging, David Geffen School of Medicine at
UCLA, Los Angeles, CA, USA
4
Uniklinik Köln - Herzzentrum, Klinik III für
Innere Medizin, Cologne, Germany
5
Nuclear Medicine Division, Centre
Hospitalier Universitaire Vaudois (CHUV University Hospital) and University of
Lausanne, Lausanne, Switzerland
Authors’ contributions
MCK performed all animal experiments, developed the methodology,
analyzed the data, and wrote the manuscript. DBS provided advice in the
conception of the study in terms of methodology (heated animal chamber,
image reconstruction) and critically reviewed the manuscript. KPW helped in
the kinetic analyses and critically reviewed the manuscript. HMW provided
advice in the conception of the study and interpretation of the data,
performed experiments, and critically reviewed the manuscript. EC
performed the blood sampling and analyzed the data as well as critically
reviewing the manuscript. WL assisted in conducting the animal studies,
gave valuable input on animal handling, performed the image
reconstructions, and reviewed the manuscript. XZ helped perform the
animal studies, gave valuable input on the biological aspects and reviewed
the paper. JOP helped to statistically analyze and interpret the data and
considerably improved the manuscript in writing. CR provided intellectual
input, help in the statistics, and reviewed the manuscript. SCH is the co-PI of
this study and involved in the design and interpretation of the kinetic
modeling as well in writing the manuscript. HRS is the PI of the study and is
involved in all aspects of this work from design to writing. All authors read
and approved the final manuscript.
Competing interests
The authors declare that they have no competing interests.
Received: 13 March 2011 Accepted: 6 July 2011 Published: 6 July 2011
References
1. Fang YH, Muzic RF Jr: Spillover and partial-volume correction for image-
derived input functions for small-animal 18F-FDG PET studies. J Nucl Med
2008, 49:606-614.
2. Kim J, Herrero P, Sharp T, Laforest R, Rowland DJ, Tai YC, Lewis JS,
Welch MJ: Minimally invasive method of determining blood input
function from PET images in rodents. J Nucl Med 2006, 47:330-336.
3. Menard SL, Ci X, Frisch F, Normand-Lauziere F, Cadorette J, Ouellet R, Van
Lier JE, Benard F, Bentourkia M, Lecomte R, Carpentier AC: Mechanism of
reduced myocardial glucose utilization during acute
hypertriglyceridemia in rats. Mol Imaging Biol 2009, 11:6-14.
4. Schiffer WK, Mirrione MM, Dewey SL: Optimizing experimental protocols
for quantitative behavioral imaging with 18F-FDG in rodents. J Nucl Med
2007, 48:277-287.
5. Shimoji K, Ravasi L, Schmidt K, Soto-Montenegro ML, Esaki T, Seidel J,
Jagoda E, Sokoloff L, Green MV, Eckelman WC: Measurement of cerebral
glucose metabolic rates in the anesthetized rat by dynamic scanning
with 18F-FDG, the ATLAS small animal PET scanner, and arterial blood
sampling. J Nucl Med 2004, 45:665-672.
6. Shoghi KI, Welch MJ: Hybrid image and blood sampling input function
for quantification of small animal dynamic PET data. Nucl Med Biol 2007,
34:989-994.
Figure 5 Distribution of FDG in the LV blood pool and the myocardium in the early phase of the study. Initial phase of the radiotracer
input function in a “control animals” from VOIs assigned to LV blood pool and myocardium. The time axis is plotted logarithmically. A spillover
of radioactivity could be observed no earlier than 100 s p.i Since only the first 60 s of the LV blood pool time-activity curve were used for the
image-derived input function the influence activity spillover from the myocardium into the blood pool can be expected to be negligible.
Kreissl et al. EJNMMI Research 2011, 1:8
/>Page 8 of 9
7. Huang SC, Wu HM, Shoghi-Jadid K, Stout DB, Chatziioannou A,
Schelbert HR, Barrio JR: Investigation of a new input function validation
approach for dynamic mouse microPET studies. Molecular Imaging and
Biology 2004, 6:34-46.
8. Ferl GZ, Zhang X, Wu HM, Huang SC: Estimation of the 18F-FDG input
function in mice by use of dynamic small-animal PET and minimal
blood sample data. J Nucl Med 2007, 48:2037-2045.
9. Yu AS, Lin HD, Huang SC, Phelps ME, Wu HM: Quantification of cerebral
glucose metabolic rate in mice using 18F-FDG and small-animal PET.
J Nucl Med 2009, 50:966-973.
10. Wu HM, Sui G, Lee CC, Prins ML, Ladno W, Lin HD, Yu AS, Phelps ME,
Huang SC: In vivo quantitation of glucose metabolism in mice using
small-animal PET and a microfluidic device. J Nucl Med 2007, 48:837-845.
11. Suckow C, Kuntner C, Chow P, Silverman R, Chatziioannou A, Stout D:
Multimodality rodent imaging chambers for use under barrier
conditions with gas anesthesia. Mol Imaging Biol 2009, 11:100-106.
12. Chow PL, Rannou FR, Chatziioannou AF: Attenuation correction for small
animal PET tomographs. Phys Med Biol 2005, 50:1837-1850.
13. Loening AM, Gambhir SS: AMIDE: a free software tool for multimodality
medical image analysis. Mol Imaging 2003, 2:131-137.
14. Berger F, Lee YP, Loening AM, Chatziioannou A, Freedland SJ, Leahy R,
Lieberman JR, Belldegrun AS, Sawyers CL, Gambhir SS: Whole-body skeletal
imaging in mice utilizing microPET: optimization of reproducibility and
applications in animal models of bone disease. Eur J Nucl Med Mol
Imaging 2002, 29:1225-1236.
15. Wu HM, Kreissl MC, Prins M, Truong D, Ladno W, Chatziioannou A,
Schelbert HR, Huang SC: Derivation of input function from mouse
dynamic 2-deoxy-2-[18F]fluoro-d-glucose-positron emission tomography
images: the significance of partial volume correction [abstract]. Mol
Imaging Biol 2005, 7:162.
16. Gjedde A: Origins of the Patlak plot. Nucl Med Commun 1995, 16:979-980.
17. Patlak CS, Blasberg RG: Graphical evaluation of blood-to-brain transfer
constants from multiple-time uptake data. Generalizations. J Cereb Blood
Flow Metab 1985, 5:584-590.
18. Huang SC, Truong D, Wu HM, Chatziioannou AF, Shao W, Wu AM,
Phelps ME: An Internet-Based “Kinetic Imaging System” (KIS) for
MicroPET. Mol Imaging Biol 2005, 1-12.
19. Griffin GE, Goldspink G: The increase in skeletal muscle mass in male and
female mice. Anat Rec 1973, 177:465-469.
20. Hallsten K, Virtanen KA, Lonnqvist F, Sipila H, Oksanen A, Viljanen T,
Ronnemaa T, Viikari J, Knuuti J, Nuutila P: Rosiglitazone but not metformin
enhances insulin- and exercise-stimulated skeletal muscle glucose
uptake in patients with newly diagnosed type 2 diabetes. Diabetes 2002,
51:3479-3485.
21. Choi Y, Brunken RC, Hawkins RA, Huang SC, Buxton DB, Hoh CK, Phelps ME,
Schelbert HR: Factors affecting myocardial 2-[F-18]fluoro-2-deoxy-d-
glucose uptake in positron emission tomography studies of normal
humans. Eur J Nucl Med 1993, 20:308-318.
22. Voipio-Pulkki LM, Nuutila P, Knuuti MJ, Ruotsalainen U, Haaparanta M,
Teras M, Wegelius U, Koivisto VA: Heart and skeletal muscle glucose
disposal in type 2 diabetic patients as determined by positron emission
tomography. J Nucl Med 1993, 34:2064-2067.
23. Knuuti MJ, Nuutila P, Ruotsalainen U, Saraste M, Harkonen R, Ahonen A,
Teras M, Haaparanta M, Wegelius U, Haapanen A, et al: Euglycemic
hyperinsulinemic clamp and oral glucose load in stimulating myocardial
glucose utilization during positron emission tomography. J Nucl Med
1992, 33:1255-1262.
24. Ohtake T, Yokoyama I, Watanabe T, Momose T, Serezawa T, Nishikawa J,
Sasaki Y: Myocardial glucose metabolism in noninsulin-dependent
diabetes mellitus patients evaluated by FDG-PET. J Nucl Med 1995,
36:456-463.
25. Nuutila P, Maki M, Laine H, Knuuti MJ, Ruotsalainen U, Luotolahti M,
Haaparanta M, Solin O, Jula A, Koivisto VA, et al: Insulin action on heart
and skeletal muscle glucose uptake in essential hypertension. J Clin
Invest 1995, 96:1003-1009.
26. Yokoyama I, Ohtake T, Momomura S, Yonekura K, Yamada N, Nishikawa J,
Sasaki Y, Omata M: Organ-specific insulin resistance in patients with
noninsulin-dependent diabetes mellitus and hypertension. J Nucl Med
1998, 39:884-889.
27. Yokoyama I, Ohtake T, Momomura S, Yonekura K, Kobayakawa N, Aoyagi T,
Sugiura S, Yamada N, Ohtomo K, Sasaki Y, et al: Insulin action on heart
and skeletal muscle FDG uptake in patients with hypertriglyceridemia. J
Nucl Med 1999, 40:1116-1121.
28. Botker HE, Bottcher M, Schmitz O, Gee A, Hansen SB, Cold GE, Nielsen TT,
Gjedde A: Glucose uptake and lumped constant variability in normal
human hearts determined with [18F]fluorodeoxyglucose. J Nucl Cardiol
1997, 4:125-132.
29. Toyama H, Ichise M, Liow JS, Vines DC, Seneca NM, Modell KJ, Seidel J,
Green MV, Innis RB: Evaluation of anesthesia effects on [18F]FDG uptake
in mouse brain and heart using small animal PET. Nucl Med Biol 2004,
31:251-256.
30. Fueger BJ, Czernin J, Hildebrandt I, Tran C, Halpern BS, Stout D, Phelps ME,
Weber WA: Impact of Animal Handling on the Results of 18F-FDG PET
Studies in Mice. J Nucl Med 2006, 47:999-1006.
31. Pessotto P, Liberati R, Petrella O, Hulsmann WC: Alteration of tissue
carnitine content following anaesthesia with barbiturate and surgery in
rat. Int J Clin Pharmacol Res 1995,
15:191-199.
32. Brock CS, Young H, Osman S, Luthra SK, Jones T, Price PM: Glucose
metabolism in brain tumours can be estimated using [18F]2-
fluorodeoxyglucose positron emission tomography and a population-
derived input function scaled using a single arterialised venous blood
sample. Int J Oncol 2005, 26:1377-1383.
33. Yokoyama I, Inoue Y, Moritan T, Ohtomo K, Nagai R: Measurement of
skeletal muscle glucose utilization by dynamic 18F-FDG PET without
arterial blood sampling. Nucl Med Commun 2005, 26:31-37.
doi:10.1186/2191-219X-1-8
Cite this article as: Kreissl et al.: Influence of dietary state and insulin on
myocardial, skeletal muscle and brain [
18
F]-fluorodeoxyglucose kinetics
in mice. EJNMMI Research 2011 1:8.
Submit your manuscript to a
journal and benefi t from:
7 Convenient online submission
7 Rigorous peer review
7 Immediate publication on acceptance
7 Open access: articles freely available online
7 High visibility within the fi eld
7 Retaining the copyright to your article
Submit your next manuscript at 7 springeropen.com
Kreissl et al. EJNMMI Research 2011, 1:8
/>Page 9 of 9