Báo cáo hóa học: " Thickness-dependent optimization of Er3+ light emission from silicon-rich silicon oxide thin films" pdf
Bạn đang xem bản rút gọn của tài liệu. Xem và tải ngay bản đầy đủ của tài liệu tại đây (1.36 MB, 6 trang )
NANO EXPRESS Open Access
Thickness-dependent optimization of Er
3+
light
emission from silicon-rich silicon oxide thin films
Sébastien Cueff
1
, Christophe Labbé
1
, Olivier Jambois
2
, Blas Garrido
2
, Xavier Portier
1
and Richard Rizk
1*
Abstract
This study investigates the influence of the film thickness on the silicon-excess-mediated sensitization of Erbium
ions in Si-rich silica. The Er
3+
photoluminescence at 1.5 μm, normalized to the film thickness, was found five times
larger for films 1 μm-thick than that from 50-nm-thick films intended for electrically driven devices. The origin of
this difference is shared by changes in the local density of optical states and depth-dependent interferences, and
by limited formation of Si-based sensitizers in “thin” films, probably because of the prevailing high stress. More Si
excess has significantly increased the emission from “thin” films, up to ten times. This paves the way to the
realization of highly efficient electrically excited devices.
Background
The realization of efficient Si-based optical emitters for
photonics is one of the most challenging objectives for
the semiconductor community [1]. Such a purpose is
confronted to the indirect band gap of bulk silicon
which makes difficult the light emission from Si, and
then presents a major obstacle to full photonic-electro-
nic integration. However, the indirect sensitizatio n of
emission from erbium ions, via Si nanoclusters (Si-nc),
in the technologically important 1.5-μm spectral region
is a promising approach that has received significant
attention. Such a sensitizing effect of Si-ncs increases
the effective excitation cross section of Er by 10
3
-10
4
over a broad band in Si-rich silicon oxide (SRSO) sys-
tems [2]. This leads to the observation of enhanced Er
photoluminescence (PL) and elect roluminescence in the
standard telecommunications wavelength band around
1.54 μm [2,3]. Depending on the targeted application,
the thickness of the active layer can vary over a large
range, from a micrometer-scale for planar waveguide
amplifiers [4] to a few tens of nanometers for electrically
driven LEDs [3] or slot wavegui des [5]. According to
recent studies, layer thickness was shown to influence
the nucleation and growth of Si-ncs [6-8], as well as the
effective intensity of the pump beam [9] and the local
density of optical states (LDOS) [10,11]. This thickness
dependence is cruci al since each application requiring a
given thickness may necessitate a s pecific optimization
of the material.
In this paper, we investigate the impact of layer thick-
ness on the optical properties of SRSO:Er thin films.
The results demonstrate that the photoluminescence in
very thin layers is hindered by some thinness-related
limiting factors. To overcome this drawback of thin
layer, more Si excess was gradually incorpor ated until a
level of Er emission that was found surprisingly higher
than that observed in optimized m icrometer-thick
layers.
Experimental details
The SRSO films doped with Er were grown onto a p-
type, 250-μm thick, (100) silicon wafer, by magnetron
co-sputtering of three confocal cathodes (SiO
2
,Siand
Er
2
O
3
)underaplasmaofpureArgonatapressureof2
mTorr. The power densities applied on the three confo-
cal targets were kept constant, while the deposition was
performed at two temperatures T
d
, room temperature
(RT) and 500°C, for various durations between 20 min
and 10 h. To examine the influence of Si excess for a
set of th in films of about 50 nm in thickness, the power
density on the Si target was subsequently increased. The
thickness and refractive index n were measured by spec-
troscopic ellipsometry for films thinner than 500 nm
and by m -lines techniques for films exceeding 500 nm
in thickness. The thickness shows a linear variation with
the deposition duration. The PL spectra were recorded
* Correspondence:
1
Centre de Recherche sur les Ions, les Matériaux et la Photonique (CIMAP),
ENSICAEN, CNRS, CEA/IRAMIS, Université de Caen, 14050 CAEN cedex, France
Full list of author information is available at the end of the article
Cueff et al. Nanoscale Research Letters 2011, 6:395
/>© 2011 Cueff et al; licensee Springer. This is an Open Access article distributed under the terms of the Creative Commons Attribution
License (http://creativecommons. org/licenses/by/2.0), which permits unrestricted use, distribution, and reproduction in any medium,
provided the original work is properly cited.
using the non-resonant 476-nm excitation wavelength in
order to ensure that Er
3+
ions are only excited through
the sensitizers. The samples were excited with 45° inci-
dent spot of approximately 3 mm
2
with a power of 180
mW, i.e., a power density of 0.06 W/mm
2
.TheErcon-
tent was obtained by time-of-flight secondary ion mass
spectroscopy technique after calibration by a reference
SRSO:Er sample containing a known Er concentration.
The erbium concentration was found nearly constant
for all samples at about 3 × 10
20
at. cm
-3
. The Si excess
was evaluated by two methods: X-ray photoelectron
spectroscopy (XPS) exploring beyond 100-nm depth (or
total thickness for thinner films) in different places, and
Fourier transform infrared (FTIR) spectroscopy with a
spot covering a large area of the sample. Transmission
electron microscopy (TEM) observations were per-
formed using a JEOL 2010F operated at 200 kV.
Results
TypicalSi2p and O 1s XPS spectra of the sample
deposited at 500°C for 1 h are displayed in Figure 1.
The values of Si excess were determined by measure-
ment of the ratios of the atomic concentration of Si and
O(x = [O]/[Si]), that were deduced from the area of the
Si 2p and O 1s spectra and compared to a stoichio-
metric SiO
2
sample. The XPS measurements are per-
formed while etching the s ample with Ar in t he same
time, allowing the determination of the Si excess depth
profile. The reported values correspond to the value
read in the flat region (see inset Figure 1b). For the
thinner layer, the thickness is still large enough to be
able to obta in a goo d depth resolution. The fla tness of
the profiles along almost the whole thickness demon-
strates that t he thickness of the material has no i nflu-
ence on the stoichiometry of the deposited SiO
x
.
However, the x parameter was found to increase from x
= 1.555 ± 0.004 for RT-deposited samples to x =1.616
± 0.009 for T
d
= 500°C. This reflects a lowering of Si
excess due to the increasing desorption of SiO with T
d
,
as observed in our recent work [12]. For the FTIR
approach, which is based on the shift of the TO
3
peak
towards that of stoichiometric SiO
2
[13], the detection
of Si excess is limited to the Si atoms bonded to O, and
does not take into account the agglomerated Si atoms
[13]. However, this limitation can be used to advantage
by comparing values of Si excess measured by FTIR to
those determined by XPS, enabling evaluation of the
fraction of agglomerated Si. Since the phase separation
between Si and SiO
2
is incomplete for the as-deposited
samples, the following relation holds:
S
iO
x
→
x
y
SiO
Y
+
y − x
y
S
i
(1)
with y the stoi chiometry parameter (SiO
y
) detected by
FTIR, implying x <y < 2. The atomic percentage of
agglomerated Si, %Si
agglo
, can be estimated from ((y - x)/
y)/(1 + x) and its evolution with thickness is shown in
Figure 2 for the two series deposited at R T and 500°C.
A single isolated Si atom is highly likely not able to act
as a sensitizer, therefore this parameter (%Si
agglo
)
includes the total population of Si-based sensitizers con-
sisting in either Si-ncs, the so-called luminescent centers
of Savchyn et al. [14], or the atomic scaled agglomerates
suggested recently by our group [15]. To effectively play
their sensitizing role, these entities should be located at
less than about 1 nm of an optically active Er ion. Figure
2 shows that the agglomeration of Si is favored by
increased T
d
and/or film thickness. While the raise of
T
d
from RT to 500°C is expected to enhance the cluster-
ing of silicon during deposition, the most striking aspect
is the pronounced increase of %Si
agglo
versus thickness.
Note that the fraction of agglomerated Si in both RT-
deposited and 500°C-deposited samples shows a similar
a)
b)
Figure 1 Typical XPS spectra obtained on the sample
deposited at 500°C and about 150 nm thick.In(a) is displayed
the O 1s spectrum and (b) corresponds to Si 2p spectrum. The inset
of (b) depicts the profile of %Si excess versus depth.
Cueff et al. Nanoscale Research Letters 2011, 6:395
/>Page 2 of 6
increasing trend, but less pronounced for the former
one, suggesting t hat this phenomenon stems from the
influence of the thickness. Such an influence has been
demonstrated earlier and assigned to the existence of a
nucleation barrier for the formation of Si-nc as a func-
tion of the separation distance from the substrate, i.e.
the film thickness [6-8]. This barrier is likely induced by
the stress that is inversely proportional to fil m thickness
[16], and thus prevents a complete phase separation of
the SiO
x
system [17]. For an unchanged stoichiometry,
the relative e volution of the i nternal stress of SiO
2
deposited on Si substrate has been linked to its refrac-
tive index by the following relation [18]:
σ
OX
=
n
(
σ
OX
)
− n
0
n
σ
O
X
(2)
with n(s
ox
) the refractive index for a given thickness, n
0
the refractive index for relaxed or “bulk” SiO
2
(1.458) and
Δn/Δs
ox
=9.10
-12
Pa
-1
, taken from Ref. [18]. The inset in
Figure 2, shows a pronounced increase of n for a range of
our thin films (<150 nm) for b oth matrix (SiO
2
and
SRSO) and is similar to that reported in Ref. [18], hence
attesting of a thickness-dependent stress. The s tress dif-
ference can be estimated to 4-6 GPa between the thinnest
and thickest films . The main origin of this internal stress
arises from the misfit between the substrate and the film.
Its progressive increase when the films’ thickness is
reduced seems to inhibit the agglomeration of Si.
Accordingly, the PL properties of typical “thin” and
“ thick” layers deposited at 500°C can be compared.
Figure 3 shows typical variations of the PL intensity
(normalized to the thickness) of emission, both from Si-
ncs around 750 nm, and from Er ions around 1.5 μm
(see inset), as a function of the annealing temperature
(T
a
). The influence of T
a
on the agglomeration of Si
excess was previously studied [19] and it was shown
that the value of %Si
agglo
increases almost linearly versus
T
a
before reaching a complete agglomeration at 1,100°C,
whatever the temperature of deposition and the %Si
ex-
cess
. Three major observations can be made: (1) Er PL
shows the same evolution for both “thin” and “thick”
samples, with an optimum for T
a
= 900°C, (2) The Si-
nc-PL detected from the thick sample rises spectacularly
for T
a
= 1,100°C. This opposite behavior of the Si-nc
and Er emissions for thick films has b een already
observed and explained [20,21]. By contrast, no Si-nc PL
emission is detected from the thin films, even after a
1,100°C annealing. This phenomenon is due to the lo w
fraction of agglomerated Si (see Figure 2), and is con-
firmed in Figure 4 by TEM images of both thin and
thick samples annealed at 1,100°C that shows the pre-
sence of well-defined crystallized Si-ncs in thick samples
but not in the thin one. Such inhibition of the nuclea-
tion of Si-nc in thin films was already assumed in sev-
eral studies b ased on PL results [6,10] but these TEM
images are direct evidence of this phenomenon. (3) The
Er emission is almost four times lower for the thin sam-
ple for all T
a
. Such a gap between the Er PL from the
“thin” and “thick” samples deserves further attention.
The above-mentioned limitations (stress) and d epth-
dependent optical effects (LDOS, interference) related to
0 300 600 900 1200 1500 1800
0
1
2
3
4
5
6
7
0 300 600 900 1200
1.46
1.48
1.50
Refractive index @ 633 nm
Increase of stress
'
'V
ox
(GPa)
Thickness (nm)
SiO
2
:Er
1.54
1.56
1.58
SRSO:Er
0
2
4
6
0
2
4
% Agglomerated Si (At.%)
Thickness
(
nm
)
RT-AsDep
500°C-AsDep
Figure 2 Evolution of the estimated atomic percentage of
agglomerated Si as a function of the film thickness. For as-
deposited SRSO:Er layers deposited both at room temperature and
at 500°C. The lines are guides to the eye. Inset: evolution of the
refractive index and estimated increase of the compressive stress
(right scale) for SiO
2
:Er and SRSO:Er as a function of the thickness.
600 700 800 900 1000 1100
0
1
2
3
4
5
6
7
8
500 600 700 800 900 1000 1100
0.00
0.25
0.50
0.75
1.00
1.25
PL Intensity @ 1.53 µm (a.u.)
Annealing temperature (°C)
830 nm
54 nm
Si-PL
Er-PL
PL Intensity (a. u.
)
Annealing temperature
(
°C
)
Figure 3 Evolution of the inte grated PL visible e mission as a
function of the annealing temperature. For two typical
thicknesses (54 and 830 nm) of the samples deposited at 500°C. The
inset displays the evolution of the corresponding Er PL intensity at
1.54 μm (normalized to film thickness) as a function of annealing
temperature.
Cueff et al. Nanoscale Research Letters 2011, 6:395
/>Page 3 of 6
the film thinness are to be circumvented and/or consid-
ered. To estimate the impact of both interference-
induced variations of the pumping and LDOS effects,
we made calculations based on the methods described
in Refs. [9] and [10], respectively. Their specific contri-
butions at a distance z from the substrate were then
estimated, and their product integrated over the thick-
ness has allowed the calculation of their combined con-
tributions, I
cal
, on the measured Er PL intensity, I
PL
.
The calculated intensity I
cal
is compared in Figure 5a to
I
PL
. For the sake of comparison, both I
cal
and I
PL
are
normalized to the highest values, at 1,400 nm where the
stress effect on the Er PL intensity can be relatively
neglected. While I
PL
showsanabruptdecreaseatabout
200 nm, indicated by the vertical dashed line of Figure
5b, I
cal
shows a smaller reduction down to a level signif-
icantly higher than the corresponding level for I
PL
.An
approximately five-time lowering of I
PL
and nearly 1.5
times decrease of I
cal
occur at the thickness threshold of
approximately 200 nm, beyond which the above-men-
tioned limitations are less effe ctive. The additional
reduction of I
PL
, compared to I
cal
can be attribut ed to a
stress effect which affects the formation and ho mogene-
ity of the sensitizers.
To overcome these limitations, we have gradually
raised the Si excess in approximately 50-nm-thick films,
with the objective of increasing the number of Si-based
sensitizers. We show in Figure 5b the evolutions of I
PL
containing approximately 7.5 at.% Si excess (circles) as a
function of the film thickness and I
PL
of thin films
(approximately 50 nm) with different Si exc ess (squares)
for the samples processed using optimized conditions
(T
d
= 500°C, T
a
= 900°C, see Figure 3).
We plot in the inset of Figure 5b the evolutions of I
PL
in function of the Si excess for the 50-nm-thick films.
The I
PL
optimum is reached for about 14 at.%, before
decreasing for higher Si contents. In parallel, we observe
a gradual and systematic decrease of the lifetime of Er
emission, from nearly 1.8 ms to about 1 ms (not
shown). This reflects the creation of new n on-radiative
decay channels [22], which should attenuate the Er PL.
For Si excess lower than 14 at.%, such an attenuation is
somehow dominated by the increase of excita tion of Er
3
+
ions through more sensitizers. Beyond 14 at.%, the
new non-radiative decay channels start to dominate,
leading to the observed decline of Er PL [22]. The Er PL
peak intensity is ten times that of the similar thin film
containing 7.5 at.% excess Si, and five times that
observed for optimized thick samples containing 7.5 at.
% excess Si (see corresponding symbols at the left part
of Figure 5). Such an optimisation of the Si excess for
1-μm-thick samples was made earlier [15]. The opti-
mum Si excess in these 50-nm-thick films is almost
twice the excess incorporated in the best thin layers stu-
died so far by our team [3]. This offers the double
advantage of minimizing the limiting factors present in
thin films, and favoring the transport of electrically
injected carriers. In addition, the proportion of Er ions
a)
b)
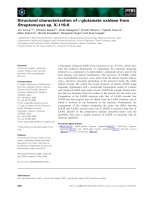
Figure 4 Transmission electron microsco pe images, of samples deposited at 500°C for two different thicknesses.(a)50nmand(b)
1,400 nm. In “thin” film (a) no Si-nc was detected throughout the whole area of the sample, while in “thick” film (b) numerous well-crystallized
Si-ncs are seen with diameter as high as 5 nm. The observed darker regions in (b) are accounted for Er-clusters and are observed also in some
regions of “thin” films.
Cueff et al. Nanoscale Research Letters 2011, 6:395
/>Page 4 of 6
coupled to sensiti zers is likely to b e significantly
improved, allowing one to expect a fraction of inverted
Er much higher than the reported 20% [3].
Conclusions
In summary, the influence of layer thickness on the
photoluminescence o f Er ions has been investigated
for SRSO:Er layers. It was shown that thinness-related
effects decrease the PL for thin films by a fa ctor of 5.
These effects are mainly due to three origins: (1) high
stress prevailing in thin films t hat inhibits the forma-
tion of Si nanoclusters, (2) changes in LDOS, and (3)
changes in the pumping rates. To minimize the thin-
ness-related limitations in thin films, the amount of Si
excess was gradually increased until reaching an E r PL
intensity one order of magnitude higher than that
recorded earlier for similar thin samples. Such a route
appears very promising for the improvement of elec-
trically driven high-performance Si-based light
sources.
Acknowledgements
The authors would like to thank Dr. A. J. Kenyon (University College London)
and Dr. R. J. Walters (FOM institute Amsterdam) for fruitful discussions.
Author details
1
Centre de Recherche sur les Ions, les Matériaux et la Photonique (CIMAP),
ENSICAEN, CNRS, CEA/IRAMIS, Université de Caen, 14050 CAEN cedex, France
2
Departament Electrònica, MIND-IN2UB, Universitat de Barcelona, Martí i
Fanquès 1, 08028 Barcelona, CAT, Spain
Authors’ contributions
SC fabricated the samples and performed the experiments, except SIMS and
XPS measurements made by OJ who also helped in the estimate of
agglomerated Si. CL made the calculations dealing with the effects of
interferences and local density of optical states, in addition to specific
contributions in each steps of the study. XP carried out the TEM
experiments. BG participated to the finalization of the manuscript. RR drafted
the manuscript, together with contributions to the analysis of the results. All
authors discussed and commented on the manuscript.
Competing interests
The authors declare that they have no competing interests.
Received: 25 January 2011 Accepted: 25 May 2011
Published: 25 May 2011
References
1. N Daldosso, L Pavesi, Nanosilicon photonics. Laser & Photonics Reviews. 3,
508–534 (2010)
2. AJ Kenyon, PF Trwoga, M Federighi, CW Pitt, Optical properties of PECVD
erbium-doped silicon-rich silica: evidence for energy transfer between
silicon microclusters and erbium ions. J Phys: Condens Matter. 6, L319
(1994). doi:10.1088/0953-8984/6/21/007
3. O Jambois, F Gourbilleau, AJ Kenyon, J Montserrat, R Rizk, B Garrido,
Towards population inversion of electrically pumped Er ions sensitized by Si
nanoclusters. Opt Exp. 18, 2230 (2010). doi:10.1364/OE.18.002230
4. N Daldosso, D Navarro-Urrios, M Melchiorri, C García, P Pellegrino, B Garrido,
C Sada, G Battaglin, F Gourbilleau, R Rizk, L Pavesi, Er-coupled Si nanocluster
waveguide. IEEE J Sel Top Quant Electron. 12, 1607 (2006)
5. CA Barrios, M Lipson, Electrically driven silicon resonant light emitting
device based on slot-waveguide. Opt Exp. 13, 10092 (2005). doi:10.1364/
OPEX.13.010092
6. YC Fang, WQ Li, LJ Qi, LY Li, YY Zhao, ZJ Zhang, M Lu, Photoluminescence
from SiO
x
thin films: effects of film thickness and annealing temperature.
Nanotechnology. 15, 494 (2004). doi:10.1088/0957-4484/15/5/016
7. I Ahmad, MP Temple, A Kallis, M Wojdak, CJ Oton, D Barbier, H Saleh, AJ
Kenyon, WH Loh, Silicon nanocluster-sensitized emission from erbium: The
0 300 600 900 1200
1
2
3
4
5
6
7
8
9
10
PL Intensity @ 1.5 µm (a.u.)
Thickness (nm)
0 300 600 900 1200 1500
0.25
0.50
0.75
1.00
Optical
effects
(~35%)
b)
Collected emission (a.u.)
Thickness (nm)
Stress-related
effects (~65%)
a)
8 10121416
1.5
3.0
4.5
6.0
7.5
9.0
PL Intensity (a.u.)
% Si-excess (at.%)
~50 nm films
Figure 5 The calculated intensity I
cal
is compared to I
PL
and evolutions of I
PL
.(a) Evolution of the experimental Er PL Intensity at 1.54 μm,
IPL (circles), and calculated I
cal
(squares) due to LDOS and interference effects (see text), as a function of film thickness. For the sake of
comparison, both intensities are normalized to the highest values at 1,400 nm. (b) Variation of I
PL
for 7.5 at.% of Si excess (circles) and for 50-nm-
thick films with a varying Si excess (gray-scale squares). Inset: I
PL
in function of Si excess for thin samples of about 50 nm.
Cueff et al. Nanoscale Research Letters 2011, 6:395
/>Page 5 of 6
role of stress in the formation of silicon nanoclusters. J Appl Phys. 104,
123108 (2008). doi:10.1063/1.3050324
8. M Zacharias, P Streitenberger, Crystallization of amorphous superlattices in
the limit of ultrathin films with oxide interfaces. Phys Rev B. 62, 8391 (2000).
doi:10.1103/PhysRevB.62.8391
9. R Ferre, B Garrido, P Pellegrino, M Peràlvarez, C Garcia, JA Moreno, J
Carreras, JR Morante, Optical-geometrical effects on the photoluminescence
spectra of Si nanocrystals embedded in SiO
2
. J Appl Phys. 98, 084319
(2005). doi:10.1063/1.2115100
10. J Kalkman, H Gersen, L Kuipers, A Polman, Excitation of surface plasmons at
a SiO
2
/Ag interface by silicon quantum dots: Experiment and theory. Phys
Rev B. 73, 075317 (2006)
11. P Horak, WH Loh, AJ Kenyon, Modification of the Er
3+
radiative lifetime
from proximity to silicon nanoclusters in silicon-rich silicon oxide. Opt Exp.
17, 1906 (2009)
12. S Cueff, C Labbé, J Cardin, JL Doualan, L Khomenkova, K Hijazi, O Jambois,
B Garrido, R Rizk, Efficient energy transfer from Si-nanoclusters to Er ions in
silica induced by substrate heating during deposition. J Appl Phys. 108,
064302 (2010). doi:10.1063/1.3481375
13. PG Pai, SS Chao, Y Takagi, G Lucovsky, Infrared spectroscopic study of SiO
x
films produced by plasma enhanced chemical vapor deposition. J Vac Sci
Technol. A4, 689 (1986)
14. O Savchyn, FR Ruhge, PG Kik, RM Todi, KR Coffey, H Nukala, H Heinrich,
Luminescence-center-mediated excitation as the dominant Er sensitization
mechanism in Er-doped silicon-rich SiO2 films. Phys Rev B. 76, 195419
(2007)
15. K Hijazi, R Rizk, J Cardin, L Khomenkova, F Gourbilleau, Towards an
optimum coupling between Er ions and Si-based sensitizers for integrated
active photonics. J Appl Phys. 106, 024311 (2009). doi:10.1063/1.3177243
16. GG Stoney, The tension of metallic films deposited by electrolysis. Proc R
Soc London Ser A. 82, 172 (1909). doi:10.1098/rspa.1909.0021
17. A La Magna, G Nicotra, C Bongiorno, C Spinella, MG Grimaldi, E Rimini, L
Caristia, S Coffa, Role of the internal strain on the incomplete Si/SiO
2
phase
separation in substoichiometric silicon oxide films. Appl Phys Lett. 90,
183101 (2007). doi:10.1063/1.2734398
18. HZ Massoud, HM Przewlocki, Effects of stress annealing in nitrogen on the
index of refraction of silicon dioxide layers in metal-oxide-semiconductor
devices. J Appl Phys. 92, 2202 (2002). doi:10.1063/1.1489500
19. S Cueff, C Labbé, B Dierre, J Cardin, L Khomenkova, F Fabbri, T Sekiguchi, R
Rizk, Cathodoluminescence and photoluminescence comparative study of
Er-doped Si-rich silicon oxide. J Nanophoton. 5, 051504 (2011). doi:10.1117/
1.3549701
20. S Cueff, Labbé, R Rizk, Impact of the annealing temperature on the optical
performances of Er-doped Si-rich Silica systems. IOP Conf Ser: Mater Sci
Eng. 6, 012021 (2009)
21. S Cueff, C Labbé, B Dierre, F Fabbri, T Sekiguchi, X Portier, R Rizk,
Investigation of emitting centers in SiO
2
co-doped with silicon nanoclusters
and Er
3+
ions by cathodoluminescence technique. J Appl Phys. 108, 113504
(2010). doi:10.1063/1.3517091
22. G Franzò, E Pecora, F Priolo, F Iacona, Role of the Si excess on the
excitation of Er doped SiO
x
. Appl Phys Lett. 90, 183102 (2007). doi:10.1063/
1.2734505
doi:10.1186/1556-276X-6-395
Cite this article as: Cueff et al .: Thickness-dependent optimization of Er
3
+
light emission from silicon-rich silicon oxide thin films. Nanoscale
Research Letters 2011 6:395.
Submit your manuscript to a
journal and benefi t from:
7 Convenient online submission
7 Rigorous peer review
7 Immediate publication on acceptance
7 Open access: articles freely available online
7 High visibility within the fi eld
7 Retaining the copyright to your article
Submit your next manuscript at 7 springeropen.com
Cueff et al. Nanoscale Research Letters 2011, 6:395
/>Page 6 of 6