Demonstration problem barfield raiborn kinney cost accounting_4 doc
Bạn đang xem bản rút gọn của tài liệu. Xem và tải ngay bản đầy đủ của tài liệu tại đây (571.68 KB, 50 trang )
ASSEMBLY DEPARTMENT: UNITS
Beginning work in process (100% complete for material; 40% complete for labor;
30% complete for overhead) 250
Units started 8,800
Ending work in process (100% complete for material; 70% complete for labor;
90% complete for overhead) 400
ASSEMBLY DEPARTMENT: COSTS
Material Direct Labor Overhead Total
Beginning inventory $ 3,755 $ 690 $ 250 $ 4,695
Current 100,320 63,606 27,681 191,607
Totals $104,075 $64,296 $27,931 $196,302
FINISHING DEPARTMENT: UNITS
Beginning work in process (100% complete for
transferred-in; 15% complete for material;
40% complete for conversion) 100
Units transferred in 8,650
Ending work in process (100% complete for
transferred-in; 30% complete for material;
65% complete for conversion) 200
FINISHING DEPARTMENT: COSTS
Transferred-In Direct Material Conversion Total
Beginning inventory $ 2,176 $ 30 $ 95 $ 2,301
Current 188,570 15,471 21,600 225,641
Totals $190,746 $15,501 $21,695 $227,942
Required:
a. Prepare a cost of production report for the Assembly Department.
b. Prepare a cost of production report for the Finishing Department.
Solution to Demonstration Problem
a.
EQUIVALENT UNITS OF PRODUCTION
Whole Direct Direct
Units Material Labor Overhead
Beginning inventory 250 250 100 75
Units started 8,800
Units to account for 9,050
BWIP completed 250 0 150 175
Started and completed 8,400 8,400 8,400 8,400
Units completed 8,650
Ending inventory 400 400 280 360
Units accounted for 9,050
Weighted average EUP 9,050 8,930 9,010
Part 2 Systems and Methods of Product Costing
244
COST DATA
Whole Direct Direct
Units Material Labor Overhead
Total
BWIP costs $ 4,695 $ 3,755 $ 690 $ 250
Current period costs 191,607 100,320 63,606 27,681
Total costs $196,302 $104,075 $ 64,296 $27,931
Divided by EUP 9,050 8,930 9,010
Cost per EUP $21.80 $11.50 $7.20 $3.10
COST ASSIGNMENT
Transferred out (8,650 ϫ $21.80) $188,570
Ending inventory
Direct material (400 ϫ $11.50) $4,600
Direct labor (280 ϫ $7.20) 2,016
Overhead (360 ϫ $3.10) 1,116 7,732
Total cost accounted for $196,302
b.
EQUIVALENT UNITS OF PRODUCTION
Whole Direct
Units Transferred-In Material Conversion
Beginning inventory 100
Units started 8,650
Units to account for 8,750
BWIP completed 100 0 85 60
Started and completed 8,450 8,450 8,450 8,450
Units completed 8,550
Ending inventory 200 200 60 130
Units accounted for 8,750
FIFO EUP 8,650 8,595 8,640
COST DATA
Total
BWIP costs $ 2,301
Current period costs 225,641 $188,570 $15,471 $21,600
Total costs $227,942
Divided by EUP 8,650 8,595 8,640
Cost per EUP $26.10 $21.80 $1.80 $2.50
COST ASSIGNMENT
Transferred out
Beginning inventory cost $2,301
Cost to complete:
Transferred-in (0 ϫ $21.80) 0
Direct material (85 ϫ $1.80) 153
Conversion (60 ϫ $2.50) 150 $ 2,604
Started and completed
(8,450 ϫ $26.10) 220,545
Ending inventory
Transferred-in (200 ϫ $21.80) $4,360
Direct material (60 ϫ $1.80) 108
Conversion (130 ϫ $2.50) 325 4,793
Total cost accounted for $227,942
Chapter 6 Process Costing
245
Part 2 Systems and Methods of Product Costing
246
1. What are the typical characteristics of a company that should employ a process
costing system?
2. Why is the process of assigning costs to products essentially an averaging process?
3. How are job order and process costing similar? How do they differ?
4. Why are equivalent units of production used as an output measure in process
costing? In your answer, be sure to address the problems created by partially
completed inventories.
5. What creates the difference between weighted average and FIFO equivalent
units of production? Which EUP calculation more accurately portrays the ac-
tual flow of units through a manufacturing process and why?
6. Why is it necessary to calculate separate equivalent units of production for
each cost component of a product? Are there times when separate EUP sched-
ules are not necessary and, if so, why?
7. How are units “started and completed” in the current period calculated? Is this
figure used in both weighted average and FIFO cost assignment? Why or why
not?
8. In which of the six basic steps used in process costing are physical units used
and in which are equivalent units of production used? Are there steps in which
neither physical nor equivalent units are used? Why or why not?
9. How is the unit cost for each cost component assigned to the units produced
during the current period under (a) the weighted average method and (b) the
FIFO method?
10. What is the purpose of the cost of production report? How would such a re-
port assist accountants in making journal entries for a period?
11. Would it be correct to subtract the cost computed for EWIP from the total costs
to account for as a shortcut to determine the cost of goods transferred out? If
you answered yes, is there a risk in doing this?
12. Why does the “Transferred Out” section of the FIFO method cost of produc-
tion report include multiple computations, whereas the same section for the
weighted average report only includes one computation?
13. How does process costing in a multidepartmental manufacturing environment
differ from that of a single-department manufacturing environment? Why does
this difference exist?
14. Why are the EUP calculations made for standard process costing the same as
the EUP calculations for FIFO process costing?
15. How are inventories accounted for under a standard process costing system?
What information is provided to management when inventories are accounted
for in this manner?
16. What is a hybrid costing system? Under what circumstances is the use of such
a system appropriate?
17. Find five companies, in different industries, on the Internet that you believe
use process costing. Name these companies, provide their Web addresses, in-
dicate what products they make, and discuss why you believe they use process
costing.
QUESTIONS
18. (EUP; weighted average) Newton Quiches uses a weighted average process
costing system. All material is added at the start of the production process. Di-
rect labor and overhead are added at the same rate throughout the process.
Newton’s records indicate the following production for October 2000:
EXERCISES
Beginning inventory (70% complete as to conversion) 120,000 units
Started during October 170,000 units
Completed during October 260,000 units
Ending inventory for October is 20 percent complete as to conversion.
a. What are the equivalent units of production for direct material?
b. What are the equivalent units of production for labor and overhead?
19. (EUP; FIFO) Assume that Newton Quiches in Exercise 18 uses the FIFO method
of process costing.
a. What are the equivalent units of production for direct material?
b. What are the equivalent units of production for labor and overhead?
20. (EUP; weighted average & FIFO) McArthur Corporation makes toy metal soldiers
in a one-department production process. All metal is added at the beginning
of the process. Paint for the figures and the plastic bags for packaging are
considered indirect materials. The following information is available relative to
September 2000 production activities:
Beginning inventory: 75,000 figures (60% complete as to labor; 85% complete as to overhead)
Started into production: metal for 250,000 figures, which were cast during the month
Ending inventory: 30,000 figures (70% complete as to labor; 90% complete as to overhead)
a. Compute the EUP for direct material, direct labor, and overhead using
weighted average process costing.
b. Compute the EUP for direct material, direct labor, and overhead using FIFO
process costing.
c. Reconcile the calculations in parts (a) and (b).
21. (Cost per EUP; weighted average) Flickering Figurines manufactures wax fig-
urines. In October 2000, company production is 26,800 equivalent units for
direct material, 24,400 equivalent units for labor, and 21,000 equivalent units
for overhead. During October, direct material and conversion costs incurred
are as follows:
Direct material $ 78,880
Direct labor 122,400
Overhead 42,600
Beginning inventory costs for October were $14,920 for direct material, $36,200
for labor, and $9,900 for overhead. What is the weighted average cost per
equivalent unit for the cost components for October?
22. (Cost per EUP; FIFO) Assume that Flickering Figurines in Exercise 21 had 3,600
EUP for direct material in October’s beginning inventory, 4,000 EUP for direct
labor, and 3,960 EUP for overhead. What was the FIFO cost per equivalent
unit for direct material, labor, and overhead for October?
23. (Cost per EUP; weighted average & FIFO) Garden Edges manufactures concrete
garden border sections. May 2001 production and cost information are as follows:
WA EUP: Direct material 40,000 sections
Direct labor 38,000 sections
Overhead 37,500 sections
FIFO EUP: Direct material 30,000 sections
Direct labor 31,000 sections
Overhead 33,000 sections
BI costs: Direct material $ 5,300
Direct labor 1,580
Overhead 3,630
Current period costs: Direct material $13,500
Direct labor 8,680
Overhead 21,120
Chapter 6 Process Costing
247
All material is added at the beginning of processing.
a. What is the total cost to account for?
b. Using weighted average process costing, what is the cost per equivalent
unit for each cost component?
c. Using FIFO process costing, what is the cost per equivalent unit for each
cost component?
d. How many units were in beginning inventory and at what percentage of
completion was each cost component?
24. (EUP; cost per EUP; weighted average) TakeThat manufactures canisters of mace.
On August 1, 2001, the company had 4,800 units in beginning Work in Process
Inventory that were 100 percent complete as to canisters, 60 percent complete
as to other materials, 10 percent complete as to direct labor, and 20 percent
complete as to overhead. During August, TakeThat started 22,500 units into
the manufacturing process. Ending Work in Process Inventory included 3,600
units that were 100 percent complete as to canisters, 30 percent complete as to
other materials, 25 percent complete as to direct labor, and 30 percent complete
as to overhead.
Cost information for the month follows:
Beginning inventory: Canisters $ 8,175
Other direct materials 3,393
Direct labor 1,212
Overhead 1,038
August costs: Canisters $39,600
Other direct materials 20,148
Direct labor 61,812
Overhead 43,734
Prepare a schedule showing TakeThat’s August 2001 computation of weighted
average equivalent units of production and cost per equivalent unit.
25. (EUP; cost per EUP; FIFO) ReallyRoll makes skateboards and uses a FIFO process
costing system. The company began April 2001 with 1,000 boards in process
that were 70 percent complete as to material and 85 percent complete as to
conversion. During the month, 3,800 additional boards were started. On April
30, 800 boards were still in process (60 percent complete as to material and
70 percent complete as to conversion). Cost information for April 2001 is as
follows:
Beginning inventory costs: Direct material $13,181
Conversion 6,732
Current period costs: Direct material $71,064
Conversion 29,309
a. Calculate EUP for each cost component using the FIFO method.
b. Calculate cost per EUP for each cost component.
26. (Cost assignment; weighted average) Thomson Co. uses weighted average process
costing. The company’s cost accountant has determined the following produc-
tion and cost per EUP information for January 2001:
Units transferred out during month 256,000
Units in ending inventory (100% complete as to direct material;
80% complete as to direct labor; 95% complete as to overhead) 37,000
Direct material cost per EUP $3.75
Direct labor cost per EUP $4.96
Overhead cost per EUP $5.10
a. What is the cost of the goods transferred during January?
b. What is the cost of the goods in ending inventory at January 31, 2001?
c. What is the total cost to account for during January?
Part 2 Systems and Methods of Product Costing
248
27. (Cost assignment; FIFO) In November 2000, Walker Corporation computed its
costs per equivalent unit under FIFO process costing as follows:
Raw material $12.75
Packaging 1.50
Direct labor 6.42
Overhead 3.87
The raw material is added at the start of processing. Packaging is added at the
end of the production process immediately before the units are transferred to
the finished goods warehouse.
Beginning inventory cost was $513,405 and consisted of:
• $344,520 raw material cost for 27,000 EUP,
• $95,931 direct labor cost for 14,850 EUP, and
• $72,954 overhead cost for 18,900 EUP.
Walker transferred a total of 185,000 units to finished goods during November,
which left 16,000 units in ending inventory. The EI units were 20 percent com-
plete as to direct labor and 35 percent complete as to overhead.
a. What percentage complete were the beginning inventory units as to raw
material? Packaging? Direct labor? Overhead?
b. What was the total cost of the completed beginning inventory units?
c. What was the cost of the units started and completed in November?
d. What was the cost of November’s ending inventory?
28. (EUP; cost per EUP; cost assignment; FIFO & weighted average) Berne Company
mass produces miniature speakers for portable CD players. The following T-
account presents the firm’s cost information for February 2001:
Work in Process Inventory
2/1 Direct material cost in BI $ 1,027
2/1 Conversion cost in BI 588
Feb. DM received 11,682
Feb. DL incurred 2,513
Feb. OH applied to production 1,257
The company had 400 units in process on February 1. These units were 40
percent complete as to material and 30 percent complete as to conversion.
During February, the firm started 1,500 units and ended the month with 150
units still in process. The units in ending WIP Inventory were 20 percent com-
plete as to material and 70 percent complete as to conversion.
a. Compute the unit costs for February under the FIFO method for direct
material and for conversion.
b. Compute the unit costs for February under the weighted average method
for direct material and for conversion.
c. Determine the total costs transferred to Finished Goods Inventory during
February using the FIFO method.
29. (EUP; weighted average & FIFO; two departments) Jones Metals has two pro-
cessing departments, Fabrication and Assembly. Metal is placed into produc-
tion in the Fabrication Department, where it is cut, formed, or ground into var-
ious components. These components are transferred to Assembly, where they
are welded, polished, and hot-dip galvanized with sealant. The production data
follow for these two departments for March 2001:
Chapter 6 Process Costing
249
Fabrication
Beginning WIP inventory (100% complete as to material;
45% complete as to conversion) 5,000
Units started during month 39,000
Ending WIP inventory (100% complete as to material;
80% complete as to conversion) 6,800
Assembly
Beginning WIP inventory (0% complete as to sealant;
15% complete as to conversion) 1,500
Units started during month ?
Ending WIP inventory (100% complete as to sealant;
75% complete as to conversion) 4,600
a. Determine the equivalent units of production for each cost component for
each department under the weighted average method.
b. Determine the equivalent units of production for each cost component for
each department under the FIFO method.
30. (Standard process costing; variances) DiskCity Products manufactures 3.5-inch
preformatted computer disks and uses a standard process costing system. All
material is added at the start of production, and labor and overhead are incurred
equally throughout the process. The standard cost of one disk is as follows:
Direct material $0.13
Direct labor 0.02
Overhead 0.11
Total cost $0.26
The following production and cost data are applicable to April 2001:
Beginning inventory (45% complete) 17,000 units
Started in April 130,000 units
Ending inventory (65% complete) 14,400 units
Current cost of direct material $18,400
Current cost of direct labor 2,598
Current cost of overhead 15,000
a. What cost is carried as the April beginning balance of Work in Process
Inventory?
b. What cost is carried as the April ending balance of Work in Process
Inventory?
c. What cost is transferred to Finished Goods Inventory for April?
d. Using the FIFO method, what are the total direct material, direct labor, and
overhead variances for April?
31. (Standard process costing) Tico Company uses a standard FIFO process cost-
ing system to account for its tortilla manufacturing process. The tortillas are
packaged and sold by the dozen. The company has set the following standards
for production of each one-dozen package:
Direct material—ingredients $0.35
Direct material—package 0.05
Direct labor 0.07
Overhead 0.13
Total cost $0.60
On June 1, the company had 7,200 individual tortillas in process; these were
100 percent complete as to ingredients, 0 percent complete as to the packag-
ing, and 30 percent complete as to labor and overhead. One hundred forty-
four thousand tortillas were started during June and 147,960 were finished. The
Part 2 Systems and Methods of Product Costing
250
ending inventory was 100 percent complete as to ingredients, 0 percent com-
plete as to the packaging, and 60 percent complete as to labor and overhead.
a. What were the equivalent units of production for June?
b. What was the cost of the packages transferred to Finished Goods Inventory
during June?
c. What was the cost of the ending Work in Process Inventory for June?
32. (Hybrid costing) Carolina Coats makes casual coats (one size fits most). Each
coat goes through the same conversion process, but three types of fabric
(Dacron, denim, or cotton) are available. The company uses a standard cost-
ing system, and standard costs for each type of coat follow:
Dacron Denim Cotton
Material (5 yards) $10 $ 5 $12
Direct labor (2 hours) 12 12 12
Overhead (based on 1.5 machine hours) 9 9 9
Total $31 $26 $33
Material is added at the start of production. In March 2001, there was no begin-
ning Work in Process Inventory and 1,500 coats were started into production.
Of these, 200 were Dacron, 600 were denim, and 700 were cotton. At the end
of March, 300 jackets (50 Dacron, 100 denim, and 150 cotton) were not yet
completed. The stage of completion for each cost component for the 300 un-
finished jackets is as follows:
Material 100% complete
Direct labor 25% complete
Overhead 35% complete
a. Determine the total cost of the coats completed and transferred to Finished
Goods Inventory.
b. Determine the total cost of the coats in ending Work in Process Inventory.
Chapter 6 Process Costing
251
33. (EUP; weighted average & FIFO) Patio Company produces outdoor brooms. On
April 30, 2001, the firm had 3,600 units in process that were 70 percent com-
plete as to material, 40 percent complete as to direct labor, and 30 percent
complete as to overhead. During May, 186,000 brooms were started. Records
indicate that 184,200 units were transferred to Finished Goods Inventory in
May. Ending units in process were 40 percent complete as to material, 25 per-
cent complete as to direct labor, and 10 percent complete as to overhead.
a. Calculate the physical units to account for in May.
b. How many units were started and completed during May?
c. Determine May’s EUP for each category using the weighted average
method.
d. Determine May’s EUP for each category using the FIFO method.
e. Reconcile your answers to parts (c) and (d).
34. (EUP; weighted average & FIFO) The Midwest Coal Company mines and
processes coal that is sold to four power plants in central Pennsylvania. The
company employs a process costing system to assign production costs to the
coal it processes. For the third week in March 2001, the firm had a beginning
Work in Process Inventory of 50,000 tons of ore that were 100 percent com-
plete as to material and 30 percent complete as to conversion. During the
week, an additional 200,000 tons of ore were started in process. At the end of
PROBLEMS
the week, 35,000 tons remained in Work in Process Inventory and were 70
percent complete as to material and 60 percent complete as to conversion.
For the third week in March:
a. Compute the total units to account for.
b. Determine how many units were started and completed.
c. Determine the equivalent units of production using the weighted average
method.
d. Determine the equivalent units of production using the FIFO method.
35. (Weighted average) Frankfurt Products manufactures an electronic language trans-
lator. The device can translate seven languages in either direction. Analysis of
beginning Work in Process Inventory for February 2001 revealed the following:
800 Units Percent Complete Cost Incurred
Material 45 $ 8,700
Direct labor 65 3,800
Overhead 40 6,600
Total beginning WIP $19,100
During February, Frankfurt Products started production of another 3,800 trans-
lators and incurred $85,380 for material, $23,560 for direct labor, and $65,720
for overhead. On February 28, the company had 400 units in process (70 per-
cent complete as to material, 90 percent complete as to direct labor, and 80
percent complete as to overhead).
a. Prepare a cost of production report for February using the weighted aver-
age method.
b. Journalize the February transactions.
c. Prepare T-accounts to represent the flow of costs for Frankfurt Products
for February. Use “XXX” where amounts are unknown and identify what
each unknown amount represents.
36. (Weighted average) Alt Enterprises manufactures belt buckles in a single-step
production process. To determine the proper valuations for inventory balances
and Cost of Goods Sold, you have obtained the following information for
August 2001:
Whole Cost of Cost of
Units Material Labor
Beginning work in process 400,000 $ 400,000 $ 630,000
Units started during period 2,000,000 2,600,000 3,990,000
Units transferred to finished goods 1,800,000
Beginning inventory units were 100 percent complete as to material, but only
80 percent complete as to labor and overhead. The ending inventory units were
100 percent complete as to material and 50 percent complete as to conversion.
Overhead is applied to production at the rate of 60 percent of direct labor cost.
a. Prepare a schedule to compute equivalent units of production by cost com-
ponent assuming the weighted average method.
b. Determine the unit production costs for material and conversion.
c. Calculate the costs assigned to completed units and ending inventory for
August 2000.
37. (Weighted average) You have just been hired as the cost accountant for Sun
Valley Micro, a producer of personal computer cases. This position has been
vacant for one month. John Amos, manager of the firm’s tax department, has
performed some computations for last month’s information; however, he con-
fesses to you that he doesn’t remember a great deal about cost accounting.
In the production process, materials are added at the beginning of pro-
duction and overhead is applied to each product at the rate of 70 percent of
Part 2 Systems and Methods of Product Costing
252
direct labor cost. There was no Finished Goods Inventory at the beginning of
July. A review of the firm’s inventory cost records provides you with the follow-
ing information:
Units DM Cost DL Cost
Work in Process 7/1/00
(70% complete as to labor and overhead) 100,000 $ 750,000 $ 215,000
Units started in production 1,300,000
Costs for July 4,850,000 3,265,000
Work in Process 7/31/00
(40% complete as to labor and overhead) 400,000
At the end of July, the cost of Finished Goods Inventory was determined to
be $124,033.
a. Prepare schedules for July 2000, to compute the following:
1. Equivalent units of production using the weighted average method.
2. Unit production costs for material, labor, and overhead.
3. Cost of Goods Sold.
b. Prepare the journal entries to record the July transfer of completed goods
and the July cost of goods sold. (CPA adapted)
38. (FIFO cost per EUP) The following information has been gathered from the
records of Jack’s Snacks for August 2001. The firm makes a variety of snacks;
the information presented here is for a cashew and dried mango mix. Materi-
als are added at the beginning of processing; overhead is applied on a direct
labor basis. The mix is transferred to a second department for packaging. Jack’s
uses a FIFO process costing system.
Beginning WIP inventory (40% complete as to conversion) 5,000 pounds
Mix started in August 90,400 pounds
Ending WIP inventory (70% complete as to conversion) 4,000 pounds
Materials cost incurred in August $415,840
Conversion costs incurred in August $106,030
Beginning inventory cost totaled $13,875. For August 2001, compute the follow-
ing:
a. Equivalent units of production by cost component.
b. Cost per equivalent unit by cost component.
c. Cost of mix transferred to the packaging department in August.
d. Cost of August’s ending inventory.
39. (Cost assignment; FIFO) Green Seasons Processors is a contract manufacturer
for the Delectable Dressing Company. Green Seasons uses a FIFO process cost-
ing system to account for the production of its salad dressing. All ingredients
are added at the start of the process. Delectable provides reusable vats to Green
Seasons for the completed product to be shipped to Delectable for bottling so
Green Seasons incurs no packaging costs. April 2001 production and cost in-
formation for Green Seasons Processors is as follows:
Gallons of dressing in beginning inventory 37,000
Gallons transferred out during April 243,000
Gallons of dressing in ending inventory 23,500
Costs of beginning inventory:
Direct material $ 181,300
Direct labor 45,695
Overhead 50,320
Costs incurred in April:
Direct material $1,131,435
Direct labor 452,976
Overhead 770,133
Chapter 6 Process Costing
253
The beginning and ending inventories had the following degrees of comple-
tion each for labor and overhead:
Beginning Inventory Ending Inventory
Direct labor 35% 25%
Overhead 60% 30%
a. How many gallons of dressing ingredients were started in April?
b. What is the total cost of the completed beginning inventory?
c. What is the total cost of goods completed during April?
d. What is the average cost per gallon of all goods completed during April?
e. What is the cost of April’s ending WIP inventory?
40. (Weighted average & FIFO) In a single-process production system, the Cleopatra
Corporation produces press-on fingernails. For October 2000, the company’s
accounting records reflected the following:
Beginning Work in Process Inventory
(100% complete as to material; 30% complete as to direct labor;
60% complete as to overhead) 6,000 units
Units started during the month 45,000 units
Ending Work in Process Inventory
(100% complete as to material; 40% complete as to direct labor;
70% complete as to overhead) 10,000 units
Cost Component Beginning Inventory October
Material $4,980 $45,000
Direct labor 450 21,600
Overhead 3,180 33,300
a. For October, prepare a cost of production report assuming the company
uses the weighted average method.
b. For October, prepare a cost of production report assuming the company
uses the FIFO method.
41. (FIFO; second department) Bixby Company makes porcelain kitchen sinks in
a process requiring operations in three separate departments: Molding, Curing,
and Finishing. Materials are first introduced in the molding operation and
additional material is added during the curing process. The following infor-
mation is available for the Curing Department for May 2001:
Beginning WIP Inventory (degree of completion: transferred-in, 100%;
direct material, 80%; direct labor, 40%; overhead, 30%) 8,000 units
Transferred-in from Molding 40,000 units
Ending WIP Inventory (degree of completion: transferred-in, 100%;
direct material, 70%; direct labor, 50%; overhead, 40%) 4,000 units
Transferred to Finishing ? units
Cost Component Beginning Inventory Current Period
Transferred-in $66,000 $320,000
Direct material 24,960 161,600
Direct labor 6,720 85,600
Overhead 3,580 43,200
Prepare, in good form, a cost of production report for the Curing Department
for May 2001. (CPA adapted)
42. (Two departments; weighted average) The Best of the Season Corporation makes
plastic Christmas trees in two departments: Cutting and Boxing. In the Cutting
Department, wire wrapped with green “needles” is placed into production at
Part 2 Systems and Methods of Product Costing
254
the beginning of the process and is cut to various lengths depending on the
size of the trees being made at that time. The “branches” are then transferred
to the Boxing Department where the lengths are separated into the necessary
groups to make a tree. These are then placed in boxes and immediately sent
to Finished Goods.
The following data are available related to the October 2000 production
in each of the two departments:
PERCENT OF COMPLETION
Units Transferred-in Material Conversion
Cutting Department
Beginning inventory 9,000 N/A 100 30
Started in process 35,000
Ending inventory 3,600 N/A 100 70
Boxing Department
Beginning inventory 2,500 100 0 55
Transferred-in ?
Ending inventory 1,200 100 0 60
COSTS Transferred-in Material Conversion
Cutting Department
Beginning inventory N/A $13,250 $ 5,550
Current period $52,750 80,290
Boxing Department
Beginning inventory $ 9,608 $ 0 $ 550
Current period ? 12,510 20,660
a. Prepare a cost of production report for the Cutting Department assuming
a weighted average method.
b. Using the data developed from part (a), prepare a cost of production re-
port for the Boxing Department, also using the weighted average method.
43. (Cost flows: multiple departments) Sharp Corporation produces accent stripes
for automobiles in 50-inch rolls. Each roll passes through three departments
(Striping, Adhesion, and Packaging) before it is ready for shipment to auto-
mobile dealers and detailing shops. Product costs are tracked by department
and assigned using a process costing system. Overhead is applied to production
in each department at a rate of 60 percent of the department’s direct labor cost.
The following information pertains to departmental operations for June 2001:
Chapter 6 Process Costing
255
Work in Process—Striping
Beginning $20,000
DM 90,000
DL 80,000
Overhead ?
Ending $17,000
Work in Process—Packaging
Beginning $150,000
Transferred-in ?
DM ?
DL ?
Overhead 90,000
Ending $ 90,000
Work in Process—Adhesion
Beginning $70,000
Transferred-in ?
DM 60,000 $480,000
DL ?
Overhead ?
Ending $20,000
Finished Goods
Beginning $185,000
CGM 830,000 $720,000
Ending ?
a. What was the cost of goods transferred from the Striping Department to
the Adhesion Department for the month?
b. How much direct labor cost was incurred in the Adhesion Department? How
much overhead was assigned to production in the Adhesion Department for
the month?
c. How much direct material cost was charged to products passing through
the Packaging Department?
d. Prepare the journal entries for all interdepartmental transfers of products
and the cost of the units sold during June 2001.
44. (Comprehensive; two departments) Safe-N-Sound makes a backyard fencing
system for pet owners in a two-stage production system. In Process 1, wood
is cut and assembled into six-foot fence sections. In Process 2, the sections are
pressure treated to resist the effects of weather and then coated with a wood
preservative. The following production and cost data are available for March
2001 (units are six-foot fence sections):
Units Cutting Process Pressure Process
Beginning WIP Inventory (March 1) 1,300 900
Complete as to material 80% 0%
Complete as to conversion 75% 60%
Units started in March 4,800 ?
Units completed in March ? 4,500
Ending WIP Inventory (March 31) 1,100 ?
Complete as to material 40% 0%
Complete as to conversion 20% 40%
Costs
Beginning WIP Inventory
Transferred-in $ 4,725
Material $ 2,130 0
Conversion 3,175 1,674
Current
Transferred-in $ ?
Material $ 8,800 4,995
Conversion 12,735 13,560
a. Prepare EUP schedules for both the cutting and pressure processes. Use
the FIFO method.
b. Determine the cost per equivalent unit for the cutting process assuming a
FIFO method.
c. Assign costs to goods transferred and to inventory in the cutting process
on a FIFO basis.
d. Transfer the FIFO costs to the pressure process. Determine cost per EUP
on a modified FIFO basis. (See footnote 8, page 233.)
e. Assign costs to goods transferred and to inventory in the pressure process
on a modified FIFO basis.
f. Assuming there was no beginning or ending inventory of Finished Goods
Inventory for March, what was Cost of Goods Sold for March?
45. (Standard process costing) HealthySight is a manufacturer of high-quality lenses
for sunglasses and ski goggles. HealthySight uses a standard process costing
system and carries inventories at standard. In May 2001, the following data
were available:
Standard Cost
of 1 Unit
Direct material $ 4.50
Conversion 12.50
Total manufacturing cost $17.00
Part 2 Systems and Methods of Product Costing
256
Beginning WIP Inventory 10,000 units (100% DM; 70% conversion)
Started in May 180,000 units
Completed in May 160,000 units
Ending WIP Inventory ? units (100% DM; 60% conversion)
Actual costs for May
Direct material $ 781,000
Conversion 2,045,000
Total actual cost $2,826,000
a. Prepare an equivalent units of production schedule.
b. Prepare a cost of production report and assign costs to goods transferred
and to inventory.
c. Calculate and label the variances and charge them to Cost of Goods Sold.
46. (Multiproduct; hybrid costing) Be-At-Ease Industries manufactures a series of
three models of molded plastic chairs: standard (can be stacked), deluxe (with
arms), and executive (with arms and padding); all are variations of the same
design. The company uses batch manufacturing and has a hybrid costing
system.
Be-At-Ease has an extrusion operation and subsequent operations to form,
trim, and finish the chairs. Plastic sheets are produced by the extrusion oper-
ation, some of which are sold directly to other manufacturers. During the form-
ing operation, the remaining plastic sheets are molded into chair seats and the
legs are added; the standard model is sold after this operation. During the trim
operation, the arms are added to the deluxe and executive models and the
chair edges are smoothed. Only the executive model enters the finish opera-
tion where the padding is added. All of the units produced receive the same
steps within each operation.
The July production run had a total manufacturing cost of $898,000. The
units of production and direct material costs incurred were as follows:
Units Extrusion Form Trim Finish
Produced Materials Materials Materials Materials
Plastic sheets 5,000 $ 60,000
Standard model 6,000 72,000 $24,000
Deluxe model 3,000 36,000 12,000 $ 9,000
Executive model 2,000 24,000 8,000 6,000 $12,000
16,000 $192,000 $44,000 $15,000 $12,000
Manufacturing costs applied during July were as follows:
Extrusion Form Trim Finish
Operation Operation Operation Operation
Direct labor $152,000 $60,000 $30,000 $18,000
Factory overhead 240,000 72,000 39,000 24,000
a. For each product produced by Be-At-Ease during July, determine the
1. Unit cost.
2. Total cost.
Be sure to account for all costs incurred during the month, and support
your answer with appropriate calculations.
b. Without prejudice to your answer in part (a), assume that 1,000 units of
the deluxe model remained in Work in Process Inventory at the end of
the month. These units were 100 percent complete in the trim operation.
Determine the value of the 1,000 units of the deluxe model in Be-At-Ease’s
Work in Process Inventory at the end of July. (CMA adapted)
Chapter 6 Process Costing
257
Part 2 Systems and Methods of Product Costing
258
47. (WA and FIFO) Rainbow Paints makes quality paint sold at premium prices in
one production department. Production begins with the blending of various
chemicals, which are added at the beginning of the process, and ends with
the canning of the paint. Canning occurs when the mixture reaches the 90 per-
cent stage of completion. The gallon cans are then transferred to the Shipping
Department for crating and shipment. Labor and overhead are added contin-
uously throughout the process. Factory overhead is applied at the rate of $3
per direct labor hour.
Prior to May, when a change in the process was implemented, work in
process inventories were insignificant. The change in process enables greater
production but results in large amounts of work in process. The company has
always used the weighted average method to determine equivalent production
and unit costs. Now, production management is considering changing from the
weighted average method to the first-in, first-out method.
The following data relate to actual production during May:
Costs for May
Work in process inventory, May 1
Direct material—chemicals $ 45,600
Direct labor ($10 per hour) 6,250
Factory overhead 1,875
Current month
Direct material—chemicals $228,400
Direct material—cans 7,000
Direct labor ($10 per hour) 35,000
Factory overhead 10,500
Units for May (Gallons)
Work in process inventory, May 1 (25% complete) 4,000
Sent to Shipping Department 20,000
Started in May 21,000
Work in process inventory, May 31 (80% complete) 5,000
a. Prepare a cost of production report for each cost element for May using
the weighted average method.
b. Prepare a cost of production report for each cost element for May using
the FIFO method.
c. Discuss the advantages and disadvantages of using the weighted average
method versus the FIFO method, and explain under what circumstances
each method should be used. (CMA adapted)
CASE
48. The term total cost to account for has been used in this chapter and in another
setting earlier in the text. Find that earlier reference to this term and write a
brief report explaining whether or not the term is being used consistently in
both places.
49. The weighted average and FIFO methods generally result in approximately the
same unit costs because costs do not usually vary dramatically from period to
period. Discuss some reasons for exceptions to this observation.
REALITY CHECK
50. Cost accountants use the concept of equivalent units of production (EUP) to
measure actual production for a period in a process costing environment. Write
a memo describing what EUP measures and why it is necessary to use EUP
to determine actual production for a period.
51. Search the Internet to identify a vendor of process costing software. Read the
on-line literature provided by the vendor regarding the software. Then, briefly
describe the major features of the software in the areas of product costing, cost
budgeting, and cost control.
52. In a team of three or four people, choose a company whose mass production
process you would like to learn. Use the library, the Internet, and (if possible)
personal resources to gather information. Prepare a visual representation (sim-
ilar to Exhibit 6–2) of that production process. In this illustration, indicate the
approximate percentage of completion points at which various materials are
added and where/how labor and overhead flow into and through the process.
Assume that 1,000 units of product are flowing through your production process
and are now at the 60 percent completion point as to labor. Prepare a written
explanation about the quantity of direct material equivalent units that are in-
cluded in the 1,000 units. Also explain how much overhead activity and cost
have occurred and why the overhead percentage is the same as or different
from the percentage of completion for labor.
53. Find a Web site or current professional article discussing developments in the
pharmaceutical/medical devices industry. Read the materials on that site about
evolving practices in the industry to improve cost effectiveness of operations.
Discuss how the industry’s new practices will affect process costing in the phar-
maceutical industry. Which cost pools (direct material, direct labor, manufac-
turing overhead) will be affected by the emerging practices? Also, address
whether any of the evolving practices would be better served by life cycle
costing.
54. Find the Web page for Agile Software. Provide its Web address and discuss
the nature of this Internet-based software and how it can affect cost accounting
practices in industries that manufacture complex products.
Chapter 6 Process Costing
259
7
Special Production Issues:
Lost Units and Accretion
CHAPTER
LEARNING OBJECTIVES
After completing this chapter, you should be able to answer the following questions:
1
What is an accepted quality level and how does it relate to zero tolerance for errors and defects?
2
Why do lost units occur in manufacturing processes?
3
How do normal and abnormal losses of units differ and how is each treated in an EUP schedule?
4
How are the costs of each type of loss assigned?
5
How are rework costs of defective units treated?
6
How are losses treated in a job order costing system?
7
How does accretion of units affect the EUP schedule and costs per unit?
8
What is the cost of quality products?
General
Electric
Company
INTRODUCING
homas Alva Edison invented the first successful
incandescent light bulb in 1879. Shortly thereafter,
General Electric (GE) began providing power and lighting
up America and the world. General Electric Company was
formed in 1892 through a merger of Edison Electric Light
Company and Thomson-Houston Company.
Today, GE is the world’s largest diversified services
company as well as a provider of high-quality, high-
technology industrial and consumer products. While main-
taining world-class leadership in its beginnings in providing
power systems and electric lighting, the company has ex-
panded into many areas. A few examples include aircraft
engines, medical systems, financial services, television
broadcasting, and transportation systems. GE consists of
more than three dozen businesses operating in 100 com-
panies around the globe. Although widely diverse, GE
businesses are also highly familial and share information,
resources, technology, and intellectual capital.
GE’s sharing among all its businesses includes:
1. a common operating system and a social architecture
characterized by boundaryless behavior,
2. a common leadership development system,
3. one set of common values, and
4. four common initiatives—globalization, product services,
e-business, and Six Sigma quality.
Six Sigma is a quality management term used to
define a process for eliminating variation and, therefore,
eliminating defects. Statistically, Six Sigma quality means
improving manufacturing quality to six standard deviations
from the specification limit. This translates to a rate of 3.4
defects out of a million items processed. GE is absolutely
committed to delivering flawless products and services to
its customers.
At GE, the Six Sigma initiative is in its fifth year—its
fifth trip through the operating system. From a standing
start in 1996, with no financial benefit to the company, it
has flourished to the point where it provided more than
$2 billion in benefits in 1999, with much more to come
this decade.
Unlike the General Electric (GE) processes that have been subjected to zero-defect
tolerance, most companies tolerate some level of defects by establishing an accepted
quality level (AQL) for their production or service processes. AQL is the maximum
limit for the number of defects or errors in a process. If the percentage of defects
or errors is less than the AQL, the company considers that it has performed at an
acceptable quality level.
Companies viewed as having world-class status in a particular endeavor seek
to continuously tighten the accepted quality level. Thus, producing goods with zero
defects and performing services with zero errors are laudable goals and ones toward
which domestic and foreign companies are striving.
The examples in Chapter 6 assumed that all units to be accounted for have
either been transferred or are in ending work in process inventory; however, almost
every process produces some units that are spoiled or do not meet production
specifications. Phenomena in the production process also may cause the total units
accounted for to be less than the total units to account for. In other situations
(unrelated to spoiled units), the addition or expansion of materials after the start
of the process may cause the units accounted for to be greater than those to be
accounted for originally or in a previous department.
This chapter covers these more complex issues of process costing. Spoiled and
defective units, reworking of defective units, and accretion require adjustments to
the equivalent units of production (EUP) schedule and cost assignments made at
the end of a period. The last section of this chapter discusses controlling quality
so that only a minimal number of inferior goods are produced.
SOURCES
: General Electric Company Web site, (June 2000); Robert Buderi, “The Six Sigma Approach Revs Up,”
Upside
(May 2000), p. 50.
261
T
What is an accepted quality level
and how does it relate to zero
tolerance for errors and defects?
accepted quality level (AQL)
1
Part 2 Systems and Methods of Product Costing
262
LOSS OF UNITS
Few, if any, processes combine material, labor, and overhead with no loss of units.
Some of these losses, such as evaporation, leakage, or oxidation, are inherent in the
production process. For example, when Starbucks roasts coffee beans, approximately
20 percent of the original weight is lost from water evaporation. This situation results
in shrinkage. Modifying the production process to reduce or eliminate the causes of
shrinkage may be difficult, impossible, or simply not cost beneficial.
Spoilage of some food products occurs simply by exposure to the atmosphere
wherever perishable foods are processed or stored. In this regard, Louisiana State
University and SIRA Technologies have developed a new monitoring system for
meat that can enable meat processors and food retailers to better regulate the safety
requirements for storage and prevent loss of reputation and revenue from selling
meat containing harmful bacteria. The technology uses a bar code treated with an-
tibodies that are sensitive to virulent strains of bacteria.
1
As discussed in the ac-
companying News Note, spoilage of meats and other perishable foods awaiting
customer purchases in supermarkets can be further prevented by covering refrig-
eration cases each night.
At other times, errors in the production process (either by humans or machines)
cause a loss of units through rejection at inspection for failure to meet appropriate
quality standards or designated product specifications. Whether these lost units are
Why do lost units occur in
manufacturing processes?
shrinkage
2
1
Ginger Koloszyc, “New Bar-Code Technology Detects Meat Spoilage,” Stores (October 1998), p. 72.
Closing the Curtain on Contaminants
NEWS NOTE QUALITY
It is estimated that 75% of the supermarkets in North
America are closed to the public for 6 to 8 hours at night.
With little effort, these supermarkets could claim dollars
that are lost during the stores’ closed hours from unnec-
essary energy consumption and premature spoilage of
many perishable products.
Open refrigerated display cases are the best way for
retailers to present fresh merchandise to consumers. Un-
fortunately, these cases are also open to the effects of
heat and UV radiation from the store environment.
There is often a misconception that the refrigerated
air escapes from the display case. However, heat or
warm air is actually drawn toward the colder air, raising
the temperatures in the display case; this causes mer-
chandise to warm up and compressors to operate more
frequently.
More frequent compressor operation and exposed
products must be tolerated so that consumers can shop
freely, but when the store is closed, simple steps can be
taken to reduce store energy consumption and extend
product shelf life with ideal cold temperatures.
To solve this problem, an efficient temperature barrier
is needed between the opening of the display case and
the store interior. The ideal thermal barrier arrangement
must have several qualities to be effective in increasing
store profit:
• Reasonable cost and quick initial payback period;
• Simple and quick to put in operation;
• No interference with customer access to fresh mer-
chandise when the store is open;
• No disturbance to the cosmetic appearance of the
store;
• Durable commercial quality;
• Hygienic (will not rust or attract dust, mold, and
mildew);
• Simple, quick cleaning maintenance that can be
done when cleaning the case; and
• Effective in the reflection of heat and UV radiation.
A vertical rolling curtain permanently attached to the top
of the display was agreed upon as the simplest and eas-
iest to use arrangement. To adapt to this arrangement, a
99% pure aluminum heat-reflective fabric was developed.
To provide strength to the woven aluminum fabric and elim-
inate oxidation, it is coated with a thin, transparent film.
SOURCE
: Staff, “The Big Cover-Up in the Refrigeration Case,”
Air Conditioning,
Heating, and Refrigeration News
(April 3, 2000), pp. 27ff.
atechnologies
.com
considered defective or spoiled depends on their ability to be economically re-
worked. Economically reworked means that (1) the unit can be reprocessed to
a sufficient quality level to be salable through normal distribution channels and
(2) incremental rework cost is less than incremental revenue from the sale of re-
worked units. A defective unit can be economically reworked, but a spoiled unit
cannot. An inspector in the company making the product determines which are
defective and which are spoiled.
To illustrate the difference between defective and spoiled units, assume you
order blackened redfish at a restaurant. You are now the control inspector. If the
redfish brought to you is barely blackened, it is a defective unit because the chef
can cook it longer to bring it up to “product specifications.” The incremental rev-
enue is the selling price of the redfish; the incremental cost is a few moments of
the chef’s time. However, if the fish brought to you is blackened to a cinder, it is
a spoiled unit because it cannot be reworked. Therefore, a newly cooked black-
ened redfish would have to be provided.
A normal loss of units falls within a tolerance level expected during pro-
duction. Management creates a range of tolerance of spoiled units specified by the
accepted quality level, as mentioned in the beginning of this chapter. If a com-
pany had set its quality goal as 98 percent of goods produced, the company would
have been expecting a normal loss of 2 percent. Any loss in excess of the AQL is
an abnormal loss. Thus, the difference between normal and abnormal loss is
merely one of degree and is determined by management.
A variety of methods can be used to account for units lost during production.
Selection of the most appropriate method depends on two factors: (1) the cause
of the decrease and (2) management expectations regarding lost units. Under-
standing why units decreased during production requires detailed knowledge of
the manufacturing process. Management’s expectations are important to determine
the acceptable loss quantities from defects, spoilage, or shrinkage as well as the
revenue and cost considerations of defective and spoiled units.
Chapter 7 Special Production Issues: Lost Units and Accretion
263
economically reworked
defective unit
spoiled unit
How do normal and abnormal
losses of units differ and how is
each treated in an EUP
schedule?
normal loss
abnormal loss
3
TYPES OF LOST UNITS
In developing the product design, manufacturing process, and product quality,
management selects a combination of material, labor, and overhead from the wide
resource spectrum available. This combination is chosen to provide the lowest long-
run cost per unit and to achieve the designated product specifications—including
those for quality. In making this resource combination choice, managers recognize
that, for most combinations, some degree of production error may occur that will
result in lost units. Given the resource choices made by management, the quan-
tity or percentage of lost units to be generated in a given period or production
run should be reasonably estimable. This estimate is the normal loss because it is
planned for and expected. Normal loss is usually calculated on the basis of good
output or actual input.
Some companies may estimate the normal loss to be quite high because the
lowest cost material, labor, or overhead support is chosen. For example, assume
that Scrape Manufacturing Ltd. chooses to install the least advanced, lowest cost
machinery for production purposes because its workers do not have the educa-
tional or technological skills to handle the more advanced equipment. The installed
equipment may have fewer quality checks and, thus, produce more spoiled units
than the more advanced equipment. Scrape’s managers have decided that the costs
of upgrading worker skills were greater than the cost of lost units.
Another reason for high estimated normal losses relates not to the resources
chosen, but to a problem inherent in the product design or in the production
process. In other cases, based on cost-benefit analysis, managers may find that a
problem would cost more to eliminate than to tolerate. For example, assume a
machine malfunctions once every 100 production runs and improperly blends in-
gredients. The machine processes 50,000 runs each year and the ingredients in
each run cost $10. Correcting the problem has been estimated to cost $20,000 per
year. Spoilage cost is $5,000 per year (500 spoiled batches ϫ $10 worth of ingre-
dients) plus a minimal amount of overhead costs. If company employees are aware
of the malfunction and catch every improperly blended run, accepting the spoilage
is less expensive than correcting the problem.
If, alternatively, the spoiled runs are allowed to leave the plant, they may
create substantial quality failure costs in the form of dissatisfied customers and/or
salespeople who might receive the spoiled product. Managers in world-class com-
panies should be aware that the estimate of the cost to develop a new customer
is $50,000, five times as much as the estimated cost of keeping an existing one.
2
In making their cost-benefit analysis, managers must be certain to quantify all the
costs (both direct and indirect) involved in spoilage problems.
An abnormal loss is a loss in excess of the normal, predicted tolerance limits.
Thus, when an abnormal loss occurs, so does a normal loss (unless zero defects
have been set as the AQL). Abnormal losses generally arise because of human or
machine error during the production process. For example, if the tolerances on
one of a company’s production machines were set incorrectly, a significant quan-
tity of defective products might be produced before the error was noticed. Because
abnormal losses result from nonrandom, special adverse conditions and actions,
they are more likely to be preventable than some types of normal losses.
Realistically, units are lost in a production process at a specific point. How-
ever, accounting for lost units requires that the loss be specified as being either
continuous or discrete. For example, the weight loss in roasting coffee beans and
the relatively continual breakage of fragile glass ornaments can be considered
continuous losses because they occur fairly uniformly throughout the production
process.
In contrast, a discrete loss is assumed to occur at a specific point. Examples
of discrete losses include adding the wrong amount of vinegar to a recipe for salad
dressing or attaching a part to a motor upside down. The units are only deemed
lost and unacceptable when a quality check is performed. Therefore, regardless of
where in the process the units were truly “lost,” the loss point is always deemed
to be an inspection point. Thus, units that have passed an inspection point should
be good units (relative to the specific characteristics inspected), whereas units that
have not yet passed an inspection point may be good or may be defective/spoiled.
Control points can be either built into the system or performed by inspectors.
The former requires an investment in prevention costs; the latter results in appraisal
costs. Both are effective, but prevention is often more efficient because acceptable
quality cannot be inspected into a product; it must be a part of the production
process. Investments to prevent lost units may relate either to people or machines.
(Prevention costs and appraisal costs are formally defined in Chapter 8.)
In determining how many quality control inspection points (machine or human)
to install, management must weigh the costs of having more inspections against the
savings resulting from (1) not applying additional material, labor, and overhead to
products that are already spoiled or defective (direct savings) and (2) the reduction
or elimination of internal and external failure costs (indirect savings). Quality control
points should always be placed before any bottlenecks in the production system so
that the bottleneck resource is not used to process already defective/spoiled units.
Additionally, a process that generates a continuous defect/spoilage loss requires a
quality control point at the end of production; otherwise, some defective/spoiled
units would not be found and would be sent to customers, creating external failure
costs. (Failure costs are formally defined in Chapter 8.)
Part 2 Systems and Methods of Product Costing
264
2
Peter L. Grieco, Jr., “World-Class Customers,” Executive Excellence (February 1996), p. 10.
continuous loss
discrete loss
Chapter 7 Special Production Issues: Lost Units and Accretion
265
How are the costs of each type
of loss assigned?
4
ACCOUNTING FOR LOST UNITS
The method of accounting for the cost of lost units depends on whether the loss
is considered normal or abnormal and whether the loss occurred continuously in
the process or at a discrete point. Exhibit 7–1 summarizes the accounting for the
cost of lost units.
The traditional method of accounting for normal losses is simple. Normal loss
cost is considered a product cost and is included as part of the cost of the good
units resulting from the process. Thus, the cost of the loss is inventoried in Work
in Process and Finished Goods Inventories and expensed only when the good units
are sold. This treatment has been considered appropriate because normal losses
have been viewed as unavoidable costs in the production of good units. If the loss
results from shrinkage caused by the production process, such as the weight loss
of roasting coffee beans, this treatment seems logical.
Alternatively, consider the company producing fragile scientific lenses: If the
company allows for losses by virtue of the level at which some acceptable qual-
ity was set, then management will not receive valuable information about the cost
of quality losses. In contrast, if the same company were to institute a zero-defect
policy, there would by definition be no “normal” loss. All losses would be outside
the tolerance specifications for acceptable quality.
The costs of normal shrinkage and normal continuous losses are handled
through the method of neglect, which simply excludes the spoiled units in the
equivalent units schedule. Ignoring the spoilage results in a smaller number of
equivalent units of production (EUP) and, by dividing production costs by a smaller
EUP, raises the cost per equivalent unit. Thus, the cost of lost units is spread pro-
portionately over the good units transferred and those remaining in Work in Process
Inventory.
Alternatively, the cost of normal, discrete losses is assigned only to units that
have passed the inspection point. Such units should be good units (relative to the
inspected characteristic), whereas the units prior to this point may be good or may
be defective/spoiled. Assigning loss costs to units that may be found to be defective/
spoiled in the next period would not be reasonable.
EXHIBIT 7–1
Continuous versus Discrete
Losses
Uniformly throughout
process
or
Absorbed by all units
in ending inventory
and transferred out
on an EUP basis
At inspection point or
at end of process
Absorbed by all units
past inspection point in
ending inventory and
transferred out on an
EUP basis
Type
Continuous
Assumed to Occur May Be Cost Handled How?
Discrete
Normal
Cost Assigned To?
Written off as a loss
on an EUP basis
Abnormal
Product
Period
or
Normal
Abnormal
Product
Period
Written off as a loss
on an EUP basis
method of neglect
Regardless of whether defects/spoilage occur in a continuous or discrete fash-
ion, the cost of abnormal losses should be accumulated and treated as a loss in
the period in which those losses occurred. This treatment is justified by the cost
principle discussed in financial accounting. The cost principle allows only costs
that are necessary to acquire or produce inventory to attach to it. All unnecessary
costs are written off in the period in which they are incurred. Because abnormal
losses are not necessary to the production of good units and the cost is avoidable
in the future, any abnormal loss cost is regarded as a period cost. This cost should
be brought to the attention of the production manager who should then investi-
gate the causes of the loss to determine how to prevent future similar occurrences.
Abnormal loss cost is always accounted for on an equivalent unit basis.
Part 2 Systems and Methods of Product Costing
266
ILLUSTRATIONS OF LOST UNITS
To best understand how to account for a process that creates lost goods, it is help-
ful to know the answers to the following questions:
1. What is the process flow?
2. Where is material added during the process?
3. How are labor and overhead applied? (This answer is usually “Continuously,”
but not necessarily at the same rate.)
4. At what stage of completion was the beginning inventory and what is the end-
ing inventory?
5. Where are the quality control inspection points?
6. How do defective/spoiled units occur? (Continuously or discretely?)
Impervious Inc. is used to illustrate several alternative situations regarding the
handling of lost units in a process costing environment. Impervious produces a high-
tech, very durable, nonfade (once color pigment is added) paint base material—
hereafter simply referred to as paint—for appliances and equipment. The paint is
produced in a single department and then sold to appliance and equipment man-
ufacturers. All materials are added at the start of the process, and conversion costs
are applied uniformly throughout the production process. Recyclable containers are
provided by buyers and, therefore, are not a cost to Impervious. The company
uses the FIFO method of calculating equivalent units.
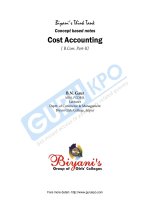
Spoilage in the production of
CD-ROMs can occur from a
wide variety of causes and at
numerous points in the produc-
tion process. Because spoilage
tends to be machine-related,
quality checks are built into the
production system and are often
performed robotically. However,
the final quality control analysis
is performed by a replication
operator.
Situation 1—Normal Loss Only; Loss Occurs Throughout
Production Process (Continuous)
During processing, the paint is mechanically blended and cooked, resulting in a
normal loss from shrinkage. Mechanical malfunctions sometimes occur and, when
they do, cause some spoilage. Any decrease of 10 percent or less of the gallons
placed into production for a period is considered normal. The April 2000 data for
Impervious are given below:
GALLONS
Beginning inventory (60% complete) 2,000
Started during month 15,000
Gallons completed and transferred 13,200
Ending inventory (75% complete) 2,500
Lost gallons (normal) 1,300
COSTS
Beginning inventory:
Material $ 15,000
Conversion 1,620 $ 16,620
Current period:
Material $102,750
Conversion 19,425
122,175
Total costs $138,795
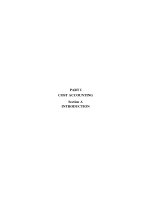
To visualize the manufacturing process for Impervious, a flow diagram can be
constructed. Such a diagram provides distinct, definitive answers to all of the ques-
tions asked at the beginning of this section.
Flow Diagram
→ Conversion cost applied uniformly throughout →
↑
↑↑
↑
60% 75% 100%
Material Beginning Ending Inspection
added inventory inventory point
→ Continuous reduction in units (shrinkage) →
The steps discussed in Chapter 6 on process costing are followed to determine
the units accountable for, units accounted for, equivalent units of production, costs
accountable for, cost per equivalent unit, and cost assignment. These steps are pre-
sented in the cost of production report shown in Exhibit 7–2.
The department is accountable for 17,000 gallons of paint: 2,000 gallons in be-
ginning inventory plus 15,000 gallons started into processing during April. Only
15,700 gallons (13,200 completed and 2,500 in ending inventory) are accounted for
prior to considering the processing loss. The 1,300 lost gallons are included in the
schedule of gallons accounted for to balance to the total 17,000 gallons, but these
gallons are not extended into the computation of equivalent units of production.
Using the method of neglect, these gallons simply “disappear” in the EUP sched-
ule. Thus, the cost per equivalent gallon of the remaining good production of the
period is higher for each cost component.
Had the lost gallons been used in the denominator of the cost per EUP com-
putation, the cost per EUP would have been smaller, and the material cost per unit
would have been $6.85 ($102,750 Ϭ 15,000). Because the lost units do not appear in
the cost assignment section, their costs must be assigned only to good production.
The use of the lower cost per EUP would not allow all of the costs to be accounted
for in Exhibit 7–2.
Chapter 7 Special Production Issues: Lost Units and Accretion
267
Accounting for normal, continuous shrinkage (or defects/spoilage) is the eas-
iest of the types of lost unit computations. There is, however, a theoretical prob-
lem with this computation when a company uses weighted average process cost-
ing. The units in ending Work in Process Inventory have lost unit cost assigned to
them in the current period and will have lost unit cost assigned again in the next
period. But, even with this flaw, this method provides a reasonable measure of
unit cost if the rate of spoilage is consistent from period to period.
Situation 2—Normal Spoilage Only; Spoilage Determined at
Final Inspection Point in Production Process (Discrete)
This example uses the same basic cost and unit information given above for Im-
pervious Inc. except that no shrinkage occurs. Instead, the paint is inspected at
the end of the production process. Any spoiled gallons are removed and discarded
at inspection; a machine malfunction or an improper blending of a batch of paint
usually causes spoilage. Any spoilage of 10 percent or less of the gallons placed
into production during the period is considered normal. A production flow diagram
is shown at the top of the next page.
Part 2 Systems and Methods of Product Costing
268
PRODUCTION DATA EQUIVALENT UNITS
Whole
Units Material Conversion
Beginning inventory (100%; 60%) 2,000
Gallons started 15,000
Gallons to account for 17,000
Beginning inventory completed
(0%; 40%) 2,000 0 800
Gallons started and completed 11,200 11,200 11,200
Total gallons completed 13,200
Ending inventory (100%; 75%) 2,500 2,500 1,875
Normal shrinkage 1,300
Gallons accounted for 17,000 13,700 13,875
COST DATA
Total Material Conversion
Beginning inventory costs $ 16,620
Current costs 122,175 $102,750 $19,425
Total costs $138,795
Divided by EUP 13,700 13,875
Cost per FIFO EUP $8.90 $7.50 $1.40
COST ASSIGNMENT
Transferred:
Beginning inventory $16,620
Cost to complete: Conversion (800 ϫ $1.40) 1,120
Total cost of beginning inventory $17,740
Started and completed (11,200 ϫ $8.90) 99,680
Total cost of gallons transferred $117,420
Ending inventory:
Material (2,500 ϫ $7.50) $18,750
Conversion (1,875 ϫ $1.40) 2,625 21,375
Total costs accounted for $138,795
EXHIBIT 7–2
Cost of Production Report for
Month Ended April 30, 2000
(FIFO method) (Normal
continuous shrinkage)