Báo cáo khoa học nông nghiệp " Nutrient recovery by rice crops as a treatment for aquaculture solid waste: crop yield, nutrient status and nutrient budgets " doc
Bạn đang xem bản rút gọn của tài liệu. Xem và tải ngay bản đầy đủ của tài liệu tại đây (211.75 KB, 24 trang )
Final
Nutrient recovery by rice crops as a treatment for aquaculture solid waste: crop
yield, nutrient status and nutrient budgets
Cao van Phung
1
1. Cuu Long Rice Research Institute, O’Mon, Cantho Province, Vietnam. Email:
, Nguyen be Phuc
2
, Tran kim Hoang
2
and Bell R.W.
3
2. An Giang University, Long Xuyen, An Giang Province, Vietnam
3. School of Environmental Science, Murdoch University, Murdoch 6150, Australia.
Abstract
Waste from intensive catfish aquaculture production has become a pollutant of surface
waters in the Mekong Delta, Vietnam. In the present study, the aim was to treat the solid
waste from catfish ponds in the Mekong Delta by land application to padi fields so that
the nutrients could be recovered by rice crops as a fertilizer substitute. A field experiment
was commenced in the wet season 2007and continued for 6 consecutive rice crops using
three doses of solid wastes (1, 2 and 3 tonne/ha) in combination with 1/3 or 2/3 of the
recommended inorganic fertiliser rate (60N-17P-24K in wet season and 80N-17.4P-
49.8K/ha in the dry season in kg/ha). Rice yields were generally similar in all treatments
in each of the 6 consecutive crops, except that wet season yields declined by ?? with 1/3
rd
the fertiliser dose with only 1 t of solid waste. Moreover, with 3 t of solid waste ha, 1/3
rd
fertiliser dose gave higher yields in the dry season than with 2/3
rd
dose. With straw
removal, generally N and K balances were positive in the wet season when yields were
low, but negative in the dry season. With straw retention, all K balances were strongly
positive but N balances were only positive with the higher solid waste and N fertiliser
rates. Phosphorus balances were always strongly positive. Mean levels of organic C, N,
available P, K and Zn increased in soils over the course of 6 rice crops. These results
suggest that the fishpond solid waste replaced 1/3 to 2/3 of the fertiliser normally applied
1
Corresponding author Cuu Long Rice Research Institute, O’Mon district, Cantho city-Vietnam. Phone No
(84) 710861452. Fax: (84) 710861457. Email:
and confirmed that solid wastes from fishponds can be recycled for rice culture to
mitigate pollution of waterway and reduce fertiliser costs.
Keywords: Catfish, fishpond waste, pollution, nutrients.
Introduction
Waste from intensive catfish (Pangasianodon hypophthalmus) aquaculture production
has become a pollutant of surface waters in the Mekong Delta, Vietnam (Phuong, 1998).
From these ponds, large quantities of liquid and solid waste are discharged to waterways
without treatment. Consequently, the pollution of canals or rivers by loading of fishpond
waste, rich in nutrients (especially nitrogen, phosphorus and potassium) has emerged as a
major concern.
Catfish culture in the Mekong Delta has been practiced for a long time but this industry
became important for export only after the year 2000 with an annual growth rate of about
15-20 %. Total catfish production in the Mekong delta has increased sixfold from
400,000 tonnes in 2004 to over 1.5 million tonnes in 2007 from ponds that cover about
5,000 ha in the Mekong delta, Vietnam (Phuoung et al. 2008). From the production of
these large quantities of fish, it is estimated that about 450 million cubic metres of solid
and liquid waste from fishponds is discharged annually directly to water sources (Phuong,
1998). Pollution due to fishpond waste is attributed to high organic carbon and nutrients
(Pillay, 1992). The quantity of waste produced depends upon the quantity and quality of
feed (Cowey and Cho, 1991). However, integration of aquaculture into existing
agricultural systems has been reported to improve productivity and ecological
sustainability through better management and improved soil fertility arising from waste
recycling (Bartone and Arlosoroff; 1987). Moreover, properly managed composts can
reduce the need for fertilisers (Falahi-Ardakani et al. 1987).
The nutrients supplied in fishpond solid waste need to be carefully managed in rice fields
to avoid significant change in the soil loading of available nutrients. The accumulation of
P in soils may over time lead to eutrophication of surrounding waterways, as has occurred
in many parts of the world (Brookes et al. 1997). Moreover, excessive N supply to rice
crops from the combination of N in solid waste in fertiliser supply may lead to lodging of
rice that decreases harvestable grain yield. Hence any scheme to use fishpond solid waste
needs to carefully account for the extra nutrients supplied and make appropriate
adjustments to fertiliser rates and time of application. The availability of nutrients in
fishpond solid waste also needs to be determined.
The present study aims at recycling solid wastes from fishponds by using them in rice
cultivation to recover the nutrients and make use of the organic content in wastes. The
objective of the study was to determine the fertiliser substitution value of the solid waste
in order to determine how to adjust recommended fertiliser rates for rice.
Materials and methods
Solid waste from fishponds in the form of sludge, with up to 60 % water content, was
drained and then incubated to allow partial composting. The composition of solid waste
for the wet (Cw) and dry season (Cd) is shown in Table 1. Inorganic fertilisers used for
field experiments were urea, superphosphate and muriate of potassium.
Field experiments on recycling of solid waste were carried out on six consecutive
rice crops commencing with the wet season 2007 and ending with the dry season 2010 at
the Cuu Long Rice Research Institute farm at O Mon, Can Tho Province (soil type
Umbri-EndoOrthiThionic-Gleysols). Soil characterisation is given in Table 2. Treatments
comprised inorganic fertiliser (T1-control) at the recommended dosage of 60N-17.44P-
49.8K/ha for wet season and 80N-17.4P-49.8K/ha for dry season crops, respectively.
Fishpond solid waste was applied at 1, 2 or 3 tonnes/ha on dry weight basis in
combination with inorganic fertiliser dosages of 1/3 (referred to as treatments T2, T3, T4)
or 2/3 (referred to as treatments T5, T6 and T7, respectively) of those applied in the
control. Experiment was laid out in randomized block design with three replications and
plot size of 7x7 m. Direct seeding of short duration rice cv. Thai Bonet was used for both
wet and dry season crops. All fishpond solid waste was applied before planting as was 50
% of the inorganic P and K. The remaining P and K was applied at panicle initiation stage
at 35 days after sowing (DAS) while N was split 3 times (7, 20 and 35 DAS) with 25, 50
and 25 % applied, respectively. Water level was maintained at 2 cm depth throughout the
crop cycle.
Yield components were measured on samples collected in two quadrats of 0.5x
0.5 m. Actual yields were recorded by harvesting 5 m
2
in every plot. Rough rice was then
dried, weighed and measured for moisture content. Manual harvesting involved cutting
the upper 2/3 of rice plant from the base as is conventional practice by farmers. Threshing
was carried in the rice fields leaving rice straw in situ. Under triple rice pattern, straw is
usually spread evenly and then burned to facilitate land preparation by rotary tillering for
the next crop. However, there is still 1/3 of rice straw left on paddy under double rice
system because timing is not so strict and ploughing can be carried out when rice stalks
are present on the paddy.
Organic carbon is determined by wet digestion; analysis of nutrients (N, P, K, Ca,
Mg, Fe, Cu, Zn, Mn) followed standard methods for soil (Page et al. 1982), plant
analysis (Chapman and Pratt, 1961); water and wastes samples analysis followed methods
for chemical analysis of water and wastes (MCAWW) EPA/600/4/79-020 revised March
1983. Statistical analysis was completed with IRRISTAT software version 5.1 by
applying a balanced one-way ANOVA.
Nutrient (N, P, K) balances were calculated following the approach of Dobermann and
Fairhurst (2000) to estimate total input and output. Values from Dobermann and Fairhurst
(2000) were replaced where possible with locally relevant values. Nutrient budgets for
nitrogen, phosphorus and potassium under the double rice system were calculated for the
scenario where 2/3 of the straw is removed, which is current practice, and for 100 %
retention of straw as an indication of the consequences of different straw management
strategies.
Results
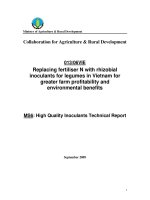
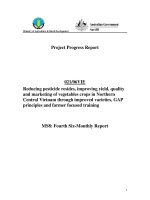
In the wet season 2007, rice yields were not significantly different among the treatments.
However, due to the uniformly low yield ranging from 2.04 to 2.40 t/ha nutrients in this
season were probably not limiting factors.
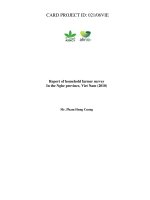
Rice yields increased to 6 t/ha in the dry season 2008 (Fig. 1). Treatment T1 (100 %
inorganic fertiliser at recommended rate for dry season) achieved the highest yield.
However, it was not significantly higher than treatments T2, T5, T6 and T7. The lower
yield in T3 indicated that 1 t of sludge/ha and a reduction in fertiliser by 1/3 resulted in
inadequate nutrients for optimal yield. However, an increase in solid waste application
rate to 2 or 3 t/ha offset the effects of 1/3 reduction in fertiliser. Moreover, the 2/3
reduction of fertiliser with 1 t of solid waste had not significant effects on yield.
Analysis of soil, straw and grain for concentration of macro, secondary and
micronutrients showed no variation among treatments for both crops (only macro
nutrients analysis were shown in Tables 4-9). This indicated that the use of fishpond solid
waste for rice cultivation did not negatively affect rice growth.
The highest rice yield was recorded in treatment T7 during wet season 2008 (crop 3) but
it was not significantly different from other treatments. There were also no differences in
nutrients concentrations in soil, straw and grain analysis. The following dry season crop
(4
th
) also had no differences in yield and nutrients concentration among treatments.
Nevertheless total nitrogen and available phosphorus in soil were high in treatment T7
and T1, respectively. The highest rice yield in treatment T6 was recorded in the wet
season 2009 and it was significant different from others. Meanwhile the lowest yield was
found in treatment T2 receiving the lowest fertilization but it was not significantly
different to treatment T4. Again treatments T1, T3, T4, T5 and T7 were not statistically
different in rice yields. Nitrogen concentration in straw of T6 was also the highest;
however, it was not significant different from treatments T1, T3, T5, T7. Potassium
concentration in straw of T4 was the lowest in comparison with other treatments. In
contrast, T1 had the highest K concentration but it was not significant different with
treatment T2, T6 and T7. Again the K concentrations of T6&T7 were more or less the
same as T3&T5. In the dry season 2009-2010 (6
th
crop), there were no differences in rice
yields amongst different treatments even though T7 was the highest. Nitrogen
concentration in straw of T2 was the lowest. This data again suggested that low
fertilization under this treatment could not meet crop demands for rice growth and
development.
Nutrient budgets
Nitrogen balances over six succeeding crops were presented in Table 11a&b commencing
with crop 1 in the wet season 2007 and ending with crop 6 of the dry season 2009-2010.
Data in these tables indicated that treatments receiving high N fertilizer (T1, T3, T5, T7)
had positive N balances even when straw was removed. When rice straw was returned to
paddy completely, treatment T6 also had positive balance in N due to low nutrient
requirements of the wet season rice crop. In addition, high N supply with both inorganic
and organic forms caused positive N balances in all treatments for the other two wet
season crops in 2008 and 2009 even when rice straw was removed. Overall, results
indicate that the higher the N input, the higher the positive N balance.
Rice yields in dry season crops were about 2 times higher than wet season crops
indicating that nutrient removal will be about 2 times higher; consequently, N balances
for this crop under straw removal were mostly negative except for treatments T5 and T7
of crop 6 because they were received high dosages of manure and N fertilizer. In the
cases where rice straw was fully retained, there were outstanding positive N balances of
treatments T1, T3, T5, T7 and also T6 in the 6
th
crop.
Balances in phosphorus over 6 continuous rice crops were always positive even in the
case of straw removal. This indicated that fertilisers and solid waste dosages of this
experiment were higher than crop removal. Phosphorus might build up in this acid soil
over long time use with both the present P fertiliser application and if solid waste was
applied regularly (Table 12 a&b).
When straw was removed, K balances in wet seasons were mostly positive except in
T2&T4 in the first two crops due to low K application. This trend was reversed in dry
season rice crops due to high yields as a consequence of high nutrient requirements. Since
treatments T1 and T7 at crop 4
th
had received high K dosage either in inorganic or
organic forms, they were still positive in K balances.
When rice straw was returned to paddy, K balances over all treatments were positive.
This confirmed that rational use of rice straw either by retention in paddy fields or by
making compost or mixing with fishpond solid waste can help farmers save money for K
fertilisers.
Changes in soil properties
The most impressive change in chemical properties was the organic carbon content in soil
of treatment T7 that had increased after crop 2
nd
(Table 14). From there on carbon content
in soil under this treatment did not increase further. Total N and K were also increased
substantially over time, with the use of fertiliser and fishpond waste after 6 subsequent
crops. Zinc content in soil increased significantly resulting from high Zn content in
fishpond waste application to paddy.
Discussion
Rice production in the Mekong delta is mainly monoculture rice under double or triple
cropping per year. Wet season rice has lower yield than dry season crops (Hoa 2006).
Recent study indicated that organic carbon accumulated in paddy under continuous
submergence but anaerobic decomposition of debris will also inhibit N mineralization
(Olk et al. 2000). Ve et al. (1993) showed that triple rice might have higher total N in
soils than double rice but N mineralization was very low. Results in this study also
indicated that total N was increased.
Negative N balance mainly occurred in dry season crops (T2&T4) in treatments having
low N supply indicating that these combinations were not sufficient to maintain
sustainable rice production even in the case where rice straw was fully returned to the
paddy fields. Nitrogen balances in these studies also pointed out that N fertiliser in the
wet season can be reduced further on account of low yield potential to alleviate pollution
risk. Alternatively limiting factors must be identified to increase rice yield in the wet
season in order to use fertilisers more efficiently. Survey data by Tan et al. (2000)
revealed that most of farmers in the Mekong delta applied incorrect fertiliser dosages for
wet season crops. They normally used about 123 kg N/ha for wet season rice crops but
only 113 kg N/ha for the dry season even though yield in the wet season was lower. The
reason behind this choice was that rice in the wet season is stunted and farmers only
know the application of nitrogen as a method to increase rice plant health. Hence the risk
of positive N balances in farmers’ rice fields may be greater than that calculated here on
account of greater wet season N fertiliser application by farmers.
Long term effects of cropping systems on N balance are still limited and giving
contradictory results. Campbell and Zentner (1993) found negative N balances after 24
years of crop rotation but Drinkwater et al., (1998) discovered positive N balance on
legume-based cropping. Anh (2001) concluded that there were negative N balances in
most of soils in Vietnam but he did not give more details to justify these conclusions.
These finding may only be true in the case of low fertilization rates, high yielding crops
and complete removal of crop residue. Data in Table 11a&b consolidated this
explanation. Pampolino (2007a) reported that total N in soil changed very little or not at
all after 13 years under rice cultivation without fertilization. He pointed out that N loss
was far higher than N fixation when N fertiliser was applied at high dosage. An
experiment at CLRRI on ammonia volatilization with 100 kg N/ha were set up in 2009 on
a paddy field. Results gave out NH
3
loss at only 1 kg N/ha for the wet season and 11 kg
N/ha in dry season rice crops (Giau, 2010). These figures were used to adjust N balance
of the present study but the change in N balance would not be great.
Based on data of N balances over all 6 crops under different treatments in this study, it
might be concluded that the treatment T1 (recommended dosage of inorganic fertilisers)
used in this study was reasonable to maintain N balance when straw was removed. The
treatment combination of T3 or T6 could be recommended to farmers who could prepare
manures for their own use to save money on fertiliser costs. Further reduction in
inorganic fertilisers might be possible when all straw was retained and in this case
treatments T2 &T4 are recommended.
Phosphorus balances (Table 12a&b) showed that only treatments T2, T4 and T6 (low
inorganic fertilization) in the first dry season crop (crop 2
nd
) had negative P balances. The
other 5 rice crops had positive P balances. This finding was similar to the results of Giau
(2010) studying P balances for the rice-rice system on Mekong delta soils. Dat (2009)
also found positive P balances on the rice-maize-rice system. Over 2 wet season rice
crops, the 5
th
crop compared to 3
rd
crop, the available P over all treatments was
significantly increased (Table 15). Treatments T2, T6 and T7 after the 5
th
crop were
statistically higher than those by the end of the 3
rd
crop (Table 15). These results suggest
that soil amended with fishpond solid waste could increase available P on this acid soil.
Since the present available P levels are still quite low, it will take some time before there
is sufficiently high P levels to replace the need for fertiliser application or to create a risk
of off-site effects of P from the continual use of fishpond waste. However, as a
precaution, and to minimise costs of rice production there appears to be ample scope for
substantial decreases in P fertiliser application when fishpond waste is applied.
Potassium balances were positive when straw was completely returned to paddy and also
for those treatments receiving high K fertilization, even with straw removal (Tables 13
a&b). These findings were similar to Hoa (2006) who studied K balances on a CLRRI
soil. Doberman et al. (1998) stated that most intensively cultivated paddy fields in Asia
had negative K balance. Potassium balance depended on many factors such as water
source, K adsorption by soil, straw management and rice yields. Another investigation on
double rice farming in the Mekong delta also showed positive K balance for
exchangeable, non-exchangeable and total K in soil (Giau, 2010). Overall results
indicated that farmers in the Mekong delta should make greater use of rice straw and
fishpond solid waste to return K to their paddy for sustainable rice cultivation and to
reduce costs for rice production.
Data in this studies had revealed that organic carbon as well as total N built up after 6
crops continuously amended with fishpond solid waste (Table 14). This will benefit soils
with very low organic carbon content especially in areas of the closed dike system of An
Giang province under triple rice cropping sequence where current total fertiliser
application/crop is about 600-700 kg/ha.
Solid waste from fishponds could be used in a numbers of ways such as composting,
mixing with rice straw to make organic manure or direct application (Table 1&2). Water
hyacinth is also a good source for mixing with fishpond sludge to make manure but this
might further boost available P and total P in comparison to rice straw (Birch, 2008).
Fishpond solid waste mixed with straw have been shown in our experiments to replace
1/3 to 2/3 of inorganic fertilisers. Vermicompost prepared from manure with sludge: rice
straw at a ratio 1:1 showed advantage over inorganic fertilisers in vegetable production.
Application of 10 tons of vermicompost in combination with 50 % of farmers’ inorganic
fertilisers formula per ha (150N-100 P2O5-30K2O) gave higher yield of lettuce (Lactuca
sativa )
than treatment with 100 % inorganic fertilisers (Tien, 2010). However, yields of
chinese spinach (Ipomoea aquatica) with these two treatments were not statistically
different.
The application of fishpond solids can cause “clogging” of soil pores at the soil
surface, due to the organic and inorganic particles applied. Clogging interferes with
the movement of gases and liquids into the soil matrix (Fuller and Warrick 1985;
Loehr et al. 1979). For rice, exact levelling is required to prevent waste accumulating
in low patches, where excessive N loading causes a tendency to lodging of rice.
Hence, the advantages of using fishpond solid waste to replace inorganic fertiliser
need to be weighed against possible negative effects on nutrient distribution in
fields and clogging of pores. However, the padi rice system is not a percolation based
system of waste treatment, hence the blocking of surface pores may not be a
significant concern except before direct sowing of rice seeds on the prepared
seedbed.
Assuming a fish harvest of 300 t/ha/yr from fishponds, and a feed conversion of 1
tonne of fish biomass for every 1.6 t of feed, 1 ha of fishpond generates about 180 t
of organic waste. Based on an application rate of 3 t/ha, about 60 ha of padi land per
1 ha of fishpond. This represents a minimum ratio of fishpond area to rice paddy
area. Greater than 60 ha per ha of fishpond area would be advisable to minimise the
risks of nutrient build up as discussed above and to allow for the unavailability of
some fields at the time when the solid waste was available. Since about 5,000 ha of
land is occupied by fishponds in the Mekong delta, > 300,000 ha of padi land in close
proximity to the fishponds may be required to treat solid waste.
Conclusions
The use of fishpond solid waste at 1-2 t/ha can save 1/3 or more of nitrogen, phosphorus
and potassium currently applied to crops as inorganic fertiliser while at 3 t/ha up to 2/3 of
the fertiliser recommended can be replaced. Indeed since farmers’ commonly overuse N
fertiliser in the wet season, even greater savings in fertiliser cost are feasible.
Recycling of waste from fishponds for rice cultivation has the potential to alleviate water
pollution by reducing the quantity discharged directly to water sources.
No phytotoxicity to rice plants was observed from application of waste from fishponds to
paddies.
Continued monitoring of fields under treatment with fishpond solid waste is necessary to
determine longer term effects on nutrient balances, soil quality, rice yields and
environmental water quality.
Acknowledgements
This research was financially supported by CARD project VIE/023/06. The assistance of
staff in the Soil Science Department and a student of An Giang University to carry out
this study are greatly appreciated. Thanks also to Cuu Long Rice Research Institute and
the Ministry of Agriculture & Rural Development, Vietnam for the facilities and services
granted to complete this investigation.
References cited
Bartone, C.R., Arlosoroff, S., 1987. Irrigation reuse of pond effluents in developing
countries. Wat. Sci. Tech. 19, 289-297.
Brookes, P.C., Heckrath, G., De Smet, J., Hofman, G., Vanderdeelen, J. 1997. Losses of
phosphorus in drainage water, in: Tunney, H. Carton, O.T. Brookes P.C. and Johnston
A.E. (Eds), Phosphorus Loss from Soil to Water. CAB International Press: Oxon, U.K.,
pp 253-271.
Chapman, H.D., Pratt, P. F., 1961. Methods of analysis for soil, plant and water. Division
of Agricultural Sciences, University of California, Riverside.
Cho, C.Y., Hynes, J.D., Wood, K.R., Yoshida, H.K., 1991. Quantification of fish culture
wastes by biological and chemical (limnological) methods, in: Cowey C.B. and Cho C.Y.
(Eds), Nutritional Strategies and Aquaculture Waste. University of Guelph, Canada.
Cong, P.T., Sat, C.D, Castillo, E.G., Singh, U., 1995. Effect of phosphorus and growing
season on rice growth and nutrient accumulation on acid sulfate soils, in: Vietnam and
IRRI: A Partnership in Rice Research. International Rice Research Institute, Manila 1099,
Philippines. pp. 123-135.
Cripps, S.J. 1995. Serial particle size fractionation and characterisation of an
aquacultural effluent. Aquaculture 133, 323-339.
Falahi-Ardakani, A., Bouwkamp, J.C., Gouin, F.R., Chaney, R.L., 1987. Growth response
and mineral uptake of vegetable transplants grown in a composted sewage sludge
amended medium. J. Environment Horticulture 5, 559-602.
Giau, T, V.2010. Effects of crop rotation and water saving technique on chemical
changes and NPK balance in acid sulfate paddy soils. Ph.D thesis-Cantho University.
Guong, V.T, Lap, T.T, Hoa, N.M., Castillo, E.G., Padilla, J.L., Singh, U., 1995. Nitrogen
use efficiency in direct seeded rice in the Mekong River Delta: varietal and phosphorus
response, in: Vietnam and IRRI: A Partnership in Rice Research. International Rice
Research Institute, Manila, Philippines. pp. 150-159.
Hung, N.N, Singh, U., Xuan, V.T, Buresh, R.J., Padilla, J.L., Lap, T.T., Nga, T.T., 1995.
Improving nitrogen use efficiency of direct seeded rice on alluvial soils of the Mekong
River Delta, in: Vietnam and IRRI: A Partnership in Rice Research. International Rice
Research Institute, Manila, Philippines. pp. 138-149.
Hoa, N.M. 2006. Additional sources of K for soils in the Cuu Long delta under
intensive cropping. Viet. J. Soil. Sc. No. 24, pp 62-65.
Olk, D.C., Brunetti, G., Senesi, N., 2000. Decrease in humification of organic matter with
intensified lowland rice cropping: A wet chemical and spectroscopic investigation. Soil
Sci. Soc. Am. J. 64,1337–1347.
Page, A.L., Miller, R.H., Keeney, D.R., (eds) 1982. Methods of Soil Analysis. Number 9
(part 2). Soil Sci. Soc. Amer. Madison, Wisconsin USA.
Phuong, N.T. 1998. Cage culture of Pangasius catfish in Mekong delta, Vietnam: current
situation analysis and studies for feed improvement. Unpublished Ph.D thesis, National
Institute Polytechnique of Toulouse, France.
Phuong, N.T., Oanh, N.T.H., Tuan, N.A., 2008. Striped Catfish (Pangasianodon
hypophthalmus) Aquaculture in Vietnam: An Unprecedented Development within a
Decade. Catfish Aquaculture in Asia: Present Status and Challenges for Sustainable
Development. Handbook and Abstracts from Conference at CanTho University, CanTho
City, Vietnam. p. 25.
Pillay, T.V.R. 1992. Aquaculture and Environment. Blackwell Scientific Publ.,
Cambridge,
Tien, N.T. 2010. Study on vermicompost prepared from fishpond sludge and agricultural
wastes for production of vegetables. MSc. thesis-Cantho University.
Table 1: Nutrient concentration on dry weight basis of compost made in the wet season
(Cw) and dry season (Cd) from fishpond solid waste.
Sample
N %
P %
K %
Mg %
Fe %
Mn
(%)
Ca
(mg/kg)
Cu
(mg/kg)
Zn
(mg/kg)
Cw
0.280
0.067
0.75
0.371
5.557
0.122
42.0
61.7
120
Cd
0.551
0.108
1.99
0.532
4.121
0.097
42.7
128
255
Table 2: Nutrient concentration on dry weight basis of organic manure prepared from
fishpond solid waste and rice straw by 1:1 ratio
Sample
N %
P %
K %
Ca %
Mg %
Fe (%)
Mn (%)
Cu
(mg/kg)
Zn
(mg/kg)
2008
2.04
2 0.82 0.743 2.200 0.901 0.453 0.291 62 309
2009
1.96
7 0.812 0.735 2.730 0.901 0.393 0.296 61 306
2010
2.29
7 1.066 0.848 2.928 0.941 0.423 0.306 73 346
Table 3: Soil characterization (0-15 cm) of experimental site at CLRRI in Cantho
province
Soil name
(FAO/UNESCO)
pH
(1:5 H
2
0)
Org. C %
Total (%)
N
P
K
Eutric Gleysol
4.8-5.2
2.29
0.268
0.021
0.915
Table 4: N (%) concentration in grain. Values are means of 4 replicates.
Treatment#
Crop 1
Crop 2
Crop 3
Crop 4
Crop 5
Crop 6
T1
1.898
1.305
1.268
1.358
1.311
1.522
T2
1.859
1.323
1.258
1.309
1.307
1.246
T3
1.689
1.302
1.365
1.241
1.293
1.366
T4
1.828
1.331
1.290
1.292
1.251
1.485
T5
1.523
1.292
1.346
1.278
1.325
1.418
T6
1.802
1.418
1.220
1.332
1.283
1.536
T7
1.684
1.294
1.223
1.309
1.353
1.664
CV%
6.6
4.4
6.7
4.0
7.4
11.3
LSD5%
0.201
0.103
0.150
0.095
0.116
0.29
# T1 (control) –inorganic fertiliser at the recommended dosage of 60N-17.44P-49.8K/ha
for wet season and 80N-17.4P-49.8K/ha for dry season crops, respectively. Fishpond
sludge compost was applied at 1, 2 or 3 tonnes/ha on dry weight basis in combination
with inorganic fertiliser dosages of 1/3 (referred to as treatments T2, T4, T6) or 2/3
(referred to as treatments T3, T5 and T7, respectively) of those applied in the control.
Table 5: N (%) concentration in straw. Values are means of 4 replicates.
Treatment#
Crop 1
Crop 2
Crop 3
Crop 4
Crop 5
Crop 6
T1
0.705
0.644
0.840
0.859
0.688
0.648
T2
0.655
0.658
0.826
0.733
0.636
0.614
T3
0.644
0.616
0.859
0.770
0.581
0.684
T4
0.681
0.695
0.784
0.784
0.662
0.568
T5
0.632
0.662
0.756
0.812
0.590
0.572
T6
0.695
0.662
0.877
0.821
0.611
0.614
T7
0.621
0.670
0.812
0.742
0.676
0.622
CV%
12.0
11.3
11.2
12.9
4.4
17.6
LSD5%
0.092
0.132
0.163
0.184
0.050
0.262
# see Table 4
Table 6: P concentration (%) in grain. Values are means of 4 replicates.
Treatment#
Crop 1
Crop 2
Crop 3
Crop 4
Crop 5
Crop 6
T1
0.226
0.246
0.248
0.238
0.257
0.248
T2
0.218
0.256
0.253
0.242
0.263
0.236
T3
0.225
0.277
0.298
0.258
0.285
0.242
T4
0.231
0.259
0.305
0.294
0.277
0.264
T5
0.225
0.257
0.224
0.204
0.236
0.252
T6
0.218
0.256
0.226
0.236
0.242
0.266
T7
0.246
0.251
0.319
0.242
0.253
0.258
CV%
4.4
7.5
2.3
1.1
5.8
16.5
LSD5%
0.017
0.034
0.167
0.063
0.045
0.083
# see Table 4
Table 7: P concentration (%) in straw. Values are means of 4 replicates.
Treatment#
Crop 1
Crop 2
Crop 3
Crop 4
Crop 5
Crop 6
T1
0.079
0.116
0.179
0.087
0.095
0.126
T2
0.082
0.106
0.157
0.078
0.102
0.104
T3
0.082
0.105
0.157
0.079
0.103
0.114
T4
0.083
0.109
0.163
0.076
0.098
0.142
T5
0.082
0.112
0.143
0.077
0.103
0.146
T6
0.085
0.106
0.219
0.082
0.099
0.128
T7
0.081
0.112
0.159
0.079
0.097
0.152
CV%
8.2
5.4
17.5
6.9
5.1
13.3
LSD 5%
0.007
0.010
0.053
0.010
0.032
0.029
# see Table 4
Table 8: K concentration (%) in grain. Values are means of 4 replicates.
Treatment#
Crop 1
Crop 2
Crop 3
Crop 4
Crop 5
Crop 6
T1
0.235
0.268
0.227
0.242
0.167
0.261
T2
0.300
0.268
0.255
0.251
0.152
0.221
T3
0.281
0.290
0.361
0.232
0.140
0.205
T4
0.207
0.292
0.271
0.284
0.131
0.231
T5
0.267
0.277
0.299
0.232
0.169
0.213
T6
0.215
0.284
0.230
0.343
0.163
0.205
T7
0.229
0.274
0.252
0.214
0.160
0.218
CV%
12.7
6.7
19.0
11.3
13.0
19.9
LSD 5%
0.110
0.033
0.092
0.078
0.025
0.078
# see Table 4
Table 9: K concentration (%) in straw. Values are means of 4 replicates.
Treatment#
Crop 1
Crop 2
Crop 3
Crop 4
Crop 5
Crop 6
T1
1.575
1.613
1.623
1.225
1.673
1.980
T2
1.160
1.710
1.655
1.348
1.587
1.881
T3
1.231
1.457
1.643
1.458
1.440
1.903
T4
1.632
1.616
1.543
1.386
1.307
1.978
T5
1.769
1.867
1.635
1.488
1.433
1.454
T6
1.356
1.637
1.669
1.263
1.493
1.970
T7
1.445
1.529
2.079
1.287
1.470
1.826
CV %
13.8
17.4
21.0
15.0
8.5
19.6
LSD 5%
0.412
0.506
0.410
0.404
0.205
0.648
# see Table 4
Table 10: Nutrient budget for rice supplied with 2/3 the recommended NPK fertiliser rate
and 3 t of fishpond solid waste/ha (T7) in crop 1 (wet season).
Input
N
P
K
Notes
IN1 Fertiliser 40 11.7 33.2
Wet season CLRRI rate at 1/3 of
recommended rate
IN2
Rainfall
2
Dry season only irrigation water used
IN3
Irrigation
water 15 8.5 20 5 times
IN4
Solid waste
24
2.01
22.5
Assume all nutrients are soluble
IN5
N2 fixation
23
Dobermann and Fairhurst (2000)
104
22.2
75.7
Outputs
OUT1
Grain
54.9
8
7.5
Yield=3.29 t/ha
OUT2 Straw 13.5 1.8 31.4
HI 0.5 from Dobermann and Fairhurst
(2000)
OUT3
Percolation
17
1
10
Dobermann and Fairhurst (2000)
OUT4
Gaseous
losses 1 0 0
Gaseous loss by NH3 volatilization
and denitrification
86.4
10.8
48.9
Net balance
17.6
11.5
26.9
Straw removed (only 2/3)
31.1
13.2
58.2
Straw retained 100%
Table 11a: Balance for N in each crop with full, 1/3 and 2/3 fertiliser rates applied (Straw
removal).
Treatment#
Crop 1
Crop 2
Crop 3
Crop 4
Crop 5
Crop 6
T1
5.87
-26.1
28.4
-33.8
41.9
-24.7
T2
-24.0
-66.2
13.9
-61.0
32.9
-42.7
T3
4.80
-12.6
25.9
-35.1
48.0
-15.1
T4
-18.2
-50.5
23.7
-43.9
50.1
-21.6
T5
14.4
-27.3
45.6
-15.0
67.4
3.02
T6
-6.85
-60.5
49.7
-38.3
54.2
-4.8
T7
17.7
-15.7
64.5
-0.01
86.8
13.4
# see Table 4
Table 11b: Balance for N in each crop with full, 1/3 and 2/3 fertiliser rates applied
(Straw retained).
Treatment#
Crop 1
Crop 2
Crop 3
Crop 4
Crop 5
Crop 6
T1
20.98
3.60
44.85
4.10
52.30
1.51
T2
-9.93
-37.59
28.64
-27.79
40.16
-17.04
T3
18.01
8.50
42.63
0.88
55.97
11.83
T4
-3.06
-22.63
40.79
-7.77
58.65
-4.73
T5
28.18
0.90
61.18
21.65
75.53
30.15
T6
8.05
-30.81
67.07
2.56
66.03
22.60
T7
31.14
11.79
82.53
35.26
95.94
43.84
# see Table 4
Table 12a: Balance for P in each crop with full, 1/3 and 2/3 fertiliser rates applied (straw
removal)
Treatment#
Crop 1
Crop 2
Crop 3
Crop 4
Crop 5
Crop 6
T1
16.14
7.80
14.34
29.34
17.84
10.83
T2
5.25
-2.16
6.79
6.70
15.93
7.52
T3
11.30
7.19
15.69
10.78
20.18
7.89
T4
5.14
-0.41
16.28
11.05
23.15
14.67
T5
11.43
4.51
25.75
23.44
29.35
20.38
T6
6.54
-1.51
26.93
21.38
29.03
23.40
T7
11.47
6.32
29.68
27.92
37.42
25.72
# see Table 4
Table 12b: Balance for P in each crop with full, 1/3 and 2/3 fertiliser rates applied (Straw
retained)
Treatment#
Crop 1
Crop 2
Crop 3
Crop 4
Crop 5
Crop 6
T1
17.83
13.15
17.83
33.17
19.27
15.13
T2
7.01
2.45
2.81
10.23
17.09
11.87
T3
12.98
10.78
18.75
14.47
21.60
12.37
T4
6.99
4.34
19.82
14.55
24.41
19.25
T5
13.21
9.28
28.70
26.92
30.77
25.46
T6
8.37
3.24
31.26
25.46
30.94
27.27
T7
13.23
10.91
33.21
31.68
38.73
32.27
# see Table 4
Table 13a: Balance for K in each crop with full, 1/3 and 2/3 fertiliser rates applied (Straw
removal)
Treatment#
Crop 1
Crop 2
Crop 3
Crop 4
Crop 5
Crop 6
T1
18.49
-21.25
21.45
7.47
30.73
-24.28
T2
-0.50
-45.70
6.85
-32.01
13.44
-46.43
T3
16.79
2.04
8.20
-21.63
28.14
-24.36
T4
-1.65
-28.19
-0.87
-29.97
22.11
-38.16
T5
10.89
-26.88
15.11
-12.76
34.93
-1.51
T6
13.11
-31.5
9.13
-27.45
15.34
-12.59
T7
26.85
-1.80
11.00
1.12
42.53
-15.17
# see Table 4
Table 13b: Balance for K in each crop with full, 1/3 and 2/3 fertiliser rates applied (straw
retained)
Treatment#
Crop 1
Crop 2
Crop 3
Crop 4
Crop 5
Crop 6
T1
52.24
53.24
53.15
61.53
56.01
55.94
T2
24.43
28.63
29.62
29.01
31.46
32.19
T3
42.05
47.81
40.13
46.41
47.79
50.55
T4
34.68
36.16
32.67
33.88
38.97
39.84
T5
49.47
52.53
48.85
54.39
51.62
57.20
T6
42.19
41.98
42.13
35.36
44.22
48.78
T7
58.24
60.86
57.16
62.29
62.32
63.47
# see Table 4
0
0.5
1
1.5
2
2.5
3
3.5
4
T1 T2 T3 T4 T5 T6 T7
Treatment
Yield (T/ha)
WS 07
WS 08
WS 09
a
b
b
b
b
bc
c
T1: 60N-17.44P-49.8K kg/ha (WS); 80N-17.44P-49.8K/ha (DS);
T2: 1 tonne sludge compost/ha + 1/3 T1 T5: 2 tonnes sludge compost/ha + 2/3 T1
T3: 1 tonne sludge compost/ha + 2/3 T1 T6: 3 tonnes sludge compost/ha + 1/3 T1
T4: 2 tonne sludge compost/ha + 1/3 T1 T7: 3 tonnes sludge compost/ha + 2/3 T1
Fig. 1. Rice yields with fertilizer and fishpond solid waste for wet (WS)
crops.
0
1
2
3
4
5
6
7
8
T1 T2 T3 T4 T5 T6 T7
Treatment
Yield (T/ha)
DS 08
DS 09
DS 10
a
a
b
ab
a
a
ab
Fig. 2. Rice yields with fertilizer and fishpond solid waste for Dry (DS)
crops.
Table 14: Soil properties of treatment T7 before sowing and after crop 6 was harvested.
pH
EC
(mS/
cm)
C%
N%
P%
K%
Ca
(mg/
kg)
Mg%
Fe%
Mn%
Zn
(mg/
kg)
Cu
(mg/
kg)
Beginnin
g WS07
4.57
1.23
2.14
0.27
0.02
1.12
12
0.09
2.98
0.03
92
35
End
WS07
4.98
0.82
2.11
0.26
0.02
1.22
13
0.08
2.63
0.03
95
35
End DS08
5.22
0.95
2.05
0.26
0.02
1.44
14
0.08
2.11
0.01
76
27
End
WS08
5.21
0.97
2.12
0.23
0.02
0.98
13
0.10
2.65
0.02
112
32
End DS09
5.12
0.98
2.03
0.28
0.03
1.56
17
0.07
2.31
0.03
124
26
End DS10
5.14
1.09
2.54
0.29
0.02
1.54
11
0.08
2.32
0.03
152
26
CV%
2.3
11.3
8.8
7.2
18.0
21.2
15.2
10.0
12.1
10.0
11.9
10.5
LSD5%
0.19
0.15
0.33
0.02
0.01
0.48
4.6
0.02
0.60
0.01
21
5.14
Table 15: Available P (mg/kg) in plots of different treatments. Values
are means of four replicates.
Treatment#
Crop 3
Crop 5
P(T<=t)
T1
2.11
2.70
Non sig.
T2
1.24
2.69
0.047
T3
2.29
2.78
Non sig.
T4
2.29
2.44
Non sig.
T5
2.25
2.97
Non sig.
T6
2.27
3.46
0.038
T7
2.39
3.14
0.010
Mean
2.26
2.88
0.009
# see Table 4