Báo cáo hóa học: " A case study of GM maize gene flow in South Africa" potx
Bạn đang xem bản rút gọn của tài liệu. Xem và tải ngay bản đầy đủ của tài liệu tại đây (373.38 KB, 8 trang )
RESEARCH Open Access
A case study of GM maize gene flow in
South Africa
Chris Viljoen
1*†
, Lukeshni Chetty
2†
Abstract
Background: South Africa has been growing first-generation commercial genetically modified (GM) maize since
1997. Despite a requirement for non-GM food, especially for export, there is no system for coexistence of GM and
non-GM crop. Gene flow is a major contributor to commingling, and different distances of cross-pollination have
been recorded for maize, using a variety of field-trial designs under different environmental conditions, with the
furthest distance being 650 m. However, these trials have usually been small plots and not on the scale of
commercial farming. There are also no published data regarding the extent of cross-pollination for maize in South
Africa, even after a decade of commercialization of GM. Thus, the aim of this study, conducted from 2005 to 2007,
was to determine the extent of GM maize cross-pollination under South African conditions in the context of
commercial farming practice.
Materials and methods: Field trials were planted with a central plot of yellow GM maize (0.0576 ha) surrounded
by white non-GM maize (13.76 ha), in two different geographic regions over two seasons with temporal and
spatial isolations to surrounding commercial maize planting. Cross-pollination from GM to non-GM maize was
determined phenotypically across 16 directional transects. Pollen counts during flower ing were compared to
weather data as well as percentage cross-pollination. The data were transformed logarithmically, and mean
percentage cross-pollination was compared to high cross-pollination.
Results and discussion: Although there was a general congruency betw een wind data, pollen load and cross-
pollination, it is evident that wind data and pollen load do not solely explain the directional extent of cross-
pollination and that swirling winds may have contributed to this incongruence. Based on the logarithmic
equations of cross-pollination over distance, 45 m is sufficient to minimize cross-pollination to between <1.0% and
0.1%, 145 m for <0.1% to 0.01% and 473 m for <0.01% to 0.001%. However, compared to this, a theoretical
isolation distance of 135 m is required to ensure a minimum leve l of cross-pollination between <1.0% and 0.1%,
503 m for <0.1% to 0.01% and 1.8 km for <0.01% to 0.001% based on high values of cross-pollination.
Conclusions: Based on the results of this study, the use of mean values of cross-pollination over distance may
result in an underestimati on of gene flow. Where stringent control of gene flow is required, for example, for non-
GM seed production or for GM field trials under contained use, the high values of cross-pollination should be used
to determine isolation distance. However, this may not be practical in terms of the isolation distance required. We
therefore suggest that temporal and distance isolations be combined, taking into account the GM maize pollen
sources within the radius of the most stringent isolation distance required.
* Correspondence:
† Contributed equally
1
GMO Testing Facility, Department of Haematology and Cell Biology,
University of the Free State, Bloemfontein, South Africa
Full list of author information is available at the end of the article
Viljoen and Chetty Environmental Sciences Europe 2011, 23:8
/>© 2011 Viljoen and Chetty; licensee Springer. This is an Open Access article distributed under the terms of the Creat ive Commons
Attribution License ( which perm its unrestricted use, distribution, and reproductio n in
any medium, provided the original work is properly cited.
Background
South Africa is one of the few African countries
that have introduced genetically modified (GM) crops.
South Africa has been growin g first-generation commer-
cial GM crops since 1997 [1]. In 2008, South Africa was
ranked eighth in terms of global commercial GM pro-
duction [2]. It is estimated that 90% of cotton (insect
resistance (IR) and herbicide tolerance (HT)), 80% of
soybean (HT), 72% of yellow maize (IR and HT) and
55% of white maize (IR and HT) (an important food sta-
ple) productions in South Africa are GM [2]. In 2008/
2009, there were 14 field trials of various GM crops in
South Africa [3]. Thus, it is expected that the number of
approved GM events grown in South Africa will
increase in the future.
Despite more than a decade of rapid adoption of GM
crops in South Africa, there is currently no emphasis on
coexistence to establish management practices for the
effective segregation between GM and non-GM crops.
Despite this, there is a requirement for non-GM in
terms of export commodities, especially to countries in
Africa, Asia and Europe. Furthermore, there is an expec-
tation that second- and, especially, third-generation GM
crops will become a reality within the next few years.
This in itself will necessitate measures for coexistence
wherever such crops are grown [4].
In a document published by the European Commis-
sion, coexistence is explained as, “thechoiceofconsu-
mers and farmers between conventional, organic and
GM crop production, in compliance with the legal obli-
gations for labelling defined in Community legislation.
The possibility of adventitious presence of GM crops
in non-GM crops cannot be excluded. Therefore, suita-
ble measures are needed during cultivation, harvest,
transport, storage and processing to ensure coexis-
tence” [5]. Thus coexistence has become an important
issue in managing the introduction of GM crops, espe-
cially, since in recent years, there have been several
examples of unwanted commingling. Examples of these
include the detection of transgenes in landraces in
Mexico [ 6], the introgression of herbicide tolerance in
wild bentgrass in the USA [7], the Prodigene pharma-
ceutical producing maize that commingled with soy-
bean and maize [8], Starlink maize detected in
processed food products in 2001 [9] and Liberty-
Link601 rice found in conventional rice in 2006 [10].
Thus, we suggest that in a broader context, coexistence
deals with measures to prevent commingling between
GM and non-GM crops in order to minimize economic
losses as well as the negative impacts on human health,
trade and the environment [11-15]. Thus, unless GM
producing countries take steps to ensure coexistence,
unwanted commingling of GM and non-GM crop will
occur.
One of the considerations of coexistence is the trans-
fer of genes from one population to another through
gene flow via pollen [16]. The methods used to study
gene flow include potential pollen-mediated gene flow
(which includes the analysis of po llen viability, pollen
dispersal and deposition, pollen capture and computer
modelling) [17-26] and po llen-mediated gene flow
(whi ch involves determining the extent of cross-pollina-
tion over distance and computer modelling) [27-38].
While several studies have determined the extent of
cross-pollination at different distances ranging from 34
to 650 m, it is not certain how applicable these data are
to the maize growing region of South Africa. Thus,
while the aim of th ese studies has been to p redict theo-
retical distances in order t o minimize gene flow, the
var ying trial design and environmental co nditions make
it difficult to extrapolate this information from one
region to another. Thus, the aim of this study, con-
ducted from 2005 to 2007, was to determine the extent
of GM maize cross-pollination to non-GM maize under
South African conditions in the context of commercial
farming practice.
Materials and methods
Field trial
Converted MON810 yellow maize hybrids containing
Cry1Ab (PAN 6994B or PAN 6724B) and a conventional
white maize hybrid (PAN 6479) were planted in two
typical commercial maize growing regions, Bainsvlei and
Kroonstad during 2005/2006 and Bainsvlei and Water-
bron during 2006/2007, situated in the Free State pro-
vince, Sout h Africa. The hybrids were selected based on
their flowering synchronicity (74 to 76 days) and the
trials planted according to standard farming practice
without any herbicide or insecticide spraying. The trial
design consisted of a central yellow GM donor maize
field (approximately 20 × 35 m) surrounded by receptor
conventional white maize (approximately 180 × 230 m
for Bainsvlei and Kroonstad and approximately 180 ×
800 m at Waterbron) (Figure 1). The trials were planted
with a 4-week temporal isolation to other maize within
a 3-km radius to other maize plantings in the area.
Weather data (wind speed, wind direction, temperature
and relative humidity) were captured (5 days during
flo wering) using a mobile weather station (Vantage Pro,
Davis Instruments Corp., Hayward, CA, USA) and data
logger positioned in the centre of the GM plot.
Pollen capture
Pollen traps were set for 5 days during the flowering
period to coincide with weather data. The traps were set
at 50 m intervals from the GM plot in four compass direc-
tions (N, S, W and E) up to 400 m. The pollen trap com-
prised a clamp on a pole with a glass slide coated with
Viljoen and Chetty Environmental Sciences Europe 2011, 23:8
/>Page 2 of 8
Tween20, adjusted to a height of 1.8 m to m atch the height
of flowering maize. The glass slides were placed in the
clampat6:00a.m.andremovedat3:30p.m.daily,for5
days. Pollen was retrieved from the slides by rinsing them
with 1 ml cetyltrimethylammonium bromide (CTAB) buf-
fer (20 g/l CTAB, 1.4 M NaCl, 0.1 M Tris/HCl and 20 mM
EDTA, pH 8), after which, it was stored at 4°C. Pollen was
diluted (1:10) and counted using a haemocytometer using
a light microscope under 10 × magnification.
Evaluation of cross-pollination
At seed maturity, the white non-GM field was divided into
16 compass transects and the first cob on the maize plant
sampledat2mintervalsupto100matBansvleiand
Waterbron and 10 m inte rvals ther eafte r at Waterbro n
(Figure 1). A total of 800 cobs were sampled at Bainsvlei
and 1,280 at Waterbron, per site per season, respectively.
Statistical analysis and graphical representation
All the seeds were removed from the cob, and the
number of yellow seeds per cob was counted and
expressed as a percentage to total seed number per
cob. The mean percentage cross-pollination over
distance from the GM plot, for all trial sites, was repre-
sented graphically and subjected to a power trend line.
Each data set was transformed logarithmically and
subjected to a linear trend line. The mean cross-
pollination over distance per location per year was
compared to the combined means over all data sets.
The logarithmic high values of cross-pollination (the
highest value of cross-pollination at a particular dis-
tance interval irrespective of direction) over logarith-
mic distance per location per year were compared to
the combined values over all data sets. Theoretical
values of cross-pollination were calculated at 1.0%,
0.1%, 0.01% and 0.001% usin g linear equatio ns derived
from logarithmic cross-pollination over logarithmic
distance. ANOVA was performed using Excel 2007
(Microsoft Corporation, Redmond, WA, USA) on theo-
retical cross-pollination distances derived from loga-
rithmic combined mean cross-pollination over distance
compared to logarithmic high cross-pollination over
distance. The d atasets were combined and the t heoreti-
cal cross-pollination distances re-calculated using
means with a 90%, 95% and 99% confidence interval,
respectively.
Results and discussion
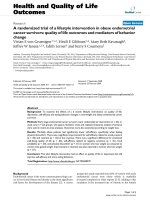
In a comparison of wind, pollen load and cross-
pollination roses (Figure 2), it is evident that at Bainsvlei
2005/2006, the greatest pollen load over the 5 days of
pollen capture was to the west and north, which par-
tially coincides with the greatest incidence of easterly
but not northerly wind. However, the greatest incidence
of cross-pollination was in a southerly direction. A simi-
lar lack of c ongruency between the direction of wi nd,
pollen load and cross-pollination was observed
in Bainsvlei 2006/2007 and Waterbron 2006/2007.
In Bainsvlei 2006/2007, the majority of winds were
northerly, while the greatest amount of pollen captured
was in a northerly and westerly direction and the major-
ity of cross-pollination was again in a southerly direc-
tion. Compared to this, Waterbron 2006/2007 had
mostly south-easterly and west-north-westerly winds;
the greatest pollen load was in an easterly direction with
the highest incidence of cross-pollination in a southerly
and, secondarily, in a northerly direction. Thus, from
these data, it is evident that wind direction, pollen load
and the extent of cross-pollination were not in agree-
ment across the different trial sites of this study. The
reasons for this are unkno wn, but we hypothesise that
other factors, inc luding wind type, and other environ-
mental and reproductive considerations may play an
important role in the effect of pollen load on the extent
of cross-pollination. The temperature (18°C to 23°C)
and relative humidity (29% to 72%) at all three sites
were characterized as, during pollen shed, conducive to
maintaining maximum pollen viability. Furthermore, all
three sites are characterized by swirling winds, and with
an influence of primarily northerly winds may partially
explain the bias for cross-pollination to the south. This
is an important consideration, and most modelling of
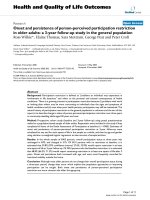
Figure 1 Field layout for Bainsvlei 2005/2006 and 2006/2007
and Waterbron 2006/2007. Field layout drawn to scale for
Bainsvlei 2005/2006 and 2006/2007 (180 × 230 m) and Waterbron
2006/2007 (180 × 800 m). The open centre block represents the
donor yellow GM maize and the surrounding grey block the
recipient white non-GM maize. Cobs were collected along the 16
transects every 2 m up to 100 m and a further 200 m at 10 m
intervals at Waterbron as indicated by the dashed line. Pollen traps
(indicated by X within the non-GM maize field) were set at 50 m
intervals in four directions and continued up to 400 m.
Viljoen and Chetty Environmental Sciences Europe 2011, 23:8
/>Page 3 of 8
pollen movement and cross-pollination has hitherto
assumed that the predominant direction for pollen
movement would also translate into the greatest direc-
tional degree of cross-pollination [20]. The results from
all three trial sites (the Kroonstad trial was terminated
due to early frost) suggest that this is not the case for
the geographic locations at which the trials occurred in
this study.
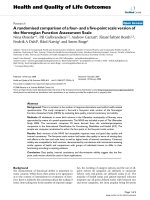
In this study, similar results to other studies were
found regard ing the trend in cross-pollination ov er dis-
tance [33-36]. The highest extent of cross-pollination
was observed at 2 m for Bainsvlei 2005/2006 (mean,
14%; highest, 55%), Bainsvlei 2006/2007 (mean, 19%;
highest, 54%) and Waterbron 2006/2007 (mean, 19%;
highest, 82%) (Figure 3). At all sites, cross-pollination
declined sharply up to between 20 and 25 m, after
which, followed a plateau of low-percentage cross-
pollination up to 100 m at Bainsvlei and 300 m at
Waterbron, the furthest evaluation point, respectively.
Although 98% of pollen deposition is known to occur
within 25 to 50 m from the source [39], and the extent
of cross-pollination is greatly reduced thereafter, it
is incorrect to assume that the plateau of low levels
of cross-pollination will no longer be observed at or
beyond 300 m [33]. One requirement in establishing
isolation distances regarding GM crops is whether
cross-pollination should be minimized to below a prede-
termined threshold, as in the case of non-GM or
organic production (depending on the regulations of the
region or country), or prevented, as in the case of GM
field trials under contained use or pharmaceutical,
industrial or biofuel production in food crops, where
there is 0% tolerance for contamination of non-GM
food crops. Furthermore, it should be noted that while
Figure 2 Comparison of wind, pollen load and cross-pollination roses. Graphical representation of the direction of pollen load (top panel),
wind data (middle panel) and cross-pollination (bottom panel) for Bainsvlei 2005/2006 (BV06), Bainsvlei 2006/2007 (BV07) and Waterbron 2006/
2007 (WB07). In the top panel, the summary pollen load (50,000 to 800,000) in four wind directions over 5 days of flowering is indicated. In the
middle panel, the direction and speed of wind, in metres per second (0.01 to 0.08 m/s), over 5 days of flowering are indicated. The bottom
panel indicates the direction of summary cross-pollination data over distance (× 100 m).
Viljoen and Chetty Environmental Sciences Europe 2011, 23:8
/>Page 4 of 8
isolation distance is an i mportant consideration for
minimizing gene flow, other factors should also be con-
sidered i n an integrated risk management plan for GM
field trials [40-44].
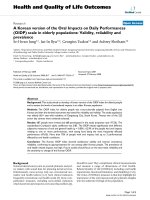
Logarithmic transformation of the cross-pollination
data revealed a linear correlation between mean cross-
pollination over distance at individual sites (data not
provided) as well as combined data over all three sites
(Figure 4). From the linear equation, theoretical isolation
dis tances were calculated to achieve a range of between
<1.0% and 0.1%, <0.1% and 0.01% and <0.01% and
0.001% cross-pollination (Table 1). Based on these data,
45 m is sufficient to minimize cross-pollination to
between <1.0% an d 0.1%, 145 m for <0.1% to 0.01% and
473 m for <0.01% to 0.001%. However, an important
consideration of using mean cross-pollination over
Figure 3 Mean percentage cross-pollination versus distance. Graphical representation of percentage cross-pollination over distance for
Bainsvlei 2005/2006 (R
2
= 0.90; y = 61.043x
-1.842
), Bainsvlei 2006/2007 (R
2
= 0.92; y = 216.91x
-2.036
) and Waterbron 2006/2007 (R
2
= 0.91; y =
293.52x
-2.055
) superimposed by power trend lines with R
2
and equation as indicated.
Figure 4 Correlation between logarithmic combined mean percent age cross-pollination and logarithmic distance. Linear correlation of
logarithmic combined mean percentage cross-pollination (CP) over distance for all three trial sites (R
2
= 0.87; y = -1.9509x + 2.2181). The vertical
error bars on data points represent the standard error of the mean.
Viljoen and Chetty Environmental Sciences Europe 2011, 23:8
/>Page 5 of 8
distance is that the distance required to achieve a speci-
fied threshold of cross-pollination may be underesti-
mated. In order to test this hypothesis, we plotted the
highest values for cross-pollination over distance on a
logarithmic scale. There is a linear correlation of the
logarithmic transformation of high values of cross-polli-
nat ion over distance for individual sites as well as com-
bined data over all three sites (Figure 5). Furthermore,
there was a significant difference between theoretical
isolation distances calculated using the mean versus
high values (P << 0.01) (Table 1). The theoretical isola-
tion distances were also calculated from a combination
of all three datasets using d ifferent confidence intervals
(90%, 95% and 99%) to determine whethe r the use of
high values of cross-pollination would overestimate
cross-pollination and result in greater than the required
isolation distances. However, it was found that the latter
approach did not result in significantly different
isolation distances compared to the use of high values
of cross-pollination (P >> 0.01) (Table 1). Thus, we sug-
gest that in order not to underestimate the potential for
cross-pollination to occur at a predete rmined isolation
distance, the high values instead of mean values of
cross-pollination over distance should be used. Based on
this, a theoretical isolation distance of 135 m is required
to ensure a minimum level of cross-pollination between
<1.0% and 0.1%, 503 m for <0.1% to 0.01% and 1.8 km
for <0.01% to 0.001%. While it may not be required to
apply the most stringent isolation distances for non-GM
or organic production, it should be a requirement where
no commingling can be tolerated, such as GM field
trials under contained use or non-GM seed production
(Table 2). Furthermore , we recognize that under suc h
conditions, an isolation distance of 1.8 km to achieve a
minimum of <0.01% to 0.001% commingling (the limit
of detection for PCR) may not be practical. We there-
fore suggest the combined use of a 3- to 4-week tem-
poral i solation, which includes all maize fields within a
1.8-km radius of the proposed t rial site, with the most
practical distance to achieve a <0.01% threshold of com-
mingling for GM field trials under contained use. In this
study, only one GM pol len source was considered; how-
ever, it would be necessary to calculate the potential
impact of more than one GM pollen source in a com-
mercial farming environment.
We also observed that there was a shift between the
trend lines in Figure 3 for Bainsvlei 2006/2007 and
Waterbron 2006/2007 compared to the trend line for
Bainsvlei 2005/2006. The graphic representation of
mean cross-poll ination over distance compared to high
cross-pollination over distance produced a simi lar result
(data not shown). Based on this observation as well as
the comparison of wind, pollen load and cross-pollina-
tion roses, it appears that pollen load and environmental
factors on their own are not solely responsible in
Table 1 Theoretical isolation distances derived from 1.0%, 0.1%, 0.01% and 0.001% cross-pollination
Percentage
cross-
pollination
Mean
BV06
a
(m)
Mean
BV07
b
(m)
Mean
WB07
c
(m)
Comb
Mean
d
(m)
High
BV06
e
(m)
High
BV07
f
(m)
High
WB07
g
(m)
Comb
high
h
(m)
Mean
i
(90% CI)
j
(m)
Mean
i
(95% CI)
k
(m)
Mean
i
(99% CI)
l
(m)
1.0 9 14 16 14 28 34 40 36 20 19 17
0.1 33 42 50 45 122 129 141 135 125 119 110
0.01 114 126 159 145 530 491 494 503 792 759 694
0.001 398 377 501 473 2298 1861 1739 1869 5041 4861 4386
a
Bainsvlei 2005/2006 (R
2
= 0.90; y = -1.8422x + 1.7856);
b
Bainsvlei 2006/2007 (R
2
= 0.92; y = -2.0359x + 2.3363);
c
Waterbron 2006/2007 (R
2
= 0.91; y = -2.1033x +
2.5423);
d
combined mean cross-pollination across all trial sites (R
2
= 0.95; y = -1.9509x + 2.2181);
e
Bainsvlei 2005/2006 (R
2
= 0.80; y = -1.5652x + 2.2691);
f
Bainsvlei
2006/2007 (R
2
= 0.92; y = -1.7271x + 2.6474);
g
Waterbron 2006/2007 (R
2
= 0.91; y = -1.8318x + 2.9335);
h
combined high cross-pollination across all trial sites (R
2
=
0.97; y = -1.7547x + 2.7405);
i
the datasets were combined and the means calculated with a 90%, 95% and 99% CI, respectively;
j
isolation distances derived from
means from the combined dataset with a 90% CI (R
2
= 0.92; y = -1.2445x + 1.6078);
k
isolation distances derived from means from the combined data with a 95%
CI (R
2
= 0.95; y = -1.2401x + 1.5719);
l
isolation distances derived from means from the combined data with a 99% CI (R
2
= 0.96; y = -1.2493x + 1.55). Theoreti cal
isolation distances (metres) are derived from 1.0%, 0.1%, 0.01% and 0.001% cross-pollination using logarithmic equations for mean cross-pollination and
combined means over distance compared to high cross-pollination over distance for Bainsvlei 2005/2006 (BV06), Bainsvlei 2006/2007 (BV07) and Waterbron
2006/2007 (BV07) (P << 0.01). The theoretical isolation distances were also calcu lated after combining the data sets from means with a 90%, 95% and 99%
confidence interval (CI), respectively.
Figure 5 Comparison of perce ntage mean cross-pollination to
percentage high cross-pollination. Linear correlation of
logarithmic combined mean percentage cross-pollination (CP) (big
squares - lower line) over distance for all three trial sites compared
to the linear correlation of logarithmic percentage high cross-
pollination (small squares - top line) over distance (R
2
= 0.83; y =
-1.7547x + 2.7405).
Viljoen and Chetty Environmental Sciences Europe 2011, 23:8
/>Page 6 of 8
determining cross-pollination potentia l. We hypothesise
that reproductive physiol ogical factor s are also involved.
Although the dynamics of such an interaction is cur-
rently unknown, we suggest that cross-pollination is a
result o f the interaction between pollen load, the envir-
onment and reproductive physiology:
Cross-pollination ¬ Pollen load ○ Environment ○
Reproductive physiology
Conclusions
In this study, we have investigated the effect of pollen
load and environment on cross-poll ination under typical
maize growing conditions in South Africa. We have also
compared mean cross-pollination to high cross-
pollination values over distance i n order to calculate
isolation distances for predetermined thresholds of com-
mingling. Mean cross-pollination data may be sufficient
to determine isolation distances where commingling is
allowable at a specific threshold, for example, non-GM
production. However, to achieve zero commingling for
non-GM seed production, or GM field trials under con-
tained use, a more stringent approach through the use of
greater isolation distances based on high compared to
mean cross-pollination may be required. While this may
not be practical under all conditions, it would be possible
to achieve maximum stringency through the combined
use of temporal and distance isolations, taking into
account the GM maize fields within the radius of the
most stringent isolation distance required. Finally, com-
paring the results of this study to others, it is evident that
while the overall trends may be similar between different
cross-pollination studies, geographic specific data are
required to establish isolation distances for a specific
region.
Acknowledgements
We would like to acknowledge funding support from the National Research
Foundation and the Centre of Excellence for Invasion Biology, as well as the
GMO Testing Facility for providing a research platform and funding. We are
grateful to Pannar for advice in seed selection and the use of facilities at
Bainsvlei as well as Charl van Deventer for the facilities at Waterbron. We are
also thankful to the students associated with the GMO Testing Facility who
help with sample collection.
Author details
1
GMO Testing Facility, Department of Haematology and Cell Biology,
University of the Free State, Bloemfontein, South Africa
2
GMO Monitoring
and Research, Applied Biodiversity Research, South African National
Biodiversity Institute, Pretoria, South Africa
Authors’ contributions
CV conceived the study and participated in its design and implementation,
final data analysis and draft and final manuscript preparation. LC participated
in the design of the study, data collection and analysis, primary data analysis
and draft manuscript preparation.
Competing interests
The authors declare that they have no competing interests.
Received: 15 October 2010 Accepted: 24 February 2011
Published: 24 February 2011
References
1. Department of Agriculture: Understanding genetically modified
organisms (GMOs). 2005 [], accessed 3 October
2005.
2. James C: Global status of commercialized biotech/GM crops: 2009. ISAAA
Briefs no. 41. Ithaca, NY: International service for the acquisition of Agri-
biotech applications; 2009.
3. Department of Agriculture, Forestry and Fisheries: Genetically modified
organisms Act, 1997. Annual Report 2008/09. 2009 [ic.
za], accessed 4 January 2010.
4. Moschini G: Pharmaceutical and industrial traits in genetically modified
crops: coexistence with conventional agriculture. Am J Agr Econ 2006,
88:1184-1192.
5. Europa: Coexistence of genetically modified crops with conventional and
organic agriculture. European Commission. 2009 [ />agriculture/gmo/coexistence/index_en.htm], accessed 21 April 2010.
6. Quist D, Chapela IH: Transgenic DNA introgressed into traditional maize
landraces in Oaxaca, Mexico. Nature 2001, 414:541-543.
7. Reichman JR, Watrud LS, Lee EH, Burdick CA, Bollman MA, Storm MJ,
King GA, Mallory-Smith C: Establishment of transgenic herbicide-resistant
creeping bentgrass (Agrostis stolonifera L.) in nonagronomic habitats.
Mol Ecol 2006, 15:4243-4255.
8. Elbehri A: Biopharming and the food Systems: examining the potential
benefits and risks. AgBioForum 2005, 8:18-25.
9. Segarra AE, Rawson JM: Starlink corn controversy: background. CRS
report for Congress. 2001 [ />RS20732.pdf], accessed 21 April 2010.
10. FDA: Statement on report of bioengineered rice in the food supply.
CFSAN/Office of Food Additive Safety, August 2006. 2006 [http://www.
fda.gov/Food/Biotechnology/Announcements/ucm109411.htm], accessed 21
April 2010.
11. Belcher K, Nolan J, Phillips PWB: Genetically modified crops and
agricultural landscapes: spatial patterns of contamination. Ecological
Economics 2005, 53:387-401.
Table 2 Summary of isolation distances based on mean versus high cross-pollination where applicable to non-GM or
organic crop production as well as GM field trials and non-GM seed production (X)
% GM threshold <1.0 to 0.1 <0.1 to 0.01 <0.01 to 0.001
Distance range (m) 14-45 (mean)
a
36-135 (high)
b
45-145 (mean) 135-503 (high) 145-473 (mean) 503-1869 (high)
Non-GM
c
XX X
Organic
c
XX X
GM field trials X
Non-GM seed production X
a
Isolation distances based on mean cross-pollination;
b
isolation distances based on high cross-pollination;
c
required % threshold may differ between different
coexistence systems.
Viljoen and Chetty Environmental Sciences Europe 2011, 23:8
/>Page 7 of 8
12. Brookes G, Barfoot P, Melé E, Messeguer J, Bénétrix F, Bloc D, Foueillassar X,
Fabié A, Poeydomenge C: Genetically modified maize: pollen movement
and crop coexistence. 2004 [ />Maizepollennov2004final.pdf], accessed 6 January 2011.
13. Jank B, Rath J, Gaugitsch H: Co-existence of agricultural production
systems. Trends in Biotechnology 2006, 24(5):198-200.
14. Moschini G, Bulut H, Cembalo L: On the segregation of genetically
modified, conventional and organic products in European agriculture: a
multi-market equilibrium analysis. J Agr Econ 2005, 3:347-372.
15. Schiemann J: Co-existence of genetically modified crops with
conventional and organic farming. Environ Biosafety Res 2003, 2:213-217.
16. Huffman WE: Production, identity preservation, labelling in a marketplace
with genetically modified and non-genetically modified foods. Plant
Physiol 2004, 134:3-10.
17. Arritt RW, Clark CA, Goggi AS, Sanchez HL, Westgate ME, Riese JM:
Lagrangian numerical simulations of canopy air flow effects on maize
pollen dispersal. Field Crop Res 2007, 102:151-162.
18. Aylor DE: Survival of maize (Zea mays) pollen exposed in the
atmosphere. Agr Forest Meteorol 2004, 123:125-133.
19. Fonesca AE, Westgate ME, Doyle RT: Application of fluorescence
microscopy and image analysis for quantifying dynamics of maize
pollen shed. Crop Sci 2002, 42:2201-2206.
20. Fricke BA, Ranjan AK, Bandyopadhyay D, Becker B: Numerical simulation of
genetically modified corn pollen flow. The Official Journal of ISPE 2004,
24(3):1-7.
21. Jarosz N, Loubet B, Durand B, McCartney A, Foueillassar X, Huber L: Field
measurements of airborne concentration and deposition rate of maize
pollen. Agr Forest Meteorol 2003, 119:37-51.
22. Kerhoas C, Gay G, Dumas C: A multidisciplinary approach to the study of
the plasma membrane of Zea mays pollen during controlled
dehydration. Planta 1987, 171:1-10.
23. Raynor SG, Ogden EC, Hayes JV: Dispersion and deposition from
experimental sources. Agron J 1972, 64:420-427.
24. Roy SK, Rahaman SML, Salahuddin ABM: Pollination control in relation to
seed yield and effect of temperature on pollen viability of maize (Zea
mays L.). Indian J Agric 1995, 65:785-788.
25. Schoper JB, Lambert RJ, Vasilas BL: Pollen viability, pollen shedding, and
combining ability for tassel heat tolerance in maize.
Crop Sci 1987,
27:27-31.
26. Schoper JB, Lambert RJ, Vasilas BL, Westgate ME: Plant factors
controlling see d set in maize. The influence of silk, pollen, and ear-leaf
water status and tassel heat treatm ent at pollination. Plant Physiol
1987, 83:121-125.
27. Aylor DE, Schultes NP, Shields EJ: An aerobiological framework for
assessing cross-pollination in maize. Agr Forest Meteorol 2003, 119:111-129.
28. Bannert M, Stamp P: Cross-pollination of maize at long distance. Eur J
Agron 2007, 27:44-51.
29. Burris JS: Adventitious pollen intrusion into hybrid maize seed
production fields. Proceedings of 56th Annual Corn and Sorghum Research
Conference 2001 American Seed Trade Association, Washington, DC; 2001.
30. Byrne PF, Fromherz S: Can GM and non-GM crops coexist? Setting a
precedent in Boulder County, Colorado, USA. J Food Agr Environ 2003,
1:258-261.
31. Della Porta G, de Ederle D, Bucchini L, Prandi M, Verderio A, Pozzi C: Maize
pollen mediated gene flow in the Po valley (Italy): Source-recipient
distance and effect of flowering time. Eur J Agron 2008, 28:255-265.
32. Garcia MC, Figueroa JM, Gomez RL, Townsend R, Schoper J: Pollen control
during transgenic hybrid maize development in Mexico. Crop Sci 1998,
38:1597-1602.
33. Henry C, Morgan D, Weekes R, Daniels R, Boffey C: Farm scale evaluations
of GM crops: monitoring gene flow from GM crops to non GM
equivalents in the vicinity: Part one forage maize, DEFRA report EPG/1/
5/138. 2003 [ />estudos_cientificos_ambiental_14.pdf], accessed 21 April 2010.
34. Jemison JM, Vayda ME: Cross-pollination from genetically engineered
corn: wind transport and seed source. AgBioForum 2001, 4:87-92.
35. Luna SV, Figueroa JM, Baltazar BM, Gomez RL, Townsend R, Schoper JB:
Maize pollen longevity and distance isolation requirements for effective
pollen control. Crop Sci 2001, 41:1551-1557.
36. Ma BB, Subedi KD, Reid LM: Extent of cross fertilization in maize by
pollen from neighbouring transgenic hybrids. Crop Sci 2004,
44:1273-1282.
37. Paterniani E, Stort AC: Effective maize pollen dispersal in the field.
Euphytica 1974, 23:129-134.
38. Stevens WE, Berberich SA, Sheckell PA, Wiltse CC, Halsey Horak MJ,
Dunn DJ: Optimizing pollen confinement in maize grown for regulated
products. Crop Sci 2004, 44:2146-2153.
39. Eastham K, Sweet J: Genetically modified organisms (GMOs): the
significance of gene flow through pollen transfer. Environ Issues Rep 2002,
28:1-75.
40. Andow DA, Zwahlen C: Assessing environmental risks of transgenic
plants.
Ecol Lett 2006, 9:196-214.
41. Jenczewski E, Ronfort J, Chèvre AM: Crop-to-wild gene flow, introgression
and possible fitness effects of transgenes. Environ Biosafety Res 2003,
2:9-24.
42. König A, Cockburn A, Crevel RWR, Debruyne E, Grafstroem R,
Hammerling U, Kimber I, Knudsen I, Kuiper HA, Peijnenburg AACM,
Penninks AH, Poulsen M, Schauzu M, Wal JM: Assessment of the safety of
food derived from genetically modified (GM) crops. Food and Chemical
Toxicology 2004, 42:1047-1088.
43. Nap JP, Metz PLJ, Escaler M, Conner AJ: The release of genetically
modified crops into the environment. Part I. Overview of current status
and regulations. The Plant Journal 2003, 33:1-18.
44. Devos Y, Reheul D, De Schrijver A: The co-existence between transgenic
and non-transgenic maize in the European Union: a focus on pollen
flow and cross-fertilization. Environ Biosafety Res 2005, 4:71-87.
doi:10.1186/2190-4715-23-8
Cite this article as: Viljoen and Chetty: A case study of GM maize gene
flow in South Africa. Environmental Sciences Europe 2011 23:8.
Submit your manuscript to a
journal and benefi t from:
7 Convenient online submission
7 Rigorous peer review
7 Immediate publication on acceptance
7 Open access: articles freely available online
7 High visibility within the fi eld
7 Retaining the copyright to your article
Submit your next manuscript at 7 springeropen.com
Viljoen and Chetty Environmental Sciences Europe 2011, 23:8
/>Page 8 of 8