Báo cáo hóa học: " Research Article The Extended-OPQ Method for User-Centered Quality of Experience Evaluation: A Study for Mobile 3D Video Broadcasting over DVB-H" potx
Bạn đang xem bản rút gọn của tài liệu. Xem và tải ngay bản đầy đủ của tài liệu tại đây (6.99 MB, 24 trang )
Hindawi Publishing Corporation
EURASIP Journal on Image and Video Processing
Volume 2011, Article ID 538294, 24 pages
doi:10.1155/2011/538294
Research Ar ticle
The Extended-OPQ Method for User-Centered
Quality of Experience Evaluation: A Study for Mobile
3D Video Broadcasting over DVB-H
Dominik Strohmeier,
1
Satu Jumisko-Pyykk
¨
o,
2
Kristina Kunze,
1
and Mehmet Oguz Bici
3
1
Institute for Media Technology, Ilmenau University of Technology, 98693 Ilmenau, Germany
2
Unit of Human-Centered Technology, Tampere University of Technology, 33101 Tampere, Finland
3
Department of Electrical and Electronics Engineering, Middle East Technical University, 06531 Ankara, Turkey
Correspondence should be addressed to Dominik Strohmeier,
Received 1 November 2010; Accepted 14 January 2011
Academic Editor: Vittorio Baroncini
Copyright © 2011 Dominik Strohmeier et al. This is an open access article distributed under the Creative Commons Attribution
License, which permits unrestricted use, distribution, and reproduction in any medium, provided the original work is properly
cited.
The Open Profiling of Quality (OPQ) is a mixed methods a pproach combining a conventional quantitative psychoperceptual
evaluation and qualitative descriptive quality evaluation based on na
¨
ıve participants’ individual vocabulary. The method targets
evaluation of heterogeneous and multimodal stimulus material. The current OPQ data collection procedure provides a rich pool
of data, but full benefit of it has neither been taken in the analysis to build up completeness in understanding the phenomenon
under the study nor has the procedure in the analysis been probed with alternative methods. The goal of this paper is to extend the
original OPQ method with advanced r esearc h methods that have become popular in related research and the component model
to be able to generalize individual attributes into a terminology of Quality of Experience. We conduct an extensive subjective
quality evaluation study for 3D video on mobile device with heterogeneous stimuli. We vary factors on content, media (coding,
concealments, and slice modes), and transmission levels (channel loss rate). The results showed that advanced procedures in the
analysis cannot only complement each other but also draw deeper understanding on Quality of Experience.
1. Introduction
Meeting the requirements of consumers and providing them
a greater quality of experience than existing systems do is
a key issue for the success of modern multimedia systems.
However, the question about an optimized quality of expe-
rience becomes more and more complex as technological
systems are evolving and several systems are merged into
new ones. Mobile3DTV combines 3DTV and mobileTV,
both being emerging technologies in the area of audiovisual
multimedia systems. The term 3DTV thereby refers to
the whole value chain from image capturing, encoding,
broadcasting, reception, and display [1 , 2]. In our approach,
we extend this chain with the users as the end consumers
of the system. The user, his needs and expectations, and his
perceptual abilities play a key role for optimizing t he quality
of the system Mobile3DTV.
The challenges for modern quality evaluations grow in
parallel to the increasing complexity of the systems under
test. Multimedia quality is characterized by the relationship
between produced and perceived quality. In recent years, this
relationship has been described in the concept of Quality of
Experience (QoE). By definition, QoE is “the overall accept-
ability of an application or service, as perceived subjectively
by the end-user”[3] or more broadly “a multidimensional
construct of user perceptions and behaviors” as summarized by
Wu et al. [4]. While produced quality relates to the quality
that is provided by the system being limited by its constraints,
perceived quality describes t he users’ or consumers’ view of
multimedia quality. It is characterized by active perceptual
processes, including both bottom-up, top-down, and low-
level sensorial and high-level cognitive processing [5].
Especially, high-level cognitive processing has become
an important aspect in modern q uality evaluation as it
2 EURASIP Journal on Image and Video Processing
involves individual emotions, knowledge, expectations, and
schemas representing reality which can weight or modify the
importance of each sensory attribute, enabling contextual
behavior and active quality interpretation [5–7]. To be able
to measure possible aspects of high-level quality processing,
new research methods are required in User-Centered Quality
of Experience (UC-QoE) e valuation [1, 8]. UC-QoE aims
at relating the quality e valuation to the potential use (users,
system characteristics, context of use). The goal of the UC-
QoE approach is an extension of existing research met hods
with new approaches into a holistic research framework
to gain high external validity and realism in the studies.
Two key aspects are outlined within the U C-QoE approach.
While studies in the actual context of use target an increased
ecological validity of the results of user studies [9], the
Open Profiling of Quality approach [10]aimsateliciting
individual quality factors t hat deepen the knowledge about
an underlying quality rationale of QoE.
In recent studies, the UC-QoE approach has been applied
to understand and optimize the Quality of Experience of the
Mobile3DTV system. Along the value chain of the system,
different heterogeneous artifacts are created that arise due
to limited bandwidth or device-dependent quality factors
like display size or 3D technology, for example. Boev et al.
[11] presented an artifact classification scheme for mobile
3D devices that t akes into account the production chain
as well as the human visual system. However, there is no
information about how these artifacts impact on users’
perceived quality.
Quality of Experience of mobile 3D video was assessed
at different stages of the production chain, but altogether,
studies are still rare. Strohmeier and Tech [12, 13]focused
on the selection of an optimum coding method for mobile
3D video systems. They compared different coding methods
and found out that Multiview Video Coding (MVC) and
Video + Depth get the best results in terms of overall quality
satisfaction [13]. In addition, they showed that advanced
codec structures like hierarchical-B pictures provide similar
quality as common structures, but can reduce the bit rate of
the content significantly [12].
The difference between 2D and 3D presentation of
content was assessed by Strohmeier et al. [14]. They com-
pared audiovisual videos that were presented in 2D and 3D
and showed that the presentation in 3D did not mean an
identified added value as often predicted. According to their
study, 3D was mostly related to descriptions of artifacts.
Strohmeier et al. conclude that an artifact-free presentation
of content is a key factor for the success of 3D video as it
seems to limit the perception of an added value as a novel
point of QoE in contrast to 2D systems.
At the end, 3D systems must outperform current 2D sys-
tems to become successful. Jumisko-Pyykk
¨
o and Utriainen
[9]compared2Dversus3Dvideoindifferent contexts of
use. Their goal is to get high external validity of the results
of comparable user studies by identifying the influence of
contexts of use on quality requirements for mobile 3D
television.
In this paper, we present our work on evaluating the
Quality of Experience for different transmission settings
of mobile 3D video b roadcasting. The goal of the paper
thereby is twofold. First, we show how to extend the OPQ
approach in terms of advanced methods of data analysis to
be able to get more detailed knowledge about the quality
rationale. Especially, the extension of the component model
allows creating more general classes from the individual
quality factors that can be used to communicate results
and suggestions for system optimization to the development
department. Second, we apply the extended approach in a
case study on mobile 3D video transmission. Our results
show the impact of different settings like coding method,
frame error rate, or error protection strategies on the
perceived quality of mobile 3D v ideo.
The paper is organized as follows. In Section 2,we
describe existing research methods and review Quality of
Experience factors related to mobile 3D video. Section 3
presents the current OPQ approach as well as the suggested
extensions. The research method of the study is presented in
Section 4 and its results in Section 5. Section 6 discusses the
results of the Extended OPQ approach and finally concludes
the paper.
2. Research Methods for Quality of
Experience Evaluation
2.1. Psychoperceptual Evaluation Methods. Psychoperceptual
quality evaluation is a method for examining the relation
between physical stimuli and sensorial experience following
the methods of experimental research. It has been derived
from classical psychophysics and has been later applied in
unimodal and multimodal quality assessment [15–18]. The
existing psychoperceptual methods for audiovisual q uality
evaluation are standardized in technical recommendations
by the International Telecommunication Union (ITU) or the
European Broadcasting Union ( EBU) [17–19].
The goal of psychoperceptual evaluation methods is to
analyze quantitatively the excellence of perceived quality of
stimuli in a test situation. As an outcome, subjective quality
is expressed as an affective degree-of-liking using mean
quality satisfaction or opinion scores (MOS). A common
key requirement of the different existing approaches is the
control over the variables and test circumstances.
The ITU recommendations or other standards offer a
set of very different methods (for a review see [20]), among
which Absolute Category Rating (ACR) is one of the most
common methods. It includes a one-by-one presentation of
short test sequences at a time t hat are then rated indepen-
dently and retrospectively using a 5/9/11-point scale [18].
Current studies have shown that ACR has outperformed
other evaluation methods in the domain of multimedia
quality evaluation [21, 22].
Recently, conventional psychoperceptual methods have
been extended fr om hedonistic assessment towards mea-
suring quality as a multidimensional construct of cogni-
tive information assimilation or satisfaction constructed
from enjoyment and subjective, but content-independent
objective quality. Additional evaluations of the acceptance of
quality act as an indicator of service-dependent minimum
EURASIP Journal on Image and Video Processing 3
Table 1: Descriptive quality evaluation methods and their characteristics for multimedia quality evaluation.
Methodological approach Interview-based approach Sensory profiling
Vocabulary Elicitation
(Semistructured) Interview; can be assisted by
additional task like percepti ve free sorting
Consensus attributes: Group discussions;
Individual attributes: Free-Choice Profiling; can
be assisted by additional task like Repertory Grid
Method
(Statistical) Analysis
Open coding (e.g., Grounded Theory) and
Interpretation
GPA, PCA
Participants 15 or more na
¨
ıve test participants Around 15 na
¨
ıve test participants
Monomethodolgical
approach in multimedia
quality e valuation
—RaPID[23], ADAM [24], IVP [25, 26]
Mixed methods in
multimedia quality
research
IBQ [27, 28], Experienced Qualit y Factors [29]OPQ[10]
[30–33](seeoverviewin[20]). Furthermore, psychopercep-
tual evaluations are also extended from laboratory settings to
evaluation in the natural contexts of use [9, 34–37]. However,
all quantitative approaches lack the possibility to study the
underlying quality rationale of the users’ quality perception.
2.2. Descriptive Quality Evaluation and Mixed Method
Approaches. Descriptive qualit y evaluation approaches focus
on a qualitative evaluation of perceived quality. They aim
at studying the underlying individual qualit y factors that
relate to the quantitative scores obtained by psychoper-
ceptual evaluation. In general, these approaches extend
psychoperceptual evaluation in terms of mixed methods
research which is generally defined as the class of research
in which the researcher mixes or combines quantitative
and qualitative research techniques, methods, approaches,
concepts, or language into a single study [38] (overview
in [10]). In the domain of multimedia quality evaluation,
different mixed method research approaches can be found.
Related to mixed method approaches in audiovisual quality
assessment, we identified two main approaches that differ
in the applied descriptive methods and the related methods
of analysis: (1) interview-basedapproachand(2)sensory
profiling (Table 1 ).
2.2.1. I nterview-Based Evaluation. Interview-based approach-
es target an explicit description of the characteristics of stim-
uli, their degradations, or personal quality evaluation criteria
under free-description or stimuli-assisted description tasks
by na
¨
ıve participants [9, 29, 37, 39]. The goal of these
interviews is the generation of terms to describe the quality
and to check that the test participants perceived and rated
the intended quality aspects. Commonly, semistructured
interviews are applied as they are applicable to relatively
unexplored research topics, constructed from main and
supporting questions. In addition, they are less sensitive
to interviewer effects compared to open interviews [40].
The framework of data-driven analysis is applied and the
outcome is described in the terms of the most commonly
appearing characteristics [27, 29, 41, 42].
Interview-based approaches are used in the mixed
method approaches of Experienced Quality Factors and
Interpretation-based Quality. The Experienced Quality Fac-
tors approach combines standardized psychoperceptual eval-
uation and posttask semistructured interviews. The descrip-
tive data is analyzed following the framework of Grounded
Theory. Quantitative and qualitative results are finally first
interpreted separately and then merged to support each
other’s conclusions. In the Interpretation-based Quality
approach, a classification task using free-sorting and an
interview-based description task are used as extensions of
the psychoperceptual evaluation. Na
¨
ıve test participants first
sort a set of test stimuli into groups and then describe the
characteristics of each group in an interview. Extending the
idea of a free-sorting task, IBQ allows combining preference
and description data in a mixed analysis to better understand
preferences and the underlying quality factors in a level of a
single stimulus [27].
2.2.2. Sensory Profiling. In sensory profiling, research meth-
ods are used to “evoke, measure, analyze, and interpret
people’s reaction to products based on the senses” [16].
The goal of sensory evaluation is that test participants
evaluate perceived quality with the help of a set of quality
attributes. All methods assume that perceived quality is the
result of a combination of several attributes and that these
attributes can be rated by a panel of test participants [15, 23
,
43]. In user-centered quality evaluation methods, individual
descriptive methods adapting Free-Choice profiling are
used as these methods are applicable to use with na
¨
ıve
participants.
Lorho’s Individual Profiling Method (IVP) was the first
approach in multimedia quality assessments to use individ-
ual vocabulary from test participants to evaluate quality. In
IVP, test participants create their individual quality factors.
Lorho applied a Repertory Grid Technique as an assisting
task to facilitate the elicitation of qualit y factors. Each
unique set of attributes is then used by the relating test
participant to evaluate quality. The data is analyzed through
hierarchical clustering to identify underlying groups among
all attributes and Generalized Procrustes Analysis [44]to
4 EURASIP Journal on Image and Video Processing
develop perceptual spaces of quality. Compared to consensus
approaches, no previous discussions and training of the
test participants is required, and studies have shown that
consensus and individual vocabular y approaches lead to
comparable results [45].
Although the application of sensory profiling had seemed
promising for the evaluation of perceived multimedia quali-
ty,nomixedmethodswereexistingthatcombinedthesen-
sory attributes with the data of psychoperceptual e valuation.
Our Open Profiling of Q uality approach [10] closed this
shortcoming. It will be described in detail in Section 3.
2.3. Fixed Vocabulary for Communication of Quality Factors.
In contrast to individual descriptive methods, fixed vocabu-
lary approaches evaluate perceived quality based on a prede-
fined set of quality factors. In general, this fixed vocabulary
(also objective language [46], lexicon [47], terminology [48],
or consensus vocabulary [49]) is regarded as a more effective
way of communicating research results between the quality
evaluators and other parties (e.g., development, marketing)
involved in the development process of a product [46]
compared to individual quality factors. Lexicons also allow
direct comparison of different studies or easier correlation
of results with other data sets like instrumental measures
[50].
Vocabularies include a list of quality attributes to describe
the specific characteristics of the product to which they refer.
Furthermore, these quality attributes are usually structured
hierarchically into categories or broader classes of descrip-
tors. In addition, vocabularies provide definitions or refer-
ences for each of the quality attributes [46, 47]. Some termi-
nologies in the field of sensory evaluation have become very
popular as they allowed defining a common understanding
about underlying quality structures. Popular examples are
the wine aroma wheel by Noble et al. [48] or Meilgaard et al.’s
beer aroma wheel [51] which also show the common wheel
structure to organize the different quality terms.
A fixed vocabulary in sensory evaluation needs to satisfy
different quality aspects that were introduced by Civille and
Lawless [50]. Especially the criteria of discrimination and
nonredundancy need to be fulfilled so that each quality
descriptor has no overlap with another term. While sensory
evaluation methods like Texture Profile [52]orFlavour
Profile (see [53]) apply vocabularies that have been defined
by the chosen and defined by underlying physical or chemical
properties of the product, Quantitative Descriptive Analysis
(QDA) (see [43]) makes use of extensive group discussions
and training of assessors to develop and sharpen the meaning
of the set of quality factors.
Relating to audiovisual quality evaluations, Bech and
Zacharov [49] provide an overview of existing quality
attributes obtained in several descriptive analysis studies.
Although these attributes show common structures, Bech
and Zacharov outline that they must be regarded highly
application specific so that they cannot be regarded as a
terminology for audio quality [49]. A consensus vocabulary
for video quality evaluation was developed in Bech et al.’s
RaPID approach [23]. RaPID adapts the ideas of QDA and
uses extensive group discussions in which experts develop
a consensus vocabulary of quality attributes for image
quality. The attributes are then refined in a second round of
discussions where the panel then agrees about the important
attributes and the extremes of intensity scale for a specific test
according to the test stimuli available.
Following we present our Extended Open Profiling of
Quality (Ext-OPQ) approach. Originally, OPQ has been
developed as a mixed method evaluation method to study
audiovisual quality perception. The Ext-OPQ approach
further develops the data analysis and introduces a way to
derive a terminology for Quality of Experience in mobile 3D
video applications.
3. The Open Profiling of Quality Approach
3.1. The Open Profiling of Quality (OPQ) Approach. Open
Profiling of Quality (OPQ) is a mixed method that combines
the evaluation of quality preferences and the elicitation of
idiosyncratic experienced quality factors. It therefore uses
quantitative psychoperceptual evaluation and, subsequently,
an adaption of Free Choice Profiling. The Open Profiling
of Quality approach is presented in detail in [10]. OPQ
targets an overall quality evaluation which is chosen to
underline the unrestricted evaluation as it is suitable to
build up the global or holistic judgment of quality [49].
It assumes that both stimuli-driven sensorial processing
and high-level cognitive processing including knowledge,
expectations, emotions, and attitudes are integrated into the
final quality perception of stimuli [16, 29, 49]. In addition,
overall quality evaluation has shown to be applicable to
evaluation tasks with na
¨
ıve test participants [16]andcan
easily be complemented with other evaluations tasks like
the evaluation of quality acceptance threshold [35]. The
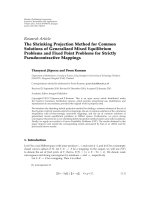
original Open Profiling of Quality approach consists of
three subsequent parts: (1) psychoperceptual evaluation, (2)
sensory profiling, and (3) external preference mapping. In
the Ext-OPQ, the component model is added as a fourth
part.
3.1.1. Psychoperceptual Evaluation. The goal of the psychop-
erceptual evaluation is to assess the degree of excellence
of the perceived overall q uality for the set of test stimuli.
The psychoperceptual e valuation of the OPQ approach
is based on the standardized quantitative methodological
recommendations [17, 18]. The selection of the appropriate
method needs to be based on the goal of the study and the
perceptual differences between stimuli.
A psychoperceptual evaluation consists of training and
anchoring and the evaluation task. While in training and
anchoring test participants familiarize themselves with the
presented q ualities and contents used in the experiment as
well as with the data elicitation method in the evaluation
task, the evaluation task is the data collection according to
the selected research method. The stimuli can be evaluated
several times and in pseudo-randomized order to avoid bias
effects.
EURASIP Journal on Image and Video Processing 5
The quantitative data can be analyzed using the Analysis
of Variance (ANOVA) or its comparable non-parametric
methods if the presumptions of ANOVA are not fulfilled
[40].
3.1.2. Sensory Profiling. The goal of the sensory profiling
is to understand the characteristics of quality perception
by collecting individual quality attributes. OPQ includes
an adaptation of Free Choice Profiling (FCP), originally
introduced by Williams and Langron in 1984 [54]. The
sensory profiling task consists of four subtasks called (1)
introduction, (2) attribute elicitation, (3) attribute refine-
ment, and (4) sensory evaluation task.
The first three parts of the sensory profiling all serve
the development of the individual attributes and therefore
play an important role for the quality of the study. Only
attributes generated during these three steps will be used
for evaluation and data analysis later. The introduction
aims at training participants to explicitly describe quality
with their own quality attributes. These quality attributes
are descriptors (preferably adjectives) for the characteristics
of the stimuli in terms of perceived sensory quality [16].
In the following attribute elicitation test participants then
write down individual quality attributes that characterize
their quality perception of the different test stimuli. In the
original Free Choice Profiling, assessors write down their
attributes without limitations [54]. As only strong attributes
should be taken into account for the final evaluation to
guarantee for an accurate profiling, the Attribute refinement
aims at separating these from all developed attributes. A
strong attribute refers to a unique quality characteristic of
the test stimuli, and test participants must be able to define
it precisely. The final set of attributes is finally used in
the evaluation task to collect the sensory data. Stimuli are
presented one by one, and the assessment for each attribute is
marked on a line with the “min.” and “max.” in its extremes.
“Min.” means that the attribute is not perceived at all while
“max.” refers to its maximum sensation.
To be able to analyze these configurations, they must be
matched according to a common basis, a consensus con-
figuration. For this purpose, Gower introduced Generalized
Procrustes Analysis (GPA) in 1975 [44].
3.1.3. External Preference Mapping. The goal of the External
Preference Mapping (EPM) is to combine quantitative
excellence and sensory profiling data to construct a link
between preferences and quality construct.
In general, External Preference Mapping maps the par-
ticipants’ preference data into the perceptual space and so
enables the understanding of perceptual preferences by sen-
sory explanations [55, 56]. In the Open Profiling of Quality
studies PREFMAP [56] has been used to conduct the EPM.
PREFMAP is a canonical regression method that uses the
main components from the GPA and conducts a regression
of the preference data onto these. This allows finally linking
sensory characteristics and t he quality preferences of the test
stimuli.
3.2. The Extended Open Profiling of Quality Approach
3.2.1. Multivariate Data Analysis
(Hierarchical) Multiple Factor Analysis. Multiple Factor
Analysis is a method of multivariate data analysis that studies
several groups of variables describing the same test stimuli
[57, 58] which has been applied successfully in the analysis
of sensory profiling data [59]. Its goal is a superimposed
representation of the different groups of variables. This goal
is comparable to that of Generalized Procrustes Analysis
(GPA) which has commonly been used in Open Profiling
of Quality. The results of MFA and GPA have shown to be
comparable [60]. The advantage of MFA in the analysis of
sensory data is its flexibility. In MFA, a Principal Component
Analysis is conducted for every group of variables. The data
within each of these groups must be of the same kind, but
can differ among the different groups. This allows taking into
account additional data sets. In sensory analysis, these data
sets are often objective metrics of the test stimuli that are
included in the MFA [57, 61].
The approach of MFA has been extended to Hierarchical
Multiple Factor Analysis (HMFA) by Le Dien and Pag
`
es
[62]. HMFA is applicable to datasets which are organized
hierarchically. Examples of application of HMFA in sensory
analysis are the comparison of the results of different sensory
research methods, sensory profiles of untrained assessors and
experts, or the combination of subjective and objective data
[62–64].
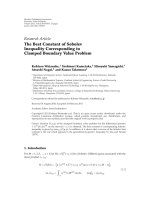
In our approach, we apply HMFA to investigate the
role of content on the sensory profiles. As test content has
been found to be a crucial quality parameter in previous
OPQ studies, HMFA results are able to v isualize this effect.
Commonly, a test set in quality evaluation consists of a
selection of test parameters that are applied to different test
contents. This combination leads to a set of test items. HMFA
allows splitting this parameter-content-combination in the
analysis which leads to a hierarchical structure in the dataset
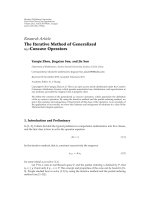
(Figure 1).
Partial Least Square Regression. Partial Least Square Regres-
sion [65, 66] (PLS, a.k.a. projection on latent structures)
is a multivariate regression analysis which tries to analyze
a set of dependent variables from a set of independent
predictors. In sensory analysis, PLS is used as a method
for the External Preference Mapping [67]. The goal is
to predict t he preference (or hedonic) r atings of the test
participants, obtained in the psychoperceptual evaluation
in OPQ, from the sensory characteristics of the test items,
obtained in the sensory evaluation of OPQ. The common
method to conduct an EPM in the OPQ approach has been
thePREFMAProutine[55, 56]. The critics in PREFMAP
are that the space chosen for the regression does not
represent the variability of the preference data. PREFMAP
performs a regression of the quantitative data on the space
obtained from the analysis of the sensory data set. The
advantage of applying PLS is that it looks for components
(often referred as latent vectors T) that are derived from a
simultaneous decomposition of both data sets. PLS thereby
6 EURASIP Journal on Image and Video Processing
Quality evaluation
Test content 1
Test content 2
Test content n
···
······
··· ··· ··· ··· ··· ··· ··· ··· ···
Test participant 1
Test participant 2
Test participant m
···
Test participant 1
Test participant 2
Test participant m
···
Test participant 1
Test participant 2
Test participant m
Test items
Attributes
Figure 1: The principle of a hierarchical s tructure in test sets of audiovisual quality evaluation.
applies an asymmetrical approach to find the latent structure
[65]. The latent structure T of the PLS is a result of the
task to predict the preferences Y from the sensory data
X. T would not be the same for a prediction of X from Y .
The PLS approach allows taking into account both hedonic
and sensory characteristics of the test items simultaneously
[65, 66]. As a result of the PLS, a correlation plot can be
calculated. This correlation plot presents the correlation of
the preference ratings and the correlation of the sensory
data with the latent vectors. By applying a dummy variable,
even the test items can be added to the correlation plot.
This correlation plot refers to the link between hedonic
and sensory data that is targeted in External Preference
Mapping.
3.2.2. Component Model. The component model is a qual-
itative data extension that allows identifying the main
components of Quality of Experience in the OPQ study. One
objection to the OPQ approach has been that it lacks of the
creation of a common vocabulary. In fact, OPQ is a suitable
approach to investigate and model individual experienced
quality factors. What is missing is a higher level description
ofthesequalityfactorstobeabletocommunicatethemain
impacting factors to engineers or designers.
The component model extends OPQ with a fourth step
and makes use of data that is collected during the OPQ test
an yway (Figure 2). Within the attribute refinement task of
the sensory evaluation, we conduct a free definition task.
The task completes the attribute refinement. Test participants
are asked to define each of their idiosyncratic attributes. As
during the attribute elicitation, they are free to use their own
words. The definition must make clear what an attribute
means. In addition, we asked the participants to define
a minimum and a maximum v alue of the attribute. Our
experience has shown that this task is rather simple for the
test participants compared to the attribute elicitation. After
the attribute refinement task, they were all able to define their
attributes very precisely.
Collecting definitions of the individual attributes is not
new within the existing Free-Choice profiling approaches.
However, the definitions have only ser ved to interpret the
attributes in the sensory data analysis. However, with help
of the free definition task, we get a second description of
the experienced quality factors: one set of individual quality
factors used in the sensory evaluation and one set of relating
qualitative descriptors. These descriptions ar e short (one
sentence), well defined, and exact.
The component model extension finally applies these
qualitative descriptors to form a framework of components
of Quality of Experience. By applying the principles of
Grounded Theory framework [68] through systematical
steps of open coding, concept development, and categoriz-
ing, we get a descriptive Q uality of Experience framework
which shows the underlying main components of QoE
in relation to the developed individual quality factors.
Comparable approaches have been used in the interview-
based mixed method approaches. The similarity makes it
possible to directly compare (and combine) the outcomes of
the different methods. The component model extension can
serve as a valuable extension of the OPQ approach towards
the creation of a consensus vocabulary.
4. Research Method
4.1. Test Participants. A total of 77 participants (gender: 31
female, 46 male; age: 16–56, mean
= 24 years) took part
in the psychoperceptual evaluation. All participants were
recruited according to the user requirements for mobile 3D
television and system. They were screened for normal or
corrected to normal visual acuity (myopia and hyperopia,
Snellen index: 20/30), color vision using Ishihara test, and
stereo vision using Randot Stereo Test (
≤60 arcsec). The
sample consisted of mostly na
¨
ıve participants w ho had not
had any previous experience in quality assessments. Three
participants took part in a qualit y ev aluation before, one of
them even regularly. All participants were no professionals
in the field of multimedia technology. Simulator Sickness
of participants was controlled during the experiment using
the Simulator Sickness Questionnaire. The results of the SSQ
showed no severe effect of 3D on the condition of the test
participants [69]. For the sensory analysis, a subgroup of 17
test participants was selected. During the analysis, one t est
participants was removed from the sensory panel.
EURASIP Journal on Image and Video Processing 7
Generation of terminology from
individual sensory attributes
Model of components of
quality of experience
Component model
Sensory profiling
Profiles of overall quality
Data collection
Procedure
Method of analysis
Results
(Hierarchical) multiple
factor analysis
Psychoperceptual evaluation
Excellence of overall quality
Analysis of variance
Preferences of treatments
External preference mapping
Relation between excellence
and profiles of overall quality
Idiosyncratic experienced
quality factors
Perceptual quality model
Partial least square
regression
Combined perceptual space-
preferences and quality model
Training and anchoring
Psychoperceptual
evaluation
Introduction
Attribute elicitation
Attribute refinement
Sensorial evaluation
Method
Research problem
Grounded theory
Free definition task
Correlation plot-
experienced quality factors
and main components of the
quality model
Extended open profiling of quality
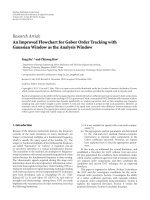
Figure 2: Overview of the subsequent steps of the Extended Open Profiling of Quality approach. Bold components show the extended parts
in comparison to the recent OPQ approach [10].
4.2. Stimuli
4.2.1. Variables and Their Production. In this study, we varied
three different coding methods using slice and noslice mode,
two error protections, and two different channel loss rates
with respect to the Mobile 3DTV system [70]. The Mobile
3DTV transmission system consists of taking stereo left
and right views as input and displaying the 3D view on a
suitable screen after broadcasting/receiving with necessary
processing. The building blocks of the system can be broadly
grouped into four blocks: encoding, link layer encapsulation,
ph ysical transmission, and receiver. Targeting a large set of
impacting parameters on the Quality of Experience in mobile
3D video broadcasting, the different test contents were varied
in coding method, protection scheme, error rate and slice
mode.
4.2.2. Contents. Four different contents were used to create
the stimuli under test. The selection criteria for the videos
were spatial details, temporal resolution, amount of depth,
and the user requirements for mobile 3D television and video
(Table 2).
4.3. Production of Test Material and Transmission Simulations
4.3.1. Coding Methods. The effect of coding methods on the
visual quality in a transmission scenario is two fold. The first
one is different artifacts caused by encoding methods prior
to transmission [13]. The other one is different perceptual
qualities of the reconstructed videos after the transmission
losses due to different error resilience/error concealment
characteristics of the methods. We selected three differ-
ent coding methods representing different approaches in
compressing mobile 3D video in line with previous results
[12, 13].
Simulcast Coding (Sim). Left and right views are compressed
independent of each other using the state-of-the-art mono-
scopic video compression standard H.264/AVC [71].
Multiview Video Coding (MVC). Different from simulcast
encoding, the right view is encoded by exploiting the
interview dependency using MVC extension of H.264/AVC
[72]. The exploited interview dependency results in a better
compression rate than simulcast encoding.
Video + Depth Coding (VD). In this method, prior to com-
pression, the depth information for the left view is estimated
by using the left and right views. Similar to simulcast coding,
left view and the depth data are compressed individually
using standard H.264/AVC [73].
For all the coding methods, the encodings were per-
formed using JMVC 5.0.5 reference software with IPPP
prediction structure, group of pictures ( GOP) size of 8, and
target video rate of 420 kbps for total of the left and right
views.
4.3.2. Slice Mode. For all the aforementioned encoding
methods, it is possible to introduce err or resilience by
enabling slice encoding which generates multiple indepen-
dently decodable slices corresponding to different spatial
areas of a video frame. The aim of testing the slice mode
parameter is to obser ve whether the visual quality is im-
proved subjectively with the provided error resilience.
4.3.3. Error Protection. In order to combat higher error
rates in mobile scenarios, there exists the Multi Protocol
8 EURASIP Journal on Image and Video Processing
Encapsulation-Forward Error Correction (MPE-FEC) block
in the DVB-H link layer which provides additional error
protection above physical layer. In this study, multiplexing
of multiple services into a final transport stream in DVB-
H is realized statically by assigning fixed burst durations for
each service. Considering the left and right (depth) view
transport streams as two ser vices, two separate bursts/time
slices are assigned with different program identifiers (PID)
as if they are two separate streams to be broadcasted. In
this way, it is both possible to protect the two streams
with same protection rates (Equal Error Protection, EEP)
as well as different rates (Unequal Error Protection, UEP).
By varying the error protection parameter with EEP and
UEP settings during the tests, it is aimed to observe whether
improvements can be achieved by unequal protection with
respect to conventional equal protection.
The motivation behind unequal protection is that the
independent left view is more important than the right or
depth view. The right view requires the left view in the
decoding process, and the depth view requires the left view
in order to render the right view. However, left view can be
decoded without right or depth view.
The realization of generating transport streams with EEP
and UEP is as follows. The MPE-FEC is implemented using
Reed-Solomon (RS) codes calculated over the application
data during MPE encapsulation. MPE Frame table is con-
structed by filling the table w ith IP datagram bytes column-
wise. For the t able, the number of rows are allowed to be 256,
512, 768, or 1024 and the maximum number of Application
Data (AD) and RS columns are 191 and 64, respectively,
which corresponds to moderately strong RS code of (255,
191) with the code rate of 3/4. In equal error protection
(EEP), the left and right (depth) views are protected equally
by assigning 3/4 FEC rate for each burst. Unequal error
protection (UEP) is obtained by transferring (adding) half
of the RS columns of the right (depth) view burst to the RS
columns of the left view burst compared to EEP. In this way,
EEP and UEP streams achieve the same burst duration.
4.3.4. Channel Loss Rate. Two channel conditions were
applied to take into account the characteristics of an
erroneous channel: low and high loss rates. As the error rate
measure, MPE-Frame Error Rate (MFER) is used which is
defined by the DVB Community in order to represent the
losses in DVB-H transmission system. MFER is calculated as
the ratio of the number of erroneous MPE frames after FEC
decoding to the total number of MPE frames
MFER
(
%
)
=
Number of erroneous frames
To t al num b e r o f f r ames
.
(1)
MFER 10% and 20% values are chosen to be tested
former representing a low rate and latter being the high with
the goal of (a) having different perceptual qualities and (b)
allowing having still acceptable perceptual quality for the
high error rate condition to watch on a mobile device.
4.3.5. Preparations of Test Sequences. To prepare transmitted
test sequences from the selected test parameters (Figure 3),
Table 2: Snapshots of the six contents under assessment (V
SD
:
visual spatial details, V
TD
:temporalmotion,V
D
:amountofdepth,
V
DD
:depthdynamism,V
SC
:amountofscenecuts,andA:audio
characteristics).
Screenshot
Genre and their audiovisual
characteristics
Animation—Knight’s Quest 4D (60 s
@ 12.5 fps)
Size: 432
× 240 px
V
SD
:high,V
TD
:high,V
D
:med,
V
DD
:high,V
SC
:high
A:music,effects
Documentary—Heidelberg (60 s @
12.5 fps)
Size: 432
× 240 px
V
SD
:high,V
TD
:med,V
D
:high,V
DD
:
low, V
SC
:low
A:orchestralmusic
Nature—RhineValleyMoving (60 s @
12.5 fps)
Size: 432
× 240 px
V
SD
:med,V
TD
:low,V
D
:med,
V
DD
:low,V
SC
:low,
A:orchestralmusic
User-created Content—Roller (60 s @
15 fps)
Size: 432
× 240 px
V
SD
:high,V
TD
:high,V
D
:high,
V
DD
:med,V
SC
:low
A: applause, rollerblade sound.
the following steps were applied: first, each content was
encoded with the three coding methods applying slice mode
on and off. Hence, six compressed bit streams per content
were obtained. During the encoding, the QP parameter in
the JMVC software was varied to achieve the target video
bit rate of 420 kbps. The bit streams were encapsulated into
transport streams using EEP and UEP, generating a total of
twelve transport streams. The encapsulation is realized by the
FA TCAPS software [74] using the transmission parameters
given in Table 3. For each transport stream, the same burst
duration for the total of left and right (depth) views was
assigned in order to achieve fair comparison by allocating
the same resources. Finally, low and high loss rate channel
conditions are simulated for each stream. The preparation
procedure resulted in 24 test sequences.
The loss simulation was performed by discarding packets
according to an error trace at the TS packet level. Then,
the lossy compressed bit streams were generated by decap-
sulating the lossy TS streams using the decaps software
[75]. Finally, the video streams were generated by decoding
the lossy bitstreams with the JMVC software. For the error
concealment, frame/slice copy from the previous frame was
employed. The selection of error patterns for loss simulations
are described in detail in the following paragraphs.
EURASIP Journal on Image and Video Processing 9
(a) (b)
(c) (d)
Figure 3: Screenshots of different test videos showing different contents as well as different artifacts resulting from the different test
parameters and the tr ansmission simulation. (a) RhineValley, (b) Knight’s Quest, (c) Roller, and (d) Heidelberg.
Table 3: Parameters of the transmission used to generate transport
streams.
Modulation 16 QAM
Convolutional Code Rate 2/3
Guard Interval 1/4
Channel Bandwidth 8 MHz
Channel Model TU6
Carrier Frequency 666 MHz
Doppler Shift 24 Hz
As mentioned before, MFER 10% and 20% values were
chosen as low and high loss rates. However, trying to assign
the same MFER values for each transport stream would
not result in a fair comparison since different compression
modes and protection schemes may result in different MFER
values for the same error pattern [76]. For this reason, one
error patter n of the channel is chosen for each MFER value
and the same pattern is applied to all transport streams
during the corresponding MFER simulation.
In order to simulate the transmission errors, the DVB-
H physical layer needs to be modeled appropriately. In our
experiments, the ph ysical layer operations and transmission
errors were simulated using the DVB-H physical layer
modeling introduced in [77], where all the blocks of the
system are constructed using the Matlab Simulink software.
We used the transmission parameters given in Ta b l e 3 .For
the wireless channel modeling part, the mobile channel
model Typical Urban 6 taps (TU6) [78] with 38.9 km/h
receiver velocity relative to source (which corresponds to a
maximum Doppler frequency
= 24 Hz) was used. In this
modeling, channel conditions with different loss conditions
can be realized by adjusting the channel SNR parameter.
It is possible for a transport stream to experience the
same MFER value in different channel SNRs as well as
in different time portions of the same SNR due to highly
time varying characteristics. In order to obtain the most
representative error pattern to be simulated for the given
MFER value, we first generated 100 realizations of loss
traces for channel SNR values between 17 and 21 dB. In
this way, 100
× 5 candidate error traces with different loss
characteristics are obtained. Each realization has a time
length to cover a whole video clip transport stream. The
selection of the candidate error pattern for MFER X%(X
=
10, 20) is as follows.
(i) For each candidate error pattern, conduct a trans-
mission experiment and record the resultant MFER
value. As mentioned before, since different coding
and protection methods may experience different
MFER values for the same error pattern, we used
simulcast—slice—EEP configuration as the reference
for MFER calculation and the resultant error pattern
is to be applied for all o ther configurations.
(ii) Choose the channel SNR which contains the most
number of resultant MFERs close to the target MFER.
It is assumed that this channel SNR is the closest
channel condition for the target MFER.
(iii) For the transmissions with resultant MFER close to
target MFER in the chosen SNR, average the PSNR
distortions of the transmitted sequences.
(iv) Choose the error pattern for which the distortion
PSNR value is closest to the average.
(v)UsethiserrorpatternforeveryotherMFERX%
transmission scenario.
4.4. Stimuli Presentation. NEC autostereoscopic 3.5
display
with a resolution of 428 px
× 240 px was used to present
the videos. This prototype of a mobile 3D display provides
equal resolution for monoscopic and autostereoscopic pre-
sentation. It is based on lenticular sheet technology [39].
The viewing distance was set to 40 cm. The display was
connected to a Dell XPS 1330 laptop via DVI. AKG K-
450 headphones were connected to the laptop for audio
representation. The laptop served as a playback device
and control monitor during the study. The stimuli were
presented in a counterbalanced order in both evaluation
tasks. All items were repeated once in the psychoperceptual
10 EURASIP Journal on Image and Video Processing
evaluation task. In the sensory evaluation task, stimuli were
repeated only when the participant wanted to see the video
again.
4.5. Test Procedure. A two-part data collection procedure
follows the theoretical method description in Section 3.
4.5.1. Psychoperceptual Evaluation. Prior to the actual eval-
uation, training and anchoring took place. Participants
trained for viewing the scenes (i.e., finding a sweet spot)
and the evaluation task, were shown all contents and the
range of constructed quality, including eight stimuli. Abso-
lute Category Rating was applied for the psychoperceptual
evaluation for the overall quality, rated with an unlab eled 11-
point scale [18]. In addition, the acceptance of overall quality
was rated on a binary (yes/no) scale [35]. All stimuli were
presented twice in a random order. The simulator sickness
questionnaire (SSQ) was filled out prior to and after the
psychoperceptual e valuation to be able to control the impact
of three-dimensional video perception [79, 80]. The results
of the SSQ showed effect in oculomotor and disorientation
for the first posttask measure. However, the effect q uickly
decreased within twelve minutes after the test to pretest level
[69].
4.5.2. Sensory Profiling. The Sensory Profiling task was based
on a Free Choice Profiling [54] methodology. The procedure
contained four parts, and they were carried out after a short
break right after the psychoperceptual evaluation. (1) An
introduction to the task was carried out using the imaginary
apple description task. (2) Attribute elicitation: a subset of
six stimuli were presented, one by one. The participants were
asked to write down their individual attributes on a white
sheet of paper. They were not limited in the amount of
attributes nor were they given any limitations to describe
sensations. (3) Attribute refinement: the participants were
given a task to rethink (add, remove, change) their attributes
to define their final list of words. In addition to prior OPQ
studies, the free definition task was performed. In this task,
test participants defined freely the meaning of each of their
attributes. If possible, they were asked to give additional
labels for its minimum and maximum sensation. Following,
the final vocabulary was transformed into the assessor’s
individual score card. Finally, another three randomly chosen
stimuli were presented once and the assessor practiced the
evaluation using a score card. In contrast to the following
evaluation task, all ratings were done on a one score
card. Thus, the test participants were able to compare
different intensities of their attributes. (4) Evaluation task:
the stimulus was presented once and the participant rated it
on a score card. If necessary , a repetition of each stimulus
could b e requested.
4.6. Method of Analysis
4.6.1. Psychoperceptual Evaluation. Non-parametric meth-
ods of analysis were used (Kolmogorov-Smirnov: P<.05)
for the acceptance and the preference data. Acceptance
ratings were analyzed using Cochran’s Q and McNemar -Test.
Cochran’s Q is applicable to study differences between several
related, categorical samples, and McNemars test is applied
to measure differences between two related, categorical data
sets [40]. Comparably, to analyze overall quality ratings,
a combination of Friedman’s test and Wilcoxon’s test was
applied to study differences between the related, ordinal
samples. The unrelated categorial samples were analyzed
with the corresponding combination of Kruskal-Wallis H
and Mann-Whitney U test [40].
4.6.2. Sensory Profiling. The sensory data was analyzed
using R and its FactoMineR package [81, 82]. Multiple
Factor Analysis (MFA) was applied to study the underlying
perceptual model. Multiple Factor Analysis is applicable
when a set of test stimuli is described by several sets of
variables. The variables of one set thereby must be of the
same kind [58, 83
]. Hierarchical Multiple Factor Analysis
(HMFA) was applied to study the impact of content on
the perceptual space. It assumes that the different data sets
obtained in MFA c an be grouped in a hierarchical structure.
The structure of our data set is visualized in Figure 1.MFA
andHMFAhavebecomepopularintheanalysisofsensory
profiles and have been successfully applied in food sciences
[57, 58, 83] and recently in the evaluation of audio [63, 84].
We also compared our MFA results with the results of the
commonly applied Generalized Procrustes Analysis (GPA)
and can confirm Pages’s finding [60] that the results are
comparable.
4.6.3. External Preference Mapping. Partial Least Square
Regression was conducted using MATLAB and the PLS script
provided by Abdi [65] to link sensory and preference data.
To compare the results of the PLS regression to the former
OPQ approach, the data was additionally analyzed using
PREFMAP routine. PREFMAP was conducted using XLSTAT
2010.2.03.
4.6.4. Free Definition Task. The analysis followed the frame-
work of Grounded Theory presented by Strauss and Corbin
[68]. It contained three main steps. (1) Open coding of
concepts: as the definitions from the Free Definition task
are short and well defined, they were treated directly as
the concepts in the analysis. This phase was conducted
by one researcher and reviewed by another researcher. (2)
All concepts were organized into subcategories, and the
subcategories were further organized under main categories.
Three researchers first conducted an initial categorization
independently and the final categories were constructed
in the consensus between them. (3) Frequencies in each
category were determined by counting the number of the
participants who mentioned it. Several mentions of the
same concept by the same participant were recorded only
once. For 20% of r andomly selected pieces of data (attribute
descriptions or lettered interviews), interrater reliability is
excellent (Cohen’s Kappa: 0.8).
EURASIP Journal on Image and Video Processing 11
Error rate
mfer10 mfer20
Error rate
mfer10 mfer20
Error rate
mfer10 mfer20
Error rate
mfer10 mfer20
Error rate
mfer10 mfer20
Content
All
Roller
Rhine
Heidelberg
Slice
SliceSlice
modeSlice mode
No slice
Coding method
VD
Sim
MVC
VD
Sim
MVC
VD
Sim
MVC
VD
Sim
MVC
VD
Sim
MVC
VD
Sim
MVC
VD
Sim
MVC
VD
Sim
MVC
VD
Sim
MVC
VD
Sim
MVC
100
80
60
40
20
0
(%)
100
80
60
40
20
0
(%)
100
80
60
40
20
0
(%)
Error protection strategy
EEP
UEP
Acceptable (%)
Not acceptable (%)
Acceptance
Knights
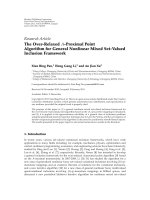
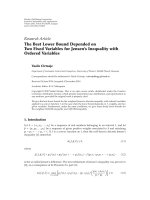
Figure 4: Acceptance ratings in total and content by content for all variables.
5. Results
5.1. Psychoperceptual Evaluation
5.1.1. Acceptance of Overall Quality. In general, all mfer10
videos had higher acceptance ratings than mfer20 videos
(P<.01) (Figure 4). Also the error protection strategy
showed significant effect (Cochran Test: Q
= 249.978, df = 7,
P<.001). The acceptance rate differs significantly b etween
equal and unequal error protection for both MVC and VD
codec (both: P<.001). The error protection strategy had
no effect on the mfer20 videos (both: P>.05). Comparing
the different slice modes, a significant effect can only be
found between videos with VD coding and error rate 10%
(mfer10) (McNemar Test: P<.01, all other comparisons
P>.05). Videos with slice mode turned off were preferred
in general, except Video + Depth videos with high error rate
that had higher acceptance in slice mode. Relating to the
applied coding method, the results of the acceptance analysis
revealed that for mfer10 MVC and VD had higher acceptance
ratings than Simulcast (P<.001). MVC coding method had
significantly higher acceptance ratings than the other two
coding methods for mfer20 (P<.01).
To identify the acceptance threshold, we applied the
approach proposed by Jumisko-Pyykk
¨
oetal.[35](Figure 5).
Due to related measures on two scales, the results from
onemeasurecanbeusedtointerpret the results of the other
Quality acceptance
No
Ye s
Mean satisfaction score
10
8
6
4
2
0
7.7
6
4.3
4.8
3.2
1.6
Figure 5: Identification of the Acceptance threshold. Bars show
means and standard deviation.
12 EURASIP Journal on Image and Video Processing
measure. Acceptance Threshold methods connects binary
acceptance ratings to the overall satisfaction scores. The
distributions of acceptable and unacceptable ratings on the
satisfaction scale differ significantly (χ
2
(10) = 2117.770,
df
= 10, P<.001). The scores for nonaccepted overall
quality are found between 1.6 and 4.8 (Mean: 3.2, SD: 1.6).
Accepted quality was expressed with ratings between 4.3 and
7.7 ( Mean: 6.0, SD: 1.7). So, the Acceptance Threshold can
be determined between 4.3 and 4.8.
5.1.2. Satisfaction with Overall Quality. The test variables had
significant effect on the overall qualit y when averaged over
the content (Fr
= 514.917, df = 13, P<.001). The results of
the satisfaction ratings are shown in Figure 7 averaged over
contents (All) and content by content.
Coding methods showed significant effect on the depen-
dent variable (Kruskal-Wallis: mfer10: H
= 266.688, df = 2,
P<.001; mfer20: H
= 25.874, df = 2, P<.001). MVC and
VD outperformed Simulcast coding method within mfer10
and mfer20 videos (all comparisons versus Sim: P<.001)
(Figure 6). For mfer10, Video + Depth outperforms the other
coding methods (Mann-Whitney: VD versus MVC: Z
=
−
11.001.0, P<.001). In contrast, MVC gets significantly
the best satisfaction scor es at mfer20 (Mann-Whitney: MVC
versus VD: Z
=−2.214.5, P<.05).
Error protection strategy had an effect on overall quality
ratings (Friedman: Fr
= 371.127, df = 7, P<.001). Mfer10
videos with equal er ror protection were rated better for MVC
coding method (Wilco xon: Z
=−6.199, P<.001). On the
contrary, mfer 10 videos using VD coding method were rated
better with unequal error protection (Z
=−7.193, P<.001).
Error protection strategy had no significant effect for mfer20
videos (Figure 7)(Z
=−1.601, P = .109, ns).
Videos with mfer10 and slice mode turned off were
rated better for both MVC and VD coding method (all
comparisons P<.05). Mfer20 videos were rated better when
slice mode was turned on (with significant effect for VD
coded videos (Z
=−2.142, P<.05) and no significant effect
for videos coded with MVC method (Z
=−.776, P>.05,
ns). In contrast to the general findings, the results for content
Roller show that videos with slice mode turned on were rated
better for all coding methods and error rates than videos
without slice mode (Figure 7).
5.2. Sensory Profiling. A total of 116 individual attributes
were developed during the sensory profiling session. The
average number of attributes per participant was 7.25 (min:
4, max: 10). A list of all attributes and their definitions can
be found in Ta b l e 5. For the sake of c larity, each attributes is
coded with an ID in all following plots.
The results of the Multiple Factor Analysis are shown
as representation of test items (item plot, Figure 8)and
attributes (correlation plot, Figure 9). The item plot shows
the first two dimensions of the MFA. All items of the
content Roller are separated from the rest along both
dimensions. The other items are separated along dimension
1 in accordance to their error rate. Along d imension 2,
mfer20
mfer10
Coding method
VDSimMVC
Mean satisfaction score
10
8
6
4
2
0
Figure 6: Mean Satisfaction Score of the differ ent coding methods
averaged over contents and other test parameters. Error bars show
95% CI.
the Knight items separate from the rest of the items on the
positive polarity.
A better understanding of the underlying quality ratio-
nale can be found in the correlation plot. The interpretation
of the attributes can help to explain the resulting dimensions
of the MFA. The negative polarity of dimension 1 is described
with attributes like “grainy”, “blocks,” or “pixel errors” clearly
referring to perceivable block errors in the content. Also
attributes like “video stumbles” can be found describing the
judder effects of lost video frames during transmission. In
contrast, the positive polarity of dimension 1 is described
with “fluent” and “perceptibility of objects” relating to an
error-free case of the videos. Confirming the findings of our
previous studies, t his dimension is also described with 3D-
related attributes like “3D ratio” or “immersive.”
Dimension 2 is described with attributes like “motivates
longer to watch,” “quality of sound,” and “creativity” on
the positive polarity. It also shows partial correlation with
“images distorted at edges” or “unpleasant spacious sound”
on the negative side. In combination with the identified
separation of contents Knight and Roller along dimension 2
in item plot, it turns out that dimension 2 must be regarded
as a very content-specific dimension. It describes very w ell
the specific attributes that people liked or disliked about the
contents, e specially the negative descriptions of Roller.
This effect can be further p roven in the individual factor
map (Figure 10). The MFA routine in FactoMineR allows
EURASIP Journal on Image and Video Processing 13
Mean satisfaction scoreMean satisfaction scoreMean satisfaction score
Error rate
Content
All
Roller
Rhine
Heidelberg
Slice
SliceSlice
modeSlice mode
No slice
10
8
6
4
2
0
10
8
6
4
2
0
10
8
6
4
2
0
Error protection strategy
EEP
UEP
Knights
mfer20
mfer10
Coding method
VD
Sim
MVC
VD
Sim
MVC
VD
Sim
MVC
VD
Sim
MVC
VD
Sim
MVC
Figure 7: Overall quality for all variables in total and content by content.
Heidelberg_EEP_noslice_MVC_mf er10
Heidelberg_EEP_noslice_MVC_mf er20
Heidelberg_EEP_noslice_VD_mf e r
Heidelberg_EEP_noslice_VD_mf er20
Heidelberg_EEP_slice_MVC_mf er10
Heidelberg_EEP_slice_MVC_mf er20
Heidelberg_EEP_slice_VD_mf er10
Heidelberg_EEP_slice_VD_mf er20
Knights_EEP_noslice_MVC_mf er10
Knights_EEP_noslice_MVC_mf er20
Knights_EEP_noslice_VD_
Knights_EEP_noslice_VD_mf er20
Knights_EEP_slice_MVC_mf er10
Knights_EEP_slice_MVC_mf er20
Knights_EEP_slice_VD_mf er10
Knights_EEP_slice_VD_mf er20
Rhine_EEP_noslice_MVC_mf er10
Rhine_EEP_noslice_MVC_mf er20
Rhine_EEP_noslice_V D
Rhine_EEP_noslice_VD_mf er20
Rhine_EEP_slice_MVC_mf er10
Rhine_EEP_slice_MVC_mf er20
Rhine_EEP_slice_VD_mf er10
Rhine_EEP_slice_VD_mf er20
Roller_EEP_noslice_MVC_mf er10
EP_noslice_MVC_mfer20
Roller_EEP_noslice_VD_mf er10
oller_EEP_noslice_VD_mfer20
Roller_EEP_slice_MVC_mf er10
oller_EEP_slice_MVC_mfer20
Roller_EEP_slice_VD_mf er10
R
R
R
oller_EEP_slice_VD_mfer20
Dimension 1 (21.08%)
Dimension 2 (8.902%)
−6 −4 −20 2 4 6
−6
−4
−2
0
2
4
6
Individual factor map
Figure 8: Item plot of the Multiple Factor Analysis.
defining additional illustrative variables. We defined the
different test parameters as illustrative variables. The lower
the value of an additional variable, the lower its impact on
the MFA model is. The results confirm very well the findings
of the q uantitative analysis. Contents Knight (c2) and Roller
(c4) were identified as most impacting variables. Impact on
the MFA model can also be found for the different MFER
rates (m1, m2) and for the coding methods (cod1, cod2). The
two slices modes (on, off) do show only low value confirming
their low impact on perceived quality.
As an extension of MFA, the Hierarchical Multiple Factor
Analysis can be used to further study the significant impact
of the content on the perceived quality. For the HMFA
we assumed that each test item is a combination of a set
of parameters applied to a specific content. The results
are presented as superimposed presentation of the different
contents (Figure 11).
Each parameter combination is shown at the center
of gravity of the partial points of the contents. Figure 11
confirms that the test participants were able to distin-
guish between the different parameters. The parameter
14 EURASIP Journal on Image and Video Processing
P84.10
P41.1
P41.2
P41.7
P41.8
P41.9
P41.10
P28.4
P28.5
P67.4
P96.3
P96.4
P96.7
P12.2
P12.4
P12.5
P5.3
P5.4
P5.5
P5.6
P5.7
P5.8
P5.10
P83.4
P92.1
P92.2
P92.3
P89.5
Dimension 1 (21.08%)
Dimension 2 (8.9%)
−1 −0.50 0.51
−1
−0.5
0
0.5
1
Variables factor map (PCA)
Figure 9: Correlation plot of the Multiple Factor Analysis. For the
sake of clarity, only attributes having more than 50% of explained
variance are shown.
c1
c2
c3
c4
off
on
cod1
cod2
m1
m2
Dimension 1 (21.08%)
Dimension 2 (8.902%)
−50 5
−6
−4
−2
0
2
4
8
6
Individual factor map
p20
p84
p41
p76
p30
p28
p61
p95
p3
p67
p96
p12
p5
p83
p92
p89
Figure 10: Individual factor map of the MFA. The test parameters
were used as supplementary variables in the MFA and their impact
on the MFA results is illustrated by the points of content (c1–c4),
coding method (cod1, cod2), error protection (m1, m2), and slice
mode (on, off ).
slice.vd.mfer10
slice.vd.mfer20
noslice.vd.mfer20
slice.mvc.mfer20
noslice.vd.mfer10
noslice.vd.mfer20
noslice.mvc.mfer10
slice.mvc.mfer10
−20 2 4
−2
−1
0
1
2
3
4
Dimension 1 (22.35%)
Dimension 2 (17.67%)
Heidelberg
Knights
Rhine
Roller
Superimposed representation of the partial clouds
Figure 11: Superimposed representation of the test parameter
combinations and the partial clouds of contents.
combinations are separated in accordance to the MFER rate
and the coding method. Slice mode only shows little impact.
However, it is noticeable that the different contents impact
on the evaluation of the test parameters. The lines around the
center of gravity show the impact of contents. While for the
high error rate the impact of contents is rather low shown by
close location of partial point close to center of gravity, there
is impact for the low error rate.
5.3. External Preference Mapping. The next step of the
OPQ approach is to connect users’ quality preferences and
the sensory data. In the current Extended OPQ approach,
a Partial Least Square Regression was applied. To show
the differences of the PLS regression and the commonly
applied PREFMAP approach, a comparison of both results
is presented. For both cases a clear preference structure can
be found in the dataset (see F igures 12 and 13).
The result of PREFMAP is given as a contour plot
(Figure 12). It shows how many test participants have a pref-
erence above average in a given region of the preference map.
Each test participant’s preference is given in addition. The
contour/preference plot allows interpreting the PREFMAP
results quickly. All participants show a clear preference for
the good quality d imension. The contour plot must be read
in combination with the MFA correlation plot (Figure 9)
from which can be seen that the preferences are described
with the terms like immersive (P12.5), contrast (P5.10), or
soft scene cuts (P83.4). However, Figure 12 also shows that
the underlying model of PREFMAP is similar to the MFA
and it does not change when preferences are regressed.
The PLS result is given as a correlation plot in Figure 13.
It also shows a clear preference of all test participants.
EURASIP Journal on Image and Video Processing 15
−4
−3
−2
−1
0
1
2
3
4
5
6
Dimension 1
Dimension 2
−8 −6 −4 −202468
Heidelberg_EEP_noslice_
MVC_mfer10
Heidelberg_EEP_noslice_
MVC_mfer
20
Heidelberg_EEP_noslice_V
D_mfer 20
Heidelberg_EEP_slice_MV
C_mfer 10
Heidelberg_EEP_slice_MV
C_mfer
20
Heidelberg_EEP_slice_VD_
mfer 10
Heidelberg_EEP_slice_VD_
mfer 20
Knights_EEP_noslice_MVC
_mfer 10
Knights_EEP_noslice_MVC
_mfer20
Knights_EEP_noslice_VD_mfer10
Knights_EEP_slice_VD_mfer10
Heidelberg_EEP_noslice_VD_mfer10
Knights_EEP_noslice_VD_
mfer 20
Knights_EEP_slice_MVC_
mfer 20
Knights_EEP_slice_VD_mf
er
20
Rhine_EEP_noslice_MVC_
mfer
10
Rhine_EEP_noslice_MVC_
mfer 20
Rhine_EEP_noslice_VD_mf
er10
Rhine_EEP_slice_MVC_mf
er10
Rhine_EEP_slice_MVC_mf
er20
Rhine_EEP_slice_VD_mfer
10
Rhine_EEP_slice_VD_mfer
10
Roller_EEP_noslice_MVC_
mfer 10
Roller_EEP_noslice_MVC_
mfer 20
Roller_EEP_noslice_VD_m
fer 10
Roller_EEP_noslice_VD_m
fer 20
Roller_EEP_slice_MVC_mf
er10
Roller_EEP_slice_MVC_mf
er20
Roller_EEP_slice_VD_mfer
10
Roller_EEP_slice_VD_mfer
20
Knights_EEP_slice_MVD_mfer10
2
Rhine_EEP_noslice_VD_mf
er20
Figure 12: Contour plot as result of the PREFMAP routine. Red equals high preference, and blue shows lowest preferences. Gr een dots show
the position of the test participants individual preferences.
P 2 0 . 3
P 8 4 . 5
P 4 1 . 1
P 3 0 . 4
P 2 8 . 4
P 3 . 7
P 9 6 . 4
P 9 6 . 7
P 1 2 . 2
P 1 2 . 4 P 1 2 . 5
P 5 . 1
P 5 . 2
P 5 . 6
P 5 . 7
P 5 . 8
P 5 . 1 0
P 9 2 . 1
P 9 6 . 3
P 5 . 3
P 5 . 4
P 5 . 5
−1
−0.5
0
0.5
1
−1 −0.50 0.5 1
Dimension 1
Dimension 2
Figure 13: The results of the External Preference Mapping as correlation plot conducted with PLS regression.
W hen interpreting the main components of the PLS, two
different groups of attributes can be found. The first group
relates to artifact-free and 3D perception for the good quality
(e.g., P5.6 “perceptibility of objects”, P12.5 “immersive”).
The latter one is described with attributes relating to visible
blocks and blurriness (P96.7 “unsharp”, P28.4 “pixel errors”).
Hence, the first component of the PLS model related to
the video quality descriptions with respect to spatial quality.
Although this approves the findings of the MFA , a second
group of attributes influencing the PLS model can be found.
These attributes describe the video quality related to good
or bad temporal q uality like P30.4 (“fluent movement”) or
P20.3 (“time jumps”) and P84.5 (“stumble”), respectively.
Interestingly, the EPM results are not fully comparable to
each other in terms of preferences. This second components
cannot be identified in the MFA results. An explanation for
16 EURASIP Journal on Image and Video Processing
Table 4: Components of Quality of Experience, their definitions, and percentage of participants’ attributes in this category.
Components (major and sub) Definition (examples) N = 17%
Visual temporal Descriptions of temporal video quality factors
Motion in general General descriptions of motion in the content or camera movement 29.4
Fluent motion Good temporal quality (fluency, dynamic, natural movements) 52.9
Influent motion Impairments in temporal quality ( cutoffs, stops, jerky motion, judder) 88.2
Blurry motion Experience of blurred motion under the fast motion 17.6
Visual spatial Descriptions of spatial video quality factors
Clarity Good spatial quality (clarity, sharpness, accuracy, visibility, error free) 76.5
Color Colors in general, their intensity, hue, and contrast 52.9
Brightness Brightness and contrast 17.6
Blurry Blurry, inaccurate, not sharp 47.1
Visible pixels Impairments with visible structure (e.g., blockiness, graininess, pixels). 70.6
Detection of objects Ability to detect details, their edges, outlines 47.1
Visual depth Descriptions of depth in video
3D effect in general General descriptions of a perceived 3D effect and its delectability 58.8
Layered 3D Depth is described having multiple layers or structure 23.5
Foreground Foreground related descriptions 17.6
Background Background related descriptions 35.3
Viewing experience User’s high level constructs of experienced quality
Eye str a in Feeling of discomfort in the eyes 35.5
Ease of viewing Ease of concentration, focusing on v iew ing , free from interruptions 52.9
Inter est in content Inter ests in viewing content 11.8
3D Added value
Added value of the 3D effect (advantage over current system, fun, worth
of seeing, touchable, involving)
17.6
Overall quality Experience of quality as a whole without emphasizing one certain factor 11.8
Content Content and content dependent descriptions 17.6
Audio Mentions of audio and its excellence 11.8
Audiovisual Audiovisual quality (synchronism and fitness between media). 29.4
Total number attribute descriptions 128
the differences between the two approaches can be found
in the way how the respective latent structures (or models)
are developed. A possible interpretation for the result is that
in the quantitative evaluation, test participants evaluate the
overall quality more globally. Thereby, fluency of the content
is the most global quality factor. When performing a sensory
evaluation, test participants seem to concentrate on a more
detailed evaluation of the content and spatial errors become
more impacting.
5.4. Component Model. The goal of the component model is
to develop generalized components of Quality of Experience
from the idiosyncratic attributes. The results of the qualita-
tive data evaluation of the Free Definition task shows that, in
general, experienced quality for mobile 3DTV transmission
is constructed from components of visual quality (depth,
spatial, and temporal), viewing experience, content, audio,
and audiovisual quality (Ta b l e 4).
In the component model, visual quality is divided
into depth, spatial, and temporal dimensions. The visual
quality classes were t he most described components in
the framework. The dominating descriptions are related to
visual temporal quality. It summarizes the characteristics of
motion from general mentions of motion and its fluency
to impaired influent and blurry motion. Especially the
descriptors of temporal impairments are outlined by 88.2%
of test participants (video fluent and judder free, minimum:
action is not fluent, bad, juddering/maximum: action is very
fluent).
Visual spatial quality consists of the subcomponents
clarity, color, brightness, impairments of different nature,
and the test participants’ ability to detect objects. Visual
spatial q uality is described from two viewpoints. Good
spatial quality is described related to the detection of objects
and details in the look of these objects. This also relates
in a more general level to clarity and color. On the other
hand, bad spatial quality is described in terms of different
structural imperfections such as blocking impairments and
visible pixels.
Visual depth quality is strongly characterized by the
assessors’ ability to detect depth and its structure to separate
the image clearly into foreground and background. An
important aspect thereby is a clear separation of foreground
and background and a natural transition between them.
EURASIP Journal on Image and Video Processing 17
Table 5: Test participants’ attributes and their definitions from the Free Definition task.
C. ID Attribute Free Definition
P3.1 Sharpness Pixel size, pixel density, and peception of the video in general
P3.2 Fluent work Speed of the individual running frames
P3.3 Colors Contrast, bright-dark-relation, and colour impressions in general
P3.4 Dizzyness How well do the eyes follow? (handling of the video)
P3.5 R e production of details Are details in the video observable?
P3.6 Image offset Layers and individual frames of the video are observable
P3.7 Movements Action of the video is true to reality or video is blurr y
P3.8 Quality of sounds Music in the video, noises are reproduced fitting the image
P5.1 Sharpness Sharpness of the image, image clearly visible
P5.2 Graphic Pix el free image in general
P5.3 Fluent Video fluent and judder free
P5.4 Color Colours well displayed? That is, is a tree recognizable only by the colour?
P5.5 Pleasent to watch No distortion? Hard on the eyes?
P5.6 Perceptibility of objects Is everything cleary displayed or do I need to think of what exactly is being displayed?
P5.7 Error correction Will eventual errors quickly or slowly being corrected? Does the image get stuck at times?
P5.8 3D ratio Is a three dimensional relation e ven existent?
P5.9 Ratio of sound/image Interplay of auio and video, does the audio fit the video scene?
P5.10 Contrast Are objects silhouetted from each other?
P12.1 Sharp
Perceived image sharpness independent to the actual resolution, clear differentiation of objects, clear
edges, and contrast
P12.2 Exhausting Perception stressful, irritations because of errors in the video
P12.3 Fluent Fluent, non-judded perception, and impression of a “running” image instead of individual frames
P12.4 Distorted Displacements, artefacts, and error blocks causing distorted images
P12.5 Immersive How far do I feel sucked in by a scene in the v ideo, how truthful is the perception?
P12.6 Worth seeing
How worth seeing is the video in general? Do positive or negative influences outweigh? Would I
watch the video again?
P12.7 Color fast How close to reality is the personal colour perception? That is, in places I know from reality?
P12.8 Continuous 3D perception How often is the absolute three dimensional perception interrupted?
P20.1 Fluent work Minimum: action is not fluent, bad, juddering/maximum: action is very fluent
P20.2 Blurred image Min: image is clear/max: image is blurry
P20.3 Time jumps Min: no time jumps, action is fluent/max: time jumps thus freezing frames—bad
P20.4 Grass Pixelized—min: no image interference, fluent/max: lots of image interferences
P20.5 Unpleasent for the eyes Min: pleasant for the eyes/max: very unpleasant for the eyes
P20.6 Image blurred Frames are not layered correctly—min: image not displaced/max: image seems to be highly displaced
P20.7 Effect of the 3D effect General 3D effect—min: little 3D effect/max: strong 3D effect
P28.1 Colors Image quality and resolution
P28.2 Free of stumbling Colour intensity
P28.3 Image sections Action is fluent or judded
P28.4 Pixel errors Images well captured? Are the camera perspective chosen in a way that it is pleasant to the eye?
P28.5 Quality of sound Graphical/rendering errors
P28.6 3d effect Are the background noises affected by pixel errors?
P28.7 Resolution
Do the 3D effects show advantage or are they unnecessary at times due to the perspective or not as
visibleduetothequalityofthevideo?
P30.1 Stumble Delay between individual situations (minimum: happens very often and is distracting)
P30.2 Sharpness Objects in foreground and background are well o re badly visible (minimum: very badly visible)
P30.3 Sharpness of movement
Movements cannot be identified, background stay sharp (minimum: movements are extremely
unsharp/blurry)
P30.4 Fluent movement
Movements and action get blurry and get stuck in the background (minimum: movements get very
blurry)
18 EURASIP Journal on Image and Video Processing
Table 5: Continued.
C. ID Attribute Free Definition
P41.1 Exhausting to watch Motion sequences are irritating to the eye
P41.2 Video stumbles Video is stumbling
P41.3 Bad resolution Bad resolution
P41.4 Spatial illustration How well is the 3D effect noticable in the video?
P41.5 Sharpness of depth How sharp is the resolution in the distance, how sharp are the outlines?
P41.6 Illustration of the figures Appearance of the characters in the video
P41.7 Lively animation Which advantages compared to normal TV can be regarded?
P41.8 Creativity Colour, story, and surroundings of the video
P41.9 Motivates to watch longer Fun to watch the video (wanting to see more)
P41.10 Different perspectives Camera work and various perspectives
P61.1 Clear image The image is clearly perceptible
P61.2 Blurred change of images A clear image change is perceptible
P61.3 Sounds close to reality Existent noises are noticable
P61.4 Stumbling image Image stops at certain points
P61.5 Fuzzy at fast movements Movements get unclear when there is quick action
P61.6 3d effect 3D effect is clearly perceptible
P67.1 Foreground unsharp Characters in the foreground are unsharp most of the time
P67.2 Background unsharp Distracting unsharp background
P67.3 Stumbling Sudden jumps, no fluent movement
P67.4 Grainy Crass image errors, that is, instead of a character only coloured squares are visible
P67.5 Double images Moving characters can be seen double, a bit shifted to the right
P67.6 Movement blurred In principle the image is sharp, but the movements are unsharp and appear blurred
P67.7 Image distorted at edges
Concerning only the v ideo with the inline skaters: horizontal lines can be seen on the left picture
frame throughout the v ideo
P67.8 Ghosting After a cut to a new scene parts of the old scene can be seen for a second, both scenes are overlayered
P76.1 Grainy Pixilized, quadrats can be seen
P76.2 Blurry Unsharp image
P76.3 Stumbling Deferment of an image (short freeze frame)
P76.4 Distorted Sustained images
P76.5 After-image Image is followed by a shadow
P76.6 Exhausting It is hard to concentrate on the video
P83.1 3D effect How big is the 3D effect actually? How well do far and close objects actually visibly differ?
P83.2 Stumbling of image How good are moving o bjects being expressed?
P83.3 Ghosting How accurate are the outlines of moving objects? Blurry?
P83.4 Soft scene cuts How good are the scene changes? Image interference? Pixel errors?
P83.5 Stumbling When an image gets stuck?
P84.1 Diversity of colors How precise are the colours and which ones are actually in the video?
P84.2 Reality of colors Are the colours in the video the same in reality? That is, clouds slightly greenish?
P84.3
Colorly constant
background
Background does not change, when there is a not-moving image (colours and outlines do not
change at all)
P84.4 Sharpness How sharp is an image, which is captured by the eye?
P84.5 Stumble Does an image freeze, even though the story continues (deferment)?
P84.6 Ghosting Is there a new camera perspective, while the old one can still be seen in parts?
P84.7 3D depth How well is the three dimensionality?
P84.8 Blurred image Is the image sharp or does does the left and the right eye capture differently?
P84.9 Coarse pixels Visible pixels in the image
P84.10 Unpleasent spacious sound Image consists of certain tones, which do not fit the action
EURASIP Journal on Image and Video Processing 19
Table 5: Continued.
C. ID Attribute Free Definition
P89.1 Color quality How good and strong are the colours visible and do they blur into each other?
P89.2 Grainy Is the image blurry?
P89.3 Stumbling movement Fluent image transfers?
P89.4 Sharpness of outlines Is everything clearly recognizable and not blurry?
P89.5 Sounds Are noises integrated logically into the v ideo?
P89.6 3D effect Is a 3D effect noticable?
P89.7
Quality when moving your
position
Does something (especially quality) change when the display (prototyp/mobile dev ice) is being held
in a different position?
P89.8 Transition fore/background Is a clear transission noticable?
P92.1 Blocks Small blocks that do not blend into the whole image
P92.2 Image offset When one of the frames comes too late or too early
P92.3 3D effect If the 3D effect is clearly visible or not
P92.4
Synchronization of image
and sound
When audio and video are being displayed in a way that they perfectly fit
P95.1 Constant in stereo Display in a way the eye does not “click” —error between left and right image composition
P95.2 Continuity Consistent, judder free composition of the whole image
P95.3 Artefacts Local errors in the image (eventually compression)
P95.4 Unsharpness of movements Moving image elements are hard to follow
P95.5
Image and sequence
changes
Transitions between scenes without stress to the eyes
P95.6 Depth of focus Sharpness of the background image, stereo effect also in the image depth
P95.7 Color of foreground Illumination, colour of foreground image
P95.8 Color background Illumination, colour of background image
P96.1 Stumble Image not fluent
P96.2 Blurred Image quality not high
P96.3 Grainy Grainy
P96.4 Fuzzy Images not easy to notice
P96.5 Single elements hang Some image elements get stuck while others move forward
P96.6 Realistic How well 3D quality is noticeable
P96.7 Unsharp Blurred
Viewing e xperience describes the users’ high-level con-
structs of experienced quality. Its subcomponents do not
directly describe the representations of stimuli (e.g., colors,
visible errors). They are more related to an interpretation
of the stimuli including users’ knowledge, emotions, or
attitudes as a part of quality experience. The dominating
subcomponents hereby a re the ease of viewing and, as
a contrary class, eye strain. Both subcomponents can be
regarded as a direct consequence of good and bad spatial
quality of the stimuli. Added value of 3D, relating to a benefit
of 3D over a common 2D presentation, was really mentioned.
Beside these pr esented key classes, components of con-
tent, audio, and audiovisual aspects were identified and
completed the framework of components of Quality of
Experience for mobile 3D video transmission.
6. Discussion and Conclusions
6.1. Complementation of Results. One aim of this paper
was to investigate the quality factors in tr ansmission sce-
narios for mobile 3D television and video. We applied
the Extended OPQ approach to be able to get a holistic
understanding of components of Quality of Experience. In
the Ext-OPQ approach, the component model is added as
an additional, qualitative tool to generalize the idiosyncratic
qualit y attributes into a Q uality of Experience frame-
work.
Our study highlights the importance of the Open Profil-
ing approach as it allows studying and understanding quality
from different points of view. The results of the different steps
of the Extended OPQ approach are summarized in Table 6.
The results are complementing each other and every
part of the Extended OPQ approach supports the findings
of the previous steps and deepens the understanding about
Quality of Experience in mobile 3D video transmission. We
investigated the impact of different transmission settings on
the perceived quality for mobile devices. Two different error
protection strategies (equal and unequal error protection),
two slices modes (off and on), three different coding methods
(MVC, Simulcast and Video + Depth), and two different
error rates (mfer10 and mfer20) were used as independent
variables.
20 EURASIP Journal on Image and Video Processing
The results of the psychoperceptual evaluation in accor-
dance with ITU recommendations show that the provided
quality level of mfer10 videos was good, being at least clearly
above 62% of acceptance threshold for all contents while
mfer20 videos were not acceptable at all; only acceptance of
content Heidelberg was slightly above 50%. This indicates
that an error rate of 20% is insufficient for consumer prod-
ucts, whereas an error rate of 10% would still be sufficient for
prospective systems [74].
The analysis of variance of the satisfaction scores revealed
that all independent variables had a significant effect on test
participants’ perceived quality. The most significant impact
was found for the coding methods. MVC and Video + Depth
outperform Simulcast as coding methods which is in line
with previous studies along the production chain of mobile
3D television and video [12]. Interestingly, the quantitative
results also show that MVC is rated better than V + D in
terms of overall acceptance and satisfaction at high error
rates.
The findings of the psychoperceptual evaluation were
confirmed and extended in the sensory evaluation. The Mul-
tiple Factor Analysis of the sensory data with the independent
variables as supplementary data showed that also in the sen-
sory data, an impact of all test variables was identified. This
confirms that the t est participants were able to distinguish
between the different variables during t he evaluation.
In addition, the idiosyncratic attributes describe the
underlying quality rationale. Good quality is described in
terms of sharpness and fluent playback of the videos.
Also 3D-related attributes are correlating with good quality
which confirms findings of previous studies [10, 13, 14].
Interestingly, bad quality is correlating with attributes that
describe blocking errors in the content. These errors can be
both a result of the coding method as well as the applied error
protection strategies. The expected descriptions of judder
as contrast to fluency of the test items are found rarely.
In addition, MFA indicates a strong dependency of quality
satisfaction from the used contents of the stimuli.
This finding was confirmed by the applied Hierarchical
Multiple Factor Analysis in which a dependency of the
transmission parameters from the contents was studied.
These results confirm psychoperceptual evaluation and sen-
sory results that content plays a crucial role to determine
experience quality of mobile 3D video. The HMFA results
deepen the findings in a way that content seems to become
more important when the perceivable errors become less.
This finding is then supported by the conducted Par-
tial Least Square regression which links sensory data and
the preference ratings. Preferences are all correlating with
attributes that stand for good quality in the MFA. Inter-
estingly, the importance of judder-free stimuli is increasing
in the PLS model. Due to the fact that PLS takes into
account both sensory and preference data to derive the
latent structures, the results suggest that fluency was more
important in the psychoperceptual evaluation than in the
sensory evaluation. We see this result as an indicator that
the quality evaluation of test participants differs slightly in
the psychoperceptual and the sensory analysis. While in the
retrospective psychoperceptual evaluation a global attribute
Table 6: Summary of the OPQ results presented for each step of
analysis.
Psychoperceptual Evaluation
Dataset 77 binary acceptance ratings
77 satisfaction ra tings on 11 point scale
Analysis
Analysis of Variance
Results
High impact of the channel error rate on the perceived
overall quality
MFER10 test stimuli provided reached a highly accept-
able quality level
Most satisfying quality provided by MVC and
Video + Depth
Low impact of slice mode on overall quality, all other
parameters influenced overall quality perception
Sensory Profiling
Dataset
16 configurations of sensory profiling task
Analysis
(Hierarchical) Multiple Factor Analysis
Results
Positive quality (perceptibility of objects, fluent) versus
negative quality (grainy. Blocks, video stumbles)
Descriptions of spatial quality attributes dominate
Added value of depth conveyed when level of artifacts is
low
Strong impact of test content of the perceived quality,
especially at low error rates
External Preference Mapping
Dataset
Combined dataset of psychoperceptual evaluation a nd
sensory profiling
Analysis
Partial Least Square Regression
Results
High correlation o f quantitative preferences with the
artifact-free descriptions of 3D video
Additional impact of fluency of video was found that
was not identified in sensory profiling
Component Model
Dataset
128 individual definitions from Free Definition task
Analysis
Open Coding according to Grounded Theory
framework
Results Framework of 19 components of QoE developed
QoE is constructed from components of visual quality
(depth, spatial, temporal), viewing experience, content,
audio, and a udiovisual quality
like fluency of the videos seems to be crucial, test participants
do a more detailed e valuation of quality in the sensory test
and find more quality factors related to spatial details.
The results of the sensory profiling and the external
preference mapping suggest that there are different com-
ponents t hat contribute to QoE. To generalize the findings
from idiosyncratic attributes to components of QoE, we
extended the current OPQ approach with the component
model. The components framework generalizes the findings
of OPQ and the identified different classes of QoE factors.
Two things are remarkable in the juxtaposition of the results
EURASIP Journal on Image and Video Processing 21
of the sensory profiling and the component model. The
two most mentioned components in the framework are
related to visual temporal and visual spatial quality. The
most impacting subcomponents are related to (in) fluent
motion and the (non-) visibility of pixels. These factors
can also be identified in the MFA results of the sensory
analysis. In addition, each error-related subcomponent has
a contrary component of positive quality (e.g., visible pixels-
clarity). This duality was also identified in the MFA profile
of the sensory analysis. Two other interesting findings in
the component model are in accordance with the profiles.
Although audiovisual stimuli were under test, only few
audiovisual attributes were identified in sensory profiles and
the component model. In addition, a 3D effect was only
described by 58% of the test participants. This confirms
the findings of the MFA that errors or error-free perception
is more important for subjective quality perception than is
the perception of depth and the often predicted increased
quality perception [28, 85]. The visual quality seems to be
dominating in the evaluation. One explanation can be found
in the nonimpaired audio of the test stimuli so that the visual
errors dominate the subjective qualit y perception.
6.2. Further Work and Conclusions. In this paper, we
extended the Open Profiling Approach with advanced
research methods to handle its shortcomings that we had
identified before [10]. By applying more advanced methods
of analysis, we have shown that a combination of different
research approaches can provide deeper insight into data and
open new possibilities for interpretation and understanding
of the components of Quality of Experience.
We introduced Quality of Experience as a “multidimen-
sional construct of user perceptions and behaviors” [4]. The
Extended Open Profiling of Quality approach is able to
capture this multidimensionality and to transform it into
a terminology for QoE. Further work needs to extend the
application of the Ext-OPQ and other descriptive research
methods to form a validated terminolog y that allows for
communication of research results between different bodies
and making Quality of Experience more concrete in terms
of common vocabulary [86]. Further, work is needed to
improve the test methodology in terms of duration. We still
conducted the Ext-OPQ evaluation in a two-session design.
Although we haven’t experienced problems in our study,
dropouts of participants are a risk in multi-session tests
[87].
However, the key aspect of further work should be the
user. Our work in descriptive analysis [9, 10, 12–14]has
shown that our test participants are able to return much
more information than just quantitative preference. The
Extended-OPQ approach shows that a multimethodologi-
cal approach in audiovisual quality evaluation can create
understanding beyond Mean Opinion Scores. Beside the
identification of different information processing styles [14],
we have found first evidence that the evaluation styles differ
from psychoperceptual to sensory evaluation. This aspect
should be seen as a challenge in new studies to create tools
to better validate users and research methodologies.
Concluding, the Ext-OPQ is a research method in the
user-centered Quality of Experience approach that closes the
shortcomings that were identified in standardized research
approaches [1]. Modern evaluation tools for understanding
Quality of Experience need to combine different research
approaches, their benefits, and limitations to capture a
deeper understanding of experienced multimedia qualit y.
Acknowledgments
MOBILE3DTV project has received funding from the ICT
programme of the European Community in the context
of the Seventh Framework Programme (FP7/2007-2011)
under Grant agreement no. 216503. The text reflects only
the authors’ views, and the European Community or other
project partners are not liable for any use that may be
made of the information contained herein. The work of
S. Jumisko-Pyykk
¨
o is supported by the Graduate School in
User-Centered Information Technology (UCIT). The work
of M. Oguz Bici is also partially supported by The Scientific
and Technological Research Council of Turkey (TUBITAK).
The authors thank Done Bugdayci for her efforts during
the preparation of transmission simulations. The authors
would like to thank Meinolf Amekudzi (HeidelbergAlleys:
Detlef Krause (RhineValle y-
Moving: and Benjamin Smith
(Knight’s Quest: )forprovid-
ing stereoscopic content.
References
[1]A.Gotchev,A.Smolic,S.Jumisko-Pyykk
¨
o et al., “Mobile
3D television: development of core technological elements
and user-centered evaluation methods toward an optimized
system,” in Multimedia on Mobile Devices, vol. 7256 of
Proceedings of SPIE, January 2009.
[2] L. Onural and H. M. Ozaktas, “Three-dimensional television:
from science-fiction to reality,” in Three-Dimensional Televi-
sion: Capture, Transmission, Display,H.M.OzaktasandL.
Onural, Eds., Springer, Berlin, Germany, 2007.
[3] ITU-T Rec ommendation P.10 Amendment 1, “Vocabulary
for performance and quality of service. New Appendix I
Definition of Quality of Experience (QoE),” International
Telecommunication Union, Geneva, Switzerland, 2008.
[4] W. Wu, A. Arefin, R. Rivas, K. Nahrstedt, R. Sheppard, and
Z. Yang, “Quality of experience in distributed interactive
multimedia environments: toward a theoretical framework,”
in Proceedings of the ACM Multimedia Conference, with Co-
locatedWorkshopsandSymposiums(MM’09), pp. 481–490,
2009.
[5]E.B.Goldstein,Sensation and Perception,Thomson
Wadsworth, Belmont, Calif, USA, 7th edition, 2007.
[6]S.T.FiskeandS.E.Taylor,Social Cognition,McGrow-Hil,
Singapore, 1991.
[7] J. J. Gibson, The Ecological Approach to Visual Perception,
Houghton Mifflin, Boston, Mass, USA; Lawrence Erlbaum,
1979.
[8] S. Jumisko-Pyykk
¨
o and D. Strohmeier , “R eport on re-
search methodologies for the experiments,” Tech. Rep.,
MOBILE3DTV, 2008, .fi/mobile3dtv/results/
tech/D4.2
Mobile3dtv v2.0.pdf.
22 EURASIP Journal on Image and Video Processing
[9] S. Jumisko-Pyykk
¨
o and T. Utriainen, “A hybrid method for
quality evaluation in the context o f use for mobile (3D)
television,” Multimedia Tools and A pplications. In press.
[10] D . Strohmeier, S. Jumisko-Pyykk
¨
o, and K. Kunze, “Open pro-
filing of quality: a mixed method approach to understanding
multimodal quality perception,” Advances in Multimedia,vol.
2010, Article ID 658980, 28 pages, 2010.
[11]A.Boev,D.Hollosi,A.Gotchev,andK.Egiazarian,“Clas-
sification and simulation of stereoscopic artifacts in mobile
3DTV content,” in Stereoscopic Displays and Applications XX,
vol. 7237 of Proceedings of SPIE, San Jose, Calif, USA, January
2009.
[12] D . Strohmeier and G. Tech, “On comparing different codec
profiles of coding methods for mobile 3D television and
video,” in Proceedings of the International Conference on
3D Systems and Applications (3DSA ’10), Tokyo, Japan,
May 2010.
[13] D . Strohmeier and G. Tech, ““Sharp, bright, three-dimen-
sional“—open profiling of quality for mobile 3DTV coding
methods,” in Multimedia on Mobile Devices, vol. 7542 of
Proceedings of SPIE, S an Jose, Calif, USA, 2010.
[14] D . Strohmeier, S. Jumisko-Pyykk
¨
o, and U. Reiter, “Profiling
experienced quality factors of audiovisual 3D perception,” in
Proceedings of the 2nd International Workshop on Quality of
Multimedia Experience (QoMEX ’10), pp. 70–75, Trondheim,
Norway, June 2010.
[15] P. Engeldrum, Psychometric Scaling: A Toolkit for Imaging
Systems Development, Imcotek Press, Winchester, Mass, USA,
2000.
[16] H. T. Lawless and H. Heymann, Sensory Evaluation of Food:
Principles and Practices, Chapman & Hall, New York, NY, USA,
1999.
[17] Recommendation ITU-R BT.500-11, “Methodology for the
Subjective Assessment of the Quality of Television Pictures,”
Recommendation ITU-R BT.500-11. ITU Telecom. Standard-
ization Sector of ITU, 2002.
[18] Recommendation ITU-T P.910, “Subjective video quality
assessment methods for multimedia applications,” Recom-
mendation ITU-T P.910. ITU Telecom. Standardization Sector
of ITU, 1999.
[19] F. Kozamernik, P. Sunna, E. Wyckens, and D. I. Pettersen,
“Subjective quality of internet video codecs—phase 2 evalu-
ations using SAMVIQ,” EBU Technical Review, no. 301, 2005.
[20] S. Jumisko-Pyykk
¨
o and D. Strohmeier, “Report on r esearch
methodologies for the experiments,” Tech. Rep., Mobile3DTV,
November 2008.
[21]M.D.Brotherton,Q.Huynh-Thu,D.S.Hands,andK.
Brunnstr
¨
om, “Subjective multimedia quality assessment,”
IEICE Transactions on Fundamentals of Electronics, Communi-
cations and Computer Sciences, vol. 89, no. 11, pp. 2920–2932,
2006.
[22] D. M. Rouse, R. P
´
epion,P.LeCallet,andS.S.Hemami,
“Tradeoffs in subjective testing methods for image and video
quality assessment,” in Human Vision and Electronic Imaging
XV, vol. 7527 of Proceedings of SPIE, p. 75270F, January 2010.
[23] S. Bech, R. Hamberg, M. Nijenhuis et al., “Rapid perceptual
image description (RaPID) m ethod,” in Human Vision and
Electronic Imaging, vol. 2657 of Proceedings of SPIE, pp. 317–
328, February 1996.
[24] N. Zacharov and K. Koivuniemi, “Audio descriptive analysis
& mapping of spatial sound displays,” in Proceedings of the
International Conference on Auditory Displays
, 2001.
[25] G. Lorho, “Individual vocabulary profiling of spatial enhance-
ment systems for stereo headphone reproduction,” in Proceed-
ings of the Audio Engineering Society 119th Convention,New
York, NY, USA, 2005, Convention Paper 6629.
[26] G. Lorho, “Perceptual evaluation of mobile multimedia loud-
speakers,” in Proceedings of Audio Engineer ing Society 122th
Convention, Vienna, Austria, 2007.
[27] J. Radun, T. Leisti, J. H
¨
akkinen et al., “ Content and
quality: interpretation-based estimation of image quality,”
ACM Transactions on Applied Perception,vol.4,no.4,pp.1–
15, 2008.
[28] J. H
¨
akkinen, T. Kawai, J. Takatalo et al., “Measuring ster eo-
scopic image quality experience with interpretation based
quality methodology,” in Image Quality and System Perfor-
mance V, vol. 6808 of Proceedings of SPIE, San Jose, Calif, USA,
2008.
[29] S. Jumisko-Pyykk
¨
o, J. H
¨
akkinen, and G. Nyman, “Experienced
quality factors—qualitative evaluation approach to audiovi-
sual quality,” in Multimedia on Mobile Devices, vol. 6507 of
Proceedings of SPIE, 2007, Convention paper 6507-21.
[30] G. Ghinea and J. P. Thomas, “QoS impact user perc eption and
understanding of multimedia video clips,” in Proceedings of the
9th ACM international conference on Multimedia, pp. 49–54,
Bristol, UK, 1998.
[31] S. R. Gulliver and G. Ghinea, “Defining user perception
of distributed multimedia quality,” ACM Transactions on
Multimedia Computing, Communications and Applications,
vol. 2, no. 4, pp. 241–257, 2006.
[32] S. R. Gulliver and G. Ghinea, “Stars in their eyes: what eye-
tracking reveals about multimedia perceptual quality,” IEEE
Transactions on Systems, Man, and Cybernetics Part A:Systems
and Humans, vol. 34, no. 4, pp. 472–482, 2004.
[33] S. R. Gulliver, T. Serif, and G. Ghinea, “Pervasive and
standalone computing: the perceptual effects of variable mul-
timedia quality,” International Journal of Human Computer
Studies, vol. 60, no. 5-6, pp. 640–665, 2004.
[34] S. Jumisko-Pyykk
¨
o and M. M. Hannuksela, “Does context
matter in quality evaluation o f mobile television?” in Proceed-
ings of the 10th International Conference on Human-Computer
Interaction with Mobile Devices and Services (MobileHCI ’08),
pp. 63–72, ACM, September 2008.
[35] S. Jumisko-Pyykk
¨
o, V. Kumar Malamal Vadakital, and M. M.
Hannuksela, “Acceptance Threshold: bidimensional research
method for user-oriented quality e valuation studies,” Interna-
tional Journal of Digital Multimedia Broadcasting, vol. 2008,
Article ID 712380, 20 pages, 2008.
[36] H.KnocheandM.A.Sasse,“Thebigpictureonsmallscreens
delivering acceptable video quality in mobile TV,” ACM
Transactions on Multimedia Computing, Communications and
Applications, vol. 5, no. 3, article 20, 2009.
[37]H.Knoche,J.D.McCarthy,andM.A.Sasse,“Cansmall
be beautiful? Assessing image size requirements for mobile
TV,” in Proceedings of ACM Multimedia, vol. 561, Singapore,
November 2005.
[38] R. B. Johnson and A. J. Onwuegbuzie, “Mixed methods
research: a research paradigm whose time has come,” Educa-
tional Researcher, vol. 33, no. 7, pp. 14–26, 2004.
[39] S. Jumisko-Pyykk
¨
o, U. Reiter, and C. Weigel, “Produced qual-
ity is not perceived quality - a qualitative approach to overall
audiovisual quality,” in
Proceedings of the 1st International
Conference on 3DTV (3DTV-CON ’07), May 2007.
[40] H Coolican, Research Methods and Statistics in Psychology,J.
W. Arrowsmith, London, UK, 4th edition, 2004.
EURASIP Journal on Image and Video Processing 23
[41] G. Nyman, J. Radun, T. Leisti et al., “What do users really
perceive—probing the subjective image quality,” in Image
Quality and System Performance III, vol. 6059 of Proceedings
of SPIE, January 2006.
[42] J. Radun, T. Leisti, T. Virtanen, J. H
¨
akkinen, T. Vuori,
and G. Nyman, “Evaluating the multivariate visual quality
performance of image-processing components,” Transactions
on Applied Perception, vol. 7, no. 3, article 16, 2010.
[43] H. Stone and J. L. Sidel, Sensory Evaluation Practices,Academic
Press, San Diego, Calif, USA, 3rd edition, 2004.
[44] J. C. Gower, “Generalized procrustes analysis,” Psychometrika,
vol. 40, no. 1, pp. 33–51, 1975.
[45] A. A. Williams and G. M. Arnold, “Comparison of the aromas
of six coffees characterized by conventional profiling, free-
choice profiling and similarity scaling methods,” Journal of the
Science of Food and Agriculture, vol. 36, pp. 204–214, 1985.
[46] M. A. Cliff,K.Wall,B.J.Edwards,andM.C.King,
“Development of a vocabulary for profiling apple juices,”
Journal of Food Quality, vol. 23, no. 1, pp. 73–86, 2000.
[47] M. A. Drake and G. V. Civille, “Flavor lexicons,” Comprehen-
sive Reviews in Food Science and Food Safety,vol.2,no.1,
pp. 33–40, 2003.
[48]A.C.Noble,R.A.Arnold,B.M.Masudaetal.,“Progress
towards a standardized system of wine aroma terminology,”
American Journal of Enology and Viticulture, vol. 35, no. 2,
pp. 76–77, 1984.
[49] S. Bech and N. Zacharov, Perceptual Audio Evaluation—
Theory, Method and Application, John Wiley & Sons, Chich-
ester, England, 2006.
[50] G. V. Civille and H. T. Lawless, “The importance of language
in describing perceptions,” Journal of Sensory Studies,vol.1,
pp. 203–215, 1986.
[51] M. C. Meilgaard, C. E. Daigliesh, and J. F. Clapperton,
“Beer flavour terminology,” Journal of the Institute of Brewing,
vol. 85, pp. 38–42, 1979.
[52] M. A. Brandt, E. Z. Skinner, and J. A. Coleman, “Texture
profile method,” Journal of Food Science, vol. 28, pp. 404–409,
1963.
[53] M. Meilgaard, G. V. Civille, and B. T. Carr , Sensory Evaluation
Techniques, CRC Press, Boca Raton, Fla, USA, 1991.
[54] A. A. Williams and S. P. Langron, “The use of Free-choice
Profiling for the Evaluation of Commercial Ports,” Journal of
the Science of Food and Agriculture, vol. 35, pp. 558–568, 1984.
[55] J. A. McEwan, “Prefer ence mapping for product optimiza-
tion,” in Multivariate Analysis o f Data in Sensory Science,T.
Naes and E. Risvik, Eds., Elsevier, Amsterdam, The Nether-
lands, 1996.
[56] P. Schlich, “Preference mapping: relating consumer pref-
erences to sensory or instrumental measurements,” in
Bioflavour, P. Etievant and P. Schreiner, Eds., vol. 95, INRA,
Versailles, France, 1995.
[57] H. Abdi and D. Valentin, “Multiple factor analysis,” in
Encyclopedia of Measurement and Statistics,N.J.Salkind,Ed.,
pp. 651–657, Sage, ThousandOaks, Calif, USA, 2007.
[58] B. Escofier and J. Pag
`
es, “Multiple factor analysis (AFMULT
package),” Computational Statistics and Data Analysis, vol. 18,
no. 1, pp. 121–140, 1994.
[59] J. Pag
`
es and F. Husson, “Inter-laboratory comparison of
sensory profiles: methodology and results,” Food Quality and
Preference, vol. 12, no. 5-7, pp. 297–309, 2001.
[60] J. Pag
`
es, “Analyse factorielle multiple et analyse procust
´
eenne,”
Revue de S tatistique Appliqu´ee, vol. 5353, no. 44, pp. 61–68,
2005.
[61] J. Pag
`
es and M. Tenenhaus, “Multiple factor analysis combined
with PLS regression path modeling. Application to the analysis
of relationships between physicochemical variables, sensory
profiles and hedonic judgments,” Chemometrics and Intelligent
Laboratory Systems, vol. 58, pp. 261–273, 2001.
[62] S. Le Dien and J. Pag
`
es, “Hierarchical multiple factor analysis:
application to the comparison of sensory profiles,” Food
Quality and Preference, vol. 14, no. 5-6, pp. 397–403, 2003.
[63] T. Lokki and K. Puolam
¨
aki, “Canonical analysis of individual
vocabulary profiling data,” in Pr oceedings of the 2nd Interna-
tional Workshop on Quality of Multimedia Experience (QoMEX
’10), pp. 152–157, Trondheim, Norway, June 2010.
[64] L. Perrin, R. Symoneaux, I. Ma
ˆ
ıtre, C. Asselin, F. Jourjon, and
J. Pag
`
es, “Comparison of three sensory methods for use with
the Napping
procedure: case of ten wines from Loire valley,”
Food Quality and Preference, vol. 19, no. 1, pp. 1–11, 2008.
[65] H. Abdi, “Partial least squares regression and projection on
latent structure regression (PLS Regression),” Wiley Interdisci-
plinary Reviews, vol. 2, no. 1, pp. 97–106, 2010.
[66] M. Tenenhaus, J. Pag
`
es, L. Ambroisine, and C. Guinot,
“PLS methodology to study relationships between hedonic
judgements and product characteristics,” Food Quality and
Preference, vol. 16, no. 4, pp. 315–325, 2005.
[67] V V. Mattila, “Descriptive analysis of speech quality in
mobile communications: descriptive language development
and external preference mapping,” in Proceedings of the Audio
Engineering Society Convention, vol. 111, New York, NY, USA,
November 2001, Paper no. 5455.
[68] A. Strauss and J. Corbin, Basics of Qualitative Research:
Techniques and Procedures for De veloping Grounded Theory,
Sage, Thousand O aks, Calif, USA, 2nd edition, 1998.
[69] S. Jumisko-Pyykk
¨
o, T. Utriainen, D. Strohmeier, A. Boev,
and K. Kunze, “Simulator sickness—five experiments using
autostereoscopic mid-sized or small mobile screens,” in Pro-
ceedings of the True Vision—Capture, Transmission and Display
of 3D Video (3DTV-CON ’10), 2010.
[70] M. O. Bici, D. Bugdayci, G. B. Akar, and A. Gotchev , “Mobile
3D v ideo broadcast,” in Proceedings of the International
Conference on Image Processing (ICIP ’01), pp. 2397–2400,
2010.
[71] ITU-T Rec. H.264 and ISO/IEC 14496-10 (MPEG-4 AVC),
ITU-T and ISO/IEC JTC 1, “Advanced Video Coding for
Generic Audiovisual Services,” November 2007.
[72] ISO/IEC JTC1/SC29/WG11, “Text of ISO/IEC 14496-10:200X/
FDAM 1 Multiview Video Coding,” Doc. N9978, Hannover,
Germany, July 2008.
[73] ISO/IEC JTC1/SC29/WG11, ISO/IEC CD 23002-3, “Represen-
tation of auxiliary v ideo and supplemental information,” Doc.
N8259, Klagenfurt, Austria, July 2007.
[74] FATCAPS: A Free, Linux-Based Open-Source DVB-H IP-
Encapsulator, .
[75] DECAPS—DVB-H Decapsulator Software, .fi/
mobile3dtv/download/.
[76] H. Himmanen, M. M. Hannuksela, T. Kurki, and J. Isoaho,
“Objectives for new error criteria for mobile broadcasting of
streaming audiovisual services,” EURASIP Journal on Advances
in Signal Processing, vol. 2008, Article ID 518219, 21 pages,
2008.
[77] M. Oksanen, A. Tikanmaki, A. Gotchev, and I. Defee,
“Delivery of 3D video over DVB-H: building the channel,” in
Proceedings of the 1st NEM Summit (NEMSummit ’08),Saint-
Malo, France, October 2008.
[78] E. Failli, “Digital land mobile radio,” Tech. Rep. COST 207,
1989.
24 EURASIP Journal on Image and Video Processing
[79] M. Lambooij, W. Ijsselsteijn, M. Fortuin, and I. Heynderickx,
“Visual discomfort a nd visual fatigue of stereoscopic displays:
areview,”Journal of Imaging Science and Technology,vol.53,
no. 3, pp. 0302011–03020114, 2009.
[80] R. Kennedy, N. Lane, K. Berbaum, and M. Lilienthal, “Simu-
lator sickness questionnaire: an enhanced method for quan-
tifying simulator sickness,” International Journal of Aviation
Psychology, vol. 3, no. 3, pp. 203–220, 1993.
[81] S. L
ˆ
e, J. Josse, and F. Husson, “FactoMineR: an R package for
multivariate analysis,” Journal of Statistical Software, vol. 25,
no. 1, pp. 1–18, 2008.
[82] R Development Core Team, R: A Language and Environment
for Statistical Computing, R Foundation for Statistical Com-
puting, Vienna, Austria, 2010.
[83] J. Pag
`
es, “Multiple factor analysis: main features and appli-
cation to sensory data,” Rev ista Colombiana de Estadistica,
vol. 27, no. 1, pp. 1–26, 2004.
[84] N. Zacharov, J. Ramsgaard, G. Le Ray, and C. V. Jørgensen,
“The multidimensional characterization of active noise can-
celation headphone perception,” in Proceedings of the 2nd
International Workshop on Quality of Multimedia Experience
(QoMEX ’10), pp. 130–135, June 2010.
[85] S. Jumisko-Pyykk
¨
o, M. Weitzel, andD. S trohmeier, “Designing
for user experience: what to expect from mobile 3D TV and
video?” in Proceedings of the 1st International Conference on
Designing Interactive User Experiences for TV and Video (UXTV
’08), pp. 183–192, Mountain View, Calif, USA, October 2008.
[86] S. Jumisko-Pyykk
¨
o, D. Strohmeier, T. Utriainen, and K. Kunze,
“Descriptive quality of experience for mobile 3D video,” in
Proceedings of the 6th Nordic Conference on Human-Computer
Interaction (NordiCHI ’10), pp. 266–275, Reykjavik, Iceland,
2010.
[87] W. Shadish, T. Cook, and D. Campbell, Experimental and
Quasi-Experimental Designs,HoughtonMifflin, Boston, Mass,
USA, 2002.