Enterprise service computing from concept_3 docx
Bạn đang xem bản rút gọn của tài liệu. Xem và tải ngay bản đầy đủ của tài liệu tại đây (876.35 KB, 30 trang )
42 Zhao, Jeng, An, Cao, Bryant, Hauser, & Tao
Copyright © 2007, Idea Group Inc. Copying or distributing in print or electronic forms without written permis-
sion of Idea Group Inc. is prohibited.
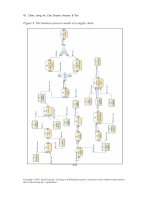
Figure 9. The business-process model of a supply chain
Aligning Business Processes with Enterprise Service Computing Infrastructure 43
Copyright © 2007, Idea Group Inc. Copying or distributing in print or electronic forms without written permission
of Idea Group Inc. is prohibited.
Figure 10. The SDM of the business-process model of Figure 9
Figure 11. The causality tree for ShippingRate
44 Zhao, Jeng, An, Cao, Bryant, Hauser, & Tao
Copyright © 2007, Idea Group Inc. Copying or distributing in print or electronic forms without written permis-
sion of Idea Group Inc. is prohibited.
gular boxes) and each has its own in- and outows. We omitted the part of handling
payment for simplicity. The stock “Order Backlog” in Figure 10 corresponds to
the data repository “Order Backlog” in Figure 9. The activity “Place Order” by the
customer will have the effect of increasing the stock “Order Backlog” and chang-
ing the inow “Demand Rate”. Similarly, the activity “Shipping out Products” after
the storage would have the effect of decreasing the stock and changing the outow
“Fulllment Rate.” The stock “Finished Product” is the result of the activity “Make
Product” and will be reduced by the activity “Shipping out Products.” The stock
“Part WIP” is increased by “Order Parts” and is reduced by “Receive Parts”, and
the stock “Part Inventory” will be increased due to the effect of “Receive Parts”
and reduced by the activity “Make Product.”
It is less clear how the activities in a business-process model affect in- and outow
rates for each stock. In the business-process model, dependencies can be expressed
graphically only through data streams. Any additional dependencies could be buried
in the input criterion and output criterion of the data stream for each task. It is pos-
sible to use built-in expressions or plugged-in programming languages to express
the input and output criteria. On the other hand, the dependencies in an SDM can
be expressed graphically with the notion of polarity, wherein the positive polarity
(denoted by a plus sign) represents reinforcement feedback loops and the negative
polarity (denoted by a minus sign) represents those feedback loops that can reach
equilibrium. The inuence map can be created by connecting direction links. Based
on the visual inuence map, low-level metrics can be synthesized by capturing the
causal relationships in the form of mathematical formulas. The key to bridging the
gap between the business operations and the IT systems is to establish the dynamic
causal relationships between IT-level and business-level performance metrics in
the mathematical formulas. Figure 11 gives an example causality tree for “Ship-
pingRate.” The business-level variables are shown in yellow rectangular boxes;
the IT-level variables are shown in green rectangular boxes. This causality tree
corresponds to the business activities between “Check Order and Product Status”
and “Shipping out Product” shown in Figure 9. We discuss this causality tree in a
bottom-up order.
Let us assume the above inventory system is monitored and controlled by a main
process wherein inventory processes can handle client requests through network
connections one at a time (this example is adjusted from Diao, Hellerstein, Parekh,
& Bigus, 2003). Therefore, the number of inventory processes is constrained by
the maximum number of connections, say “MaxClientConnections,” provided by
the system. The controller monitors connections and manages their life cycles. If
the connection has been idle over a certain amount of time, say “ConnectionLife-
UpperBound,” the connection is terminated or returned to the connection pool. A
higher “MaxClientConnections” value allows the system to process more inventory
Aligning Business Processes with Enterprise Service Computing Infrastructure 45
Copyright © 2007, Idea Group Inc. Copying or distributing in print or electronic forms without written permission
of Idea Group Inc. is prohibited.
requests and increases both CPU (central processing unit) and memory utilization.
Decreasing the value of “ConnectionLifeUpperBound” potentially allows inventory
processes to be more active, leading to higher CPU and memory utilization. The
above description can be formulated as follows (Diao et al.):
CPU
k+1
= A
1,1
* CPU
k
+ A
1,2
* MEM
k
+ B
1,1
* MaxClientConnections
k
+ B
1,2
* Con-
nectionLifeUpperBound
k
and
MEM
k+1
= A
2,1
* CPU
k
+ A
2,2
* MEM
k
+ B
2,1
* MaxClientConnections
k
+ B
2,2
* Con-
nectionLifeUpperBound
k
,
where CPU
k
and MEM
k
represent the values of CPU and memory utilization at the kth
time interval. The metrics MaxClientConnections
k
and ConnectionLifeUpperBound
k
represent the values of “MaxClientConnections”
and “ConnectionLifeUpperBound”
at the kth time interval. The entries A
i,j
and B
i,j
represent modeling parameters at the
IT level that can be obtained using statistical methods. In every time period, the
controller has to decide how much of the available resources (CPU, memory) to
allocate to each inventory process. How to realize this control strategy is beyond
the scope of this chapter. Here, we only show how the business-level and IT-level
metrics can be linked using the causality relationships of an SDM.
The metrics “MinimalProcessTime” at the business level depends on the metrics at
the IT level such as CPU and memory utilization. Good “MinimalProcessTime” is
ensured by reserving sufcient capability to handle workload spikes. A particular
IT-system conguration by tuning parameters such as “MaxClientConnections” and
“ConnectionLifeUpperBound” gives a particular “MinimalProcessTime.”
“DesiredShippingTime” can be assigned a proper value based on the average values
of real processing time. The “DesiredShippingRate” is determined by “OrderBack-
log” and “DesiredShippingTime”:
.
ppingTime
DesiredShi
og
OrderBackl
ppingRat
eDesiredShi
=
The “MaximalShippingRate” is determined by “FinishedProduct” and “Minimal-
ProcessingTime”:
46 Zhao, Jeng, An, Cao, Bryant, Hauser, & Tao
Copyright © 2007, Idea Group Inc. Copying or distributing in print or electronic forms without written permis-
sion of Idea Group Inc. is prohibited.
.
ecessingTimMi
nimalPro
oduc
t
FinishedPr
ppingRateMa
ximalShi
=
Finally, the “ShippingRate” is determined by “DesiredShippingRate” and “Maxi-
malShippingRate”:
( )
.,min ppingRateMaximalShippingRateDesiredShiteShippingRa =
An SDM tends to represent a deterministic model and is used to study the overall
behavior in a certain given timescale. Compared to the business-process model, the
SDM aims to cover the detailed product-shipping activities by mimicking real-world
events on a smaller scale. The assigned values in an SDM can be obtained from the
simulation results of the business-process model or the average of the real data that
are identied in the business artifacts of the business-process model.
We give a few more examples of how to synthesize low-level metrics to meet overall
service requirements. The stock “Finished Product” is increased through the activity
“Make Product” by using “Product Demand” that comes from “Forecast Demand”
and “Adjust Product Based on Finished Product.” The forecast model we have here
is the exponential smoothing of historical data:
)
,
(
orSm
oothFact
Dem
andRate
Sm
ooth
m
andRate
Sm
oothed
De
=
,
where the function smooth is one of the built-in functions in the SDM tool. The
adjustment from “Finished Product” introduces a negative feedback loop to rebal-
ance the amount of products we should assemble:
.
*
imedjustmentTInventoryA
odu
ctFinish
ed
Prory
du
ctInventDesire
dP
ro
mandRateSmoothedDeeemblingRatDesiredAss
rageentoryCoveProductInvmandRatesmoothedDeoryductInventDesiredPro
−
+=
=
The real assembling rate could be delayed:
.),( DelayTimeeemblingRatDesiredAssDelayFixedRateAssembling =
The part usage rate is transformed from “Assembling Rate” using “Bill of Mate-
rial”:
Aligning Business Processes with Enterprise Service Computing Infrastructure 47
Copyright © 2007, Idea Group Inc. Copying or distributing in print or electronic forms without written permission
of Idea Group Inc. is prohibited.
( )
.),(
][*],[][
orSmoothFactatePartUsingRSmoothteedDemandRaPartSmooth
jRateAssemblingjirialBillOfMateiatePartUsingR
j
=
=
∑
The part demand, determining how much to order from suppliers, can be adjusted
based on “Part Inventory” (another negative feedback loop):
.
*
entTimeoryAdjustmPartInvent
oryPartInvent
dInventory
PartDesire
teedDemandRaPartSmoothatedDeliveryRPartDesire
eoryCoveragPartInventteedDemandRaPartSmoothdInventoryPartDesire
−
+=
=
In an SDM, the dynamics of a business process is captured through stock ow dia-
grams with dependency graphs and mathematical formulations (systems of ordinary
differential equations). A simulation of this system would expose its dynamic behavior
in the time dimension. Because of the complexity of the system with nonlinearity
and time delay, we may not be able to solve the system analytically. Based on avail-
able numerical methods for ordinary differential equations, like Euler’s rst-order
nite difference and the Runge-Kutta second- and fourth-order nite-difference
methods, the system can be solved numerically. Both Matlab (2005) and Vensim
(2005) provide such equation solvers. Furthermore, the tool provided by Vensim
helps modelers to determine visually what kind of action should be taken, such as
changing system settings.
Dynamic Adaption
Background
We live in a dynamic and fast-changing environment. The agility of an enterprise not
only depends on the sensibility of the management, but also on the responsiveness
of its IT infrastructure in line with the changes in the business environment. This is
the challenge to realize the so-called on-demand business (IBM, 2005c).
Primarily, there are two types of changes of business-level decisions that require the
IT infrastructure to respond quickly: functional and nonfunctional. As the result of
functional changes, the business-process model will change as well, for example,
acquiring an additional arc, an additional node, or a modied attribute value. Any
small adjustments to the business-process model potentially can change the proper-
48 Zhao, Jeng, An, Cao, Bryant, Hauser, & Tao
Copyright © 2007, Idea Group Inc. Copying or distributing in print or electronic forms without written permis-
sion of Idea Group Inc. is prohibited.
ties of the model as a whole. For instance, one more arc in the model could change a
reducible process model to an irreducible one. Thereafter, the generated BPEL code
should be updated accordingly. In general, it is not a good idea to regenerate the
whole business model upon any changes, especially for large-scale process models.
An algorithm is presented in the chapter that can scope and localize the changes so
that only the subprocess in the scope will be regenerated.
A nonfunctional alteration of the business-process model does not change the
properties of the process model, but reestablishes the linkage with the IT service
that implements the same functionality while offering a better QoS (quality of
service) value such as a higher response time and availability. We shall notice that
our criterion of categorizing functional and nonfunctional adaptation is mechanical
rather than semantic. To semantically verify whether the functionality of the process
model is changed is not computable or at least fuzzy if we use the techniques to
verify the process model against some formal functionality specication. Hence,
a revision of the structure of a process model in order to achieve a higher overall
QoS value, but with the same functionality, is categorized as a functional change
according to our criterion.
Both functional and nonfunctional adaptation can be performed statically or dynami-
cally. Static adaptation requires, in addition to a break in service availability, the
regeneration of executable code from the process model, reloading, redeployment,
Figure 12. An example ow graph from Aho et al. (2006)
1
2 3
a b
c
4
d e
5
6
f g
7
i
j
h
8
k
10
9
n
m
q
o
p
Aligning Business Processes with Enterprise Service Computing Infrastructure 49
Copyright © 2007, Idea Group Inc. Copying or distributing in print or electronic forms without written permission
of Idea Group Inc. is prohibited.
and a relinking with remote IT services. In some mission-critical scenarios such
as nance and military applications, there is a need for a continuous guarantee of
service availability. Dynamic adaptation manipulates a business process in its IT-
infrastructure run-time environment while maintaining the availability of services.
Later, we discuss our experiment by using a technique that enables the dynamic
adaptation of business processes running in the Microsoft .NET
®
(Microsoft, 2005)
Web-service environment.
Localize the Changes
The main theory used to achieve change localization in a process model is the
concept of a two-terminal region from control ow-graph analysis (Allen, 1970) in
compiler theory. We start by introducing several relevant denitions.
Denition 2. Given a ow graph G with initial node N
0
and a node N of G, the
interval with header N, denoted I(N), is dened as follows (Aho et al., 2007):
1. N is in I(N),
2. if all the predecessors of some node M≠N
0
are in I(N), then M is in I(N),
and
3. nothing else is in I(N).
The corresponding REL for this graph is ( (a c + b) (d( (f i + g j) (k [p n] mq)* h )
* (p + e ) )* n o ) *.
Based on Denition 2, we can obtain a set of intervals for Figure 12 as follows:
I(1) = {1, 2}
I(3) ={3}
I(4) ={4, 5, 6}
I(7) ={7, 8, 9, 10}.
One distinguished property of intervals is that all the intervals in one ow graph
are disjoint.
A two-terminal region was originally dened as follows.
Denition 3. A two-terminal region is an interval with one exit node (Allen,
1970).
50 Zhao, Jeng, An, Cao, Bryant, Hauser, & Tao
Copyright © 2007, Idea Group Inc. Copying or distributing in print or electronic forms without written permis-
sion of Idea Group Inc. is prohibited.
Intuitively, our goal of localizing the changes in a process model is to locate some
regions within which changes do not affect other regions. Denition 3 does not
satisfy our needs as a lot of regions are excluded from it; for example, I(1) and
I(4) are not two-terminal regions. We thus adopted and modied the denition of
two-terminal regions from Koehler, Hauser, Sendall, and Wahler (2005), in which
two-terminal regions are used to partition the process model into subgraphs so that
different subgraphs can be analyzed and transformed using different algorithms
based on their specic properties. In fact, the denition of a two-terminal region
in Koehler et al. results in different sets from that of Allen (1970); the denition
we give in this chapter yields different sets from both Allen and Koehler et al. It is
not our intention to compare the detailed differences in this chapter. Therefore, we
straightly give our denition.
Denition 4. Node N dominates (or predominates) node M if every path from the
initial node of the ow graph to M goes through N (Aho et al., 2007).
Denition 5. Node N postdominates node M if every path from M to the exit node
goes through N (Allen, 1970).
Denition 6. A two-terminal region is a subgraph TTR(N,M) between N and M
such that:
1. N predominates all nodes in the region, and
2. M postdominates all nodes in the region.
Based on Denition 6, we can obtain a set of two-terminal regions of Figure 12 as
follows:
TTR(1, 3) ={1, 2, 3}
Figure 13. The correspondence of REL constructs and two-terminal regions
( ( a c + b ) ( d ( ( f i + g j ) ( k [p n] m q )* h )* ( p + e ) )* n o ) *
TTR(1,3)
TTR(3,4)
TTR(7,8)
TTR(4,7)
TTR(4,8)
TTR(3,8)
TTR(1,9)
Aligning Business Processes with Enterprise Service Computing Infrastructure 51
Copyright © 2007, Idea Group Inc. Copying or distributing in print or electronic forms without written permission
of Idea Group Inc. is prohibited.
TTR(3, 4) ={3, 4}
TTR(4, 7) ={4, 5, 6, 7}
TTR(7, 8) ={7, 8, 10}
TTR(4, 8) = TTR(4,7) ∪ TTR(7,8)
TTR(3, 8) =TTR(3,4) ∪ TTR(4,8)
TTR(1, 9) =TTR(1,3) ∪ TTR(3, 8) ∪ {9}.
Different from intervals, two-terminal regions can be nested within each other or
overlap with their entry or exit nodes. Now we are ready to dene change localiza-
tion.
Proposition 1.
Changes can be localized into the closest enclosing two-terminal
region if and only if the changes only affect the nodes (other than the entry or exit
nodes) of this region.
Intuitively, a two-terminal region is a subgraph where everything coming from the
outside of the region into the region goes through the entry node, and everything
going from the inside of the region to the outside goes through the exit node. In REL
(and hence in BPEL), a two-terminal region thus corresponds to a single construct.
Shown in Figure 13, TTR(1, 3) corresponds to an “or” construct in REL and hence
Figure 14. The overview of the dynamic updating approach
Event
CLR
BPEL
BizTalk server
.Net a
pp
lication
CIL
Native code
Execution unit
Control unit
Inference en
g
ine
Profiler
Hook
AAR
Weave
Chan
g
e
Install
Check
Initialize Inject
advice
52 Zhao, Jeng, An, Cao, Bryant, Hauser, & Tao
Copyright © 2007, Idea Group Inc. Copying or distributing in print or electronic forms without written permis-
sion of Idea Group Inc. is prohibited.
a “switch” construct in BPEL; TTR(7, 8) corresponds to a “star” construct in REL
and hence a “while” construct in BPEL. Proposition 1 tells us to localize the changes
onto one single construct. In implementation, a single construct is represented by
a single syntax-tree node, therefore the adaptation is as easy as replacing a single
syntax-tree node. To give an example, suppose the node 2 in Figure 12 has a self-
loop denoted by letter x. Only TTR(1, 3) will be changed to (a x* c+b); the rest of
the REL sentence remains the same.
Dynamic Updating
Dynamic updating requires the manipulation of the low-level run-time environment.
Our rst experiment was performed on the Microsoft .NET
®
Web-service environ-
ment. We only sketch out our infrastructure for this experiment in this section.
Detailed discussion on this technique that was originally proposed for dynamic
Web-service composition and provisioning can be found in Cao, Bryant, Liu, and
Zhao (2005) and Cao, Bryant, Raje, et al. (2005).
Figure 14 provides an overview of the dynamic updating infrastructure. In the left
pane of the execution unit, the generated BPEL is imported into the Microsoft Bi-
zTalk
®
Server (Microsoft, 2004) that is built on top of the .NET framework. .NET
applications run over the common language runtime (CLR) environment where the
.NET application is captured in the form of the common intermediate language (CIL;
Gough, 2002). CIL code is just-in-time (JIT) compiled into native code and executed.
Therefore, by manipulating CIL, a BPEL process can be adapted at run time.
The manipulation of CIL is illustrated in the right pane of the control unit. An in-
ference engine detects changes from the model-editing environment and computes
the location for new-code insertion. The manipulation of CIL at run time requires
the interception of the managed execution. Instead of reimplementing the CLR,
such as rewriting the open-source CLR Rotor (Stutz, Neward, & Shilling, 2003)
to invasively add a listener for execution interception, compromising the portabil-
ity of CLR, we use a pluggable, congurable CLR proling interface (Microsoft,
2002) to achieve this goal, which can be enabled and disabled based on different
needs. In contrast to the conventional publisher-listener model, which is often a
client-server relationship, the proler will be mapped into the same address space
for the proled application as an in-process server. The proler can be initiated by
the inference engine. The events generated from the CLR are the result of managed
execution, including but not limited to garbage collection, class loading and unload-
ing, CLR start-up and shutdown, and JIT compilation. The event of our interest is
JIT compilation, for which we have implemented in-memory CIL manipulation for
the event handler. The adapted CIL is then JIT compiled and executed, resulting in
changed business-process behavior.
Aligning Business Processes with Enterprise Service Computing Infrastructure 53
Copyright © 2007, Idea Group Inc. Copying or distributing in print or electronic forms without written permission
of Idea Group Inc. is prohibited.
At the execution level, the functional and nonfunctional adaptations have the same
mechanical effects and thus are not distinguished by the run-time adaptation system:
Functional adaptation requires a replacement of a single construct that corresponds
to a modied subprocess, and nonfunctional adaptation requires a replacement of
a specic Web-service invocation statement. In some occasions, a construct need
not be removed, but instead needs to be decorated and enriched to realize changes
such as the addition of a new variable, security and access control, or a changed
local business rule.
Because we only need two updating operations—replacement and decoration—we
use the idea of aspect-oriented programming (AOP; Kiczales et al., 1997) to perform
CIL-code manipulation. The reference engine can dynamically inject the predened
reusable adaptation advice in the compiled managed code form into the adaptation
advice repository (AAR). The AAR is located in shared memory for fast access
during in-memory CIL manipulation. The hook code, installed on demand by the
proler, will weave into CIL the applicable adaptation advice. There are three
types of advice: before advice, after advice, and around advice. The before advice
performs some preprocessing before the actual method execution, while the after
advice performs some postprocessing immediately before the method execution
returns. Both the before and after advice are for method decoration. The around
advice is used for overriding original constructs or methods. Also included in the
hook code are the instructions to check for whether an around advice is specied
or not, and whether there is a jump instruction to redirect the execution to the exit
point of the specic block if an around advice is specied.
Conclusion and Future Trends
The theme of this chapter is to bridge the gap between business operations and IT
execution. We have explained this connection from three different perspectives:
(a) how to transform business decisions into IT-level execution, (b) how to moni-
tor IT execution and synthesize IT metrics to meet business-level commitments,
and (c) how to quickly and dynamically update IT execution when business-level
decisions change.
It is an emerging trend that companies are realizing the importance of business-pro-
cess management, integration, and monitoring. SLA management also catches many
enterprises’ attention. Based on this demand, big players in consulting services and
software tool construction have invested energy into tools and software for busi-
ness-process management and SLA management, for example, IBM WebSphere
Business Integration Modeler, the Microsoft BizTalk server, Oracle BPEL Process
Manager (Oracle, 2005), and ARIS Design Platform (IDS-Scheer, 2005) in coop-
54 Zhao, Jeng, An, Cao, Bryant, Hauser, & Tao
Copyright © 2007, Idea Group Inc. Copying or distributing in print or electronic forms without written permis-
sion of Idea Group Inc. is prohibited.
eration with SAP NetWeaver
®
(2006). It is important to establish communication
between academic researchers and industry tool builders to stimulate new research
topics and at the same time to disseminate research results into the real world.
There are still many open research problems such as novel model-transformation
techniques, business-process-model analysis and optimization techniques, and round-
trip (from modeling, execution, and monitoring to model modication) engineer-
ing. Part of our future work is to design a set of static model-analysis techniques
based on the mechanical power of REL, similar to static analysis performed when
a computer program is compiled. Those static analysis techniques could become
an excellent resource for static model optimization.
References
Agrawal, A., Karsai, G., & Shi, F. (2003). Graph transformations on domain-spe-
cic models (Tech. Rep. No. ISIS-03-403). Vanderbilt University, Institute
for Software Integrated Systems. Retrieved from derbilt.
edu/view.asp?GID=846&CAT=4
Aho, A. V., Lam, M. S., Sethi, R., & Ullman, J. D. (2007). Compilers-principles,
techniques, and tools (2nd ed.). Addison-Wesley.
Akehurst, D. H., & Kent, S. (2002). A relational approach to dening transforma-
tions in a metamodel. Proceedings of UML 2002, (pp. 243-258).
Allen, F. (1970). Control ow analysis. ACM SIGPLAN Notices, 5(7), 1-19.
An, L., & Jeng, J. J. (2005). Web service management using system dynamics.
Proceedings of the 2005 IEEE International Conference on Web Services
(ICWS), (pp. 347-354).
An, L., Jeng, J. J., Ettl, M., & Chung, J. Y. (2004). A system dynamics framework
for sense-and-response systems. Proceedings of the IEEE International Con-
ference on E-Commerce Technology for Dynamic E-Business (CEC-East’04),
(pp. 6-13).
An, L., & Ramachandran, B. (2005). System dynamics model to understand demand
conditioning dynamics in supply chain. Proceedings of the 23rd International
Conference of the System Dynamics Society. Retrieved from -
temdynamics.org/conf2005/proceed/papers/AN140.pdf
Andries, M., Engels, G., Habel, A., Hoffmann, B., Kreowski, H J., Kuske, S., et
al. (1999). Graph transformation for specication and programming. Science
of Computer Programming, 34(1), 1-54.
Bitpipe. (2005). Retrieved from />Services.html
Aligning Business Processes with Enterprise Service Computing Infrastructure 55
Copyright © 2007, Idea Group Inc. Copying or distributing in print or electronic forms without written permission
of Idea Group Inc. is prohibited.
BPMI. (2005). Retrieved from />BPMN specication. (2004). Retrieved from />BPMN%20V1-0%20May%203%202004.pdf
Business process execution language for Web services, version 1.1. (2003). Retrieved
from />Cao, F., Bryant, B. R., Liu, S H., & Zhao, W. (2005). A non-invasive approach to
dynamic Web service provisioning. Proceedings of the 2005 IEEE International
Conference on Web Services, (pp. 229-236).
Cao, F., Bryant, B. R., Raje, R. R., Olson, A. M., Auguston, M., Zhao, W., et
al. (2005). A non-invasive approach to assertive and autonomous dynamic
component composition in service-oriented paradigm. Journal of Universal
Computer Science, 11(10), 1645-1675.
Carter, L., Ferrante, J., & Thomborson, C. (2003). Folklore conrmed: Reducible ow
graphs are exponentially larger. Proceedings of the 30
th
ACM SIGPLAN-SIGACT
Symposium on Principles of Programming Languages, (pp. 106-114).
Cleaveland, J. C. (2001). Program generators with XML and JAVA. Prentice Hall.
Cocke, J., & Miller, E. R. (1969). Some analysis techniques for optimizing com-
puter programs. Proceedings of the 2nd Hawaii International Conference on
Systems Sciences (HICSS), (pp. 143-146).
Codagen Architect 3.0. (2006). Retrieved from />architect/default.htm
Compuware. (2005). OptimalJ. Retrieved from />ucts/optimalj/
Czarnecki, K., & Helsen, S. (2003). Classication of model transformation approaches.
Proceedings of the OOPSLA 2003 Workshop on Generative Techniques in the
Context of Model-Driven Architecture. Retrieved from terloo.
ca/~kczarnec/ECE750T7/czarnecki_helsen.pdf
Denning, P. J., Dennis, J. B., & Qualitz, J. E. (1978). Machines, languages, and
computation. Prentice-Hall, Inc.
Diao, Y., Hellerstein, J. L., Parekh, S., & Bigus, J. P. (2003). Managing Web server
performance with AutoTune agents. IBM Systems Journal, 42(1), 136-149.
Forrester, J. W. (1961). Industry dynamics. Cambridge, MA: MIT Press.
Gamma, E., Helm, R., Johnson, R., & Vlissides, J. (1995). Design patterns: Ele-
ments of reusable object-oriented software. Addison-Wesley.
Gough, J. (2002). Compiling for the .NET common language runtime (CLR). Pren-
tice Hall PTR.
Hoffner, Y., Field, S., Grefen, P., & Ludwig, H. (2001). Contract-driven creation
and operation of virtual enterprise. Computer Networks, 37, 111-136.
56 Zhao, Jeng, An, Cao, Bryant, Hauser, & Tao
Copyright © 2007, Idea Group Inc. Copying or distributing in print or electronic forms without written permis-
sion of Idea Group Inc. is prohibited.
IBM. (2005a). Rational Software Architect. Retrieved from .
com/software/awdtools/architect/swarchitect/index.html
IBM. (2005b). WBI Modeler. Retrieved from />integration/wbimodeler/
IBM. (2005c). The who, what, when, where, why and how of becoming an on
demand business. Retrieved from />ness/ondemand/us/pdf/ExecGuide1214.pdf
IDS-Scheer. (2005). ARIS design platform. Retrieved from -scheer.
com/international/english/products/aris_design_platform/49623
Janssen, J., & Corporall, H. (1997). Making graphs reducible with controlled node
splitting. ACM Transactions on Programming Languages and Systems, 19(6),
1031-1052.
Keller, A., Kar, G., Ludwig, H., Dan, A., & Hellerstein, J. L. (2002). Managing
dynamic services: A contract based approach to a conceptual architecture.
Proceedings of the 8th IEEE/IFIP Network Operations and Management
Symposium (NOMS) (pp. 513-528).
Kiczales, G., Lamping, J., Mendhekar, A., Maeda, C., Videira Lopes, C., Loingtier, J.
M., et al. (1997). Aspect-oriented programming. Proceedings of the European
Conference for Object-Oriented Programming (ECOOP) (pp. 220-242).
Koehler, J., Hauser, R., Sendall, S., & Wahler, M. (2005). Declarative techniques
for model-driven business process integration. IBM Systems Journal, 44(1),
47-65.
Kong, R. (2005). Transform WebSphere business integration modeler process models
to BPEL (Tech. Rep.). IBM Toronto. Retrieved from tware.
ibm.com/ibmdl/pub/software/dw/wes/pdf/0504_kong_transform_bpel.pdf
Kumaran, S., & Nandi, P. (2003). Adaptive business object: A new component model
for business applications (White paper). IBM T. J. Watson Research Center.
Retrieved from />Mantell, K. (2003). From UML to BPEL: Model driven architecture in a Web ser-
vices world (Tech. Rep.). IBM Corp. Retrieved from .
com/developerworks/webservices/library/ws-uml2bpel/
Matlab. (2005). Retrieved from
Microsoft. (2002). Common language runtime proling.
Microsoft. (2004). Understanding BizTalk Server 2004 (White paper). Retrieved
from />BTS2004IS/htm/understanding_abstract_syfs.asp?frame=true
Aligning Business Processes with Enterprise Service Computing Infrastructure 57
Copyright © 2007, Idea Group Inc. Copying or distributing in print or electronic forms without written permission
of Idea Group Inc. is prohibited.
Microsoft. (2005) .Net. Retrieved from />Nainani, B. (2004). Closed loop BPM using standards based tools (Tech. Rep.).
Oracle Corp. Retrieved from />bpel/pdf/bpm.closedloop.pdf
Nigam, A., & Caswell, N. S. (2003). Business artifacts: An approach to operational
specication. IBM Systems Journal, 42(3), 428-445.
Oracle. (2005). BPEL process manager. Retrieved from />technology/products/ias/bpel/index.html
SAP NetWeaver. (2006). Retrieved from />index.epx
Schach, S. (2005). Object-oriented and classical software engineering (6
th
ed.).
McGraw-Hill.
Sterman, J. D. (2000). Business dynamics: System thinking and modeling for a
complex world. Irwin McGraw-Hill.
Sterman, J. D. (2002). System dynamics modeling: Tools for learning in a complex
world. IEEE Engineering Management Review, 30(1), 42-52.
Stutz, D., Neward, T., & Shilling, G. (2003). Shared source CLI: Essentials. O’Reilly
Press.
UML 2.0 superstructure nal adopted specication. (2003). Retrieved from http://
www.omg.org/cgi-bin/doc?ptc/2003-08-02
Vensim. (2005). Retrieved from />Zhao, W., Bhattacharya, K., Bryant, B. R., Cao, F., & Hauser, R. (2005). Trans-
forming business process models: Enabling programming at a higher level.
Proceedings of the 2005 IEEE International Conference on Services Comput-
ing (SCC) (pp. 173-180).
Zhao, W., Bryant, B. R., Cao, F., Hauser, R., Bhattacharya, K., & Tao, T. (in press).
Transforming business process models in the presence of irreducibility and
concurrency. International Journal of Business Process Integration and
Management.
Zhao, W., Hauser, R., Bhattacharya, K., Bryant, B. R., & Cao, F. (2006). Compiling
business processes: Untangling unstructured loops in irreducible ow graphs.
International Journal of Web and Grid Services, 2(1), 68-91.
58 vom Brocke
Copyright © 2007, Idea Group Inc. Copying or distributing in print or electronic forms without written permis-
sion of Idea Group Inc. is prohibited.
Chapter III
Service Portfolio
Measurement (SPM):
Assessing Financial
Performance of Service-Oriented
Information Systems
Jan vom Brocke,
European Reseach Center for Information Systems (ERCIS),
University of Münster, Germany
Abstract
This chapter addresses service-oriented information systems from a management
perspective. It is evident that running a service-oriented enterprise brings up new
challenges for management. Given the technological opportunities, the challenge
lies essentially in choosing the right mix of services on the basis of an appropriate
architecture. For this purpose, strategic considerations regarding, for example, the
company’s exibility have to be justied by nancial performance measures. This is
particularly evident as long-term economic consequences result from decisions on
the service portfolio. Thus, evidence is required about the fact that these decisions
are in alignment with the company’s nancial situation. The total costs of ownership
(TCO) caused by a particular service-oriented information system, as well as the
Service Portfolio Measurement (SPM) 59
Copyright © 2007, Idea Group Inc. Copying or distributing in print or electronic forms without written permission
of Idea Group Inc. is prohibited.
return on investment (ROI) gained by it, give examples for appropriate nancial
performance measures. In this chapter, a measurement system is presented that fa-
cilitates the assessment of the various nancial consequences within a comprehensive
framework. The system is grounded in decision theory and capital budgeting, and
it is illustrated by its application within practical examples.
The Challenge of Managing
Service-Oriented Information Systems
In today’s markets, enterprises are increasingly forced to act exibly. To do so,
there is a distinct trend for enterprises to concentrate on core competences in order
to gain strategic competitive advantages. As a precondition, information systems
are required that incorporate means to support this exibility. For this purpose, the
concept of enterprise service computing offers promising ways to design a company’s
information system. In service-oriented architectures (SOAs; Loh & Venkatraman,
1992; Weikum & Vossen, 2002), processes of an information system can be extracted
and out-tasked to service providers. According to Keen and McDonald (2000),
“Out-tasking…breaks a company into a portfolio of process-centred operations
rather than interlocking departments or functions.”
The deployment of service-enterprise computing puts companies in a position to
concentrate on their core competences by sourcing out parts of a process to service
providers. In contrast to conventional outsourcing, out-tasking enables the companies
to keep control of the entire process at the same time (vom Brocke & Lindner, 2004).
According to Forrester, companies with a service-oriented architecture can reduce
costs for the integration of projects and maintenance by at least 30% (Vollmer &
Figure 1. Positioning out-tasking as a sourcing strategy
Commodity
Critical
Differentiator
Useful
Commodit
y
Outsource
Useful
Contribution of IT Activity to
Business Positioning
Useful
Differentiator
Eliminate or
Migrate
Critical
Commodit
y
Best Source
Critical
Differentiator
Insource
Contribution
of IT Acitivty
to Business
Operations
60 vom Brocke
Copyright © 2007, Idea Group Inc. Copying or distributing in print or electronic forms without written permis-
sion of Idea Group Inc. is prohibited.
Gilpin, 2004). Major providers of ERP systems incorporate service-oriented archi-
tectures in their solutions: Sonic ESB by Sonic Software (Craggs, 2003), mySAP
Business Suite by SAP (2004), e-Business on Demand by IBM (2004), and the
Application Server by Oracle (2004). As a future trend, Gartner (2002) predicts
that by 2007, most company frameworks will have changed to service-oriented
architectures (Farber, 2004).
In order to differentiate outsourcing from various sourcing strategies, a framework
provided by Lacity, Willcocks, and Feeny (1996) can be applied.
The approach aims at structuring business processes according to characteristics
that are relevant for sourcing decisions. In particular, two dimensions are applied:
the importance of activities for the operation of business processes and its contribu-
tion to strategic business positioning. Against the background of the approach, the
following service categories can be differentiated.
• Critical differentiators: Tasks of high strategic and operative relevance are
suggested to be fully in-sourced. An outsourcing of these tasks would result
in a loss of know-how and innovation potential, and would threaten core
competences.
• Useful commodities: Tasks that are neither strategically nor operatively out-
standing are candidates to be fully outsourced. In these situations, the potential
of reducing costs by aid of outsourcing can likely be realised.
• Useful differentiators: For tasks that are considered to be highly relevant for
strategic differentiation but that show little relevance in operational business,
neither in- nor outsourcing is recommended. They should be eliminated sooner
or later.
• Critical commodities: Tasks that are customary in trade but show little strategic
relevance should be controlled inside but operated outside the company. That
way, the positive effects of specialisation can be realised (Quinn, 1999).
As for the model, out-tasking especially offers potentials for the case of critical com-
modities. In this respect, out-tasking can be considered as the realisation of a best
sourcing strategy that is rendered possible by aid of service-oriented architectures.
In order to be able to use technological opportunities for the support of business
strategies, new management tasks are arising in information-systems science.
As information systems offer means to outsource services, the question arises of
which combination of the various services available should be chosen for the specic
needs of a company. For that purpose, appropriate service-portfolio management is
required. On the whole, this means that a management process has to be established
for the appropriate composition of a corporate service portfolio. In order to sup-
Service Portfolio Measurement (SPM) 61
Copyright © 2007, Idea Group Inc. Copying or distributing in print or electronic forms without written permission
of Idea Group Inc. is prohibited.
port management, methods for performance measurement of a company’s service
portfolio are required (Kaplan & Norton, 1992). In this chapter, these methods are
referred to as service-portfolio measurement (SPM).
In service-portfolio measurement, multiple perspectives of the protability of
service-oriented information systems have to be taken into account. This can, for
example, be seen from the work of Kaplan and Norton (1992, 1996). They have
illustrated that corporate management should not only reect nancial aspects, but
also nonnancial ones as the performance in these dimensions eventually drives the
nancial results (Johnson & Kaplan, 1987; Kaplan, 1986; Neely, 2004). Accord-
ingly, preliminary works that may be used in service-portfolio measurement can
be differentiated regarding their perspectives on nancial and nonnancial aspects.
With respect to both aspects, related works can be found in the eld of decision
support for outsourcing, which has in part already been transferred to service-ori-
ented computing.
• Nonnancial assessments: Nonnancial assessments are essentially based on
argumentations, partly structured by means of pros and cons lists (Knolmayer,
1997), checklists (Buck-Lew, 1992; Kador, 1990; Kascus & Hale, 1995), ana-
lytical hierarchy process models (Putrus, 1992), and owcharts (Knolmayer).
These approaches give a good basis for path-leading decisions on informa-
tion-systems design. For decision making, however, a stronger methodological
foundation is required. Such a foundation can be found in studies assessing
the quality of service (QoS) in service-oriented enterprises (Cardoso, Sheth,
Miller, Arnold, & Kochut, 2004; Wang, Chen, Wang, Fung, & Uczekaj, 2004).
These contributions can well be used for operational service discovery and
process control. However, they do not provide decision support for nding
the most protable mix of services within the company’s portfolio. For this
purpose, nancial approaches are additionally required.
• Financial assessments: Financial assessments focus on cost analyses, such
as special task comparisons (Espinosa & Carmel, 2004), multitask cost com-
parisons, and holistic cost-risk comparisons (Aubert, Patry, & Rivard, 2002;
Bahli & Rivard, 2003; Jurison, 2002). Special work in the eld of costs of
Web services has been carried out in the eld of service detection and com-
position with a rather operational focus (Cardoso et al., 2004; Day & Deters,
2004). The main disadvantage of these approaches, however, is that they are
built on a cost basis and, thereby, apply a measurement system for short-term
planning. Decisions on the information-systems architecture, however, drive
long-term economic consequences. Apart from system payments, inuences
on payments related to interests and taxes also have to be taken into account
during the information system’s life cycle. Thus, methods of capital budgeting
have to be applied (Grob, 1993; Seitz & Ellison, 2004; Shapiro, 2004).
62 vom Brocke
Copyright © 2007, Idea Group Inc. Copying or distributing in print or electronic forms without written permis-
sion of Idea Group Inc. is prohibited.
A rst approach to apply capital budgeting in service-oriented computing has re-
cently been presented (vom Brocke & Lindner, 2004). In this work, the monetary
consequences of a service-oriented architecture are evaluated and opposed to those
of conventional architectures. This approach can well be used as a methodological
basis in order to develop a performance-measurement system for service-oriented
information systems. An essential requirement of design is to consider the various
different congurations of services in the measurement system that are applicable
from different service providers with various conditions in pricing and service levels.
This gives ground for decisions on sourcing strategies and thereby facilitates the
nding of the most adequate mix of services for an enterprise.
In this chapter, design principles of an appropriate measurement system for the
nancial performance of service portfolios will be presented. In order to nd these
principles, a design-science approach is applied (Hevner, March, Park, & Ram,
2004). Hence, the concept of an appropriate measurement system is introduced on
the basis of basic principles of decision theory and capital budgeting. The system is
then applied in a practical example that serves as a proof of concept. Finally, major
results as well as limitations are summed up and further research is pointed out.
A Measurement System for Financial Performance
of Service-Oriented Information Systems
Framework
The decision-support system is mainly structured in two dimensions that are in-
tegrated: the level and the subject of calculation. The framework of the system is
displayed in Figure 2 and will be illustrated in the following.
The system has three levels of evaluation: the process level, the budgeting level, and
the corporate level. The process level provides a basis for the entire evaluation. On
this level, payments (out-payments) and receivables (in-payments) brought about
by the information-system design are analysed. On the budgeting level, additional
parameters are taken into account. These are relevant for judging the economic value
created by series of payments. Relevant parameters are derived from the specic
conditions of funding and taxes that a company has to face. These series of pay-
ments are consolidated over time by applying methods from capital budgeting. That
way, a survey of nancial consequences is created. Finally, on the corporate level,
the protability of the information-system design has to be compared to alternative
investments available for the company. Measures like the total cost of ownership
(TCO) and the return on investment (ROI) help one to consider relevant parameters
for this purpose (Seitz & Ellison, 2004; Shapiro, 2004).
Service Portfolio Measurement (SPM) 63
Copyright © 2007, Idea Group Inc. Copying or distributing in print or electronic forms without written permission
of Idea Group Inc. is prohibited.
In order to use this methodological framework as a decision-support system for the
management of service-oriented information systems, special subjects of measure-
ment have to be taken into account. Essentially, these are the architecture and the
services applied in a company’s information system. For each subject, different
types of payments have to be considered on the process level. With respect to the
architecture, payments for development, operation, adaptation, and disintegration
of a certain architectural design have to be considered. These payments set a long-
term frame for short-term payments that are driven by a certain service portfolio
that a company is running on the basis of the architecture. Each service available
for a company within a certain process has to be evaluated and specied within the
decision-support system. The evaluation is based on payments, taking into account
various pricing models of services. This also comprises the operational availability
of the service due to various service-level agreements. Thanks to the specic evalu-
ation of each service, varied congurations of the service portfolio can be sampled
by management. The alternative conguration can hence be compared, and the most
protable one can be chosen for a company’s situation.
Once the payments are planned on the process level, both the architecture and the
services are calculated by the same methods on both the budgeting and the corporate
level. In the framework of the system, this is indicated by giving the upper levels the
shape of a roof. In addition, the same shape shows that the payments are gradually
aggregated until the nancial performance of the company’s information-system
design is indicated by common nancial measures. Within this integrated design,
the decision-support system can also be used partly to support special-interest
Figure 2. Framework of the decision-support system for service-portfolio measure-
ment
In- and out-payments
coming along with the information
system design during the life-cycle
Process Level
Economic value
created by series of payments
aggregated over time
Budgeting Level
Performance
measures for
decision support
Corporate
Level
A
r
c
h
i
t
e
c
t
u
r
e
S
e
r
v
i
c
e
s
64 vom Brocke
Copyright © 2007, Idea Group Inc. Copying or distributing in print or electronic forms without written permis-
sion of Idea Group Inc. is prohibited.
calculations. The arrows on the right of the framework describe typical measure-
ment processes in which, for example, separate calculations of alternative portfolio
congurations are carried out.
Measurement on the Process Level
The series of payments that are chargeable to a decision on the service portfolio
should be analysed from a life-cycle perspective. Figure 3 gives a general structure
of the life cycle of information systems applying a service portfolio.
The phases of the life cycle will be introduced below by means of analysing char-
acteristic out-payments and in-payments to be considered in each phase. In order
to identify these payments, essentially two approaches can be distinguished: total
or partial calculation. According to a total calculation, all payments chargeable to
an information system applying a certain service portfolio have to be accumulated.
The total calculation tends to be rather complex, but offers a great exibility of
calculation as various alternatives can be compared with each other. For a partial
calculation, on the contrary, only additional payments that are relevant in compari-
son to two alternative solutions are calculated. Partial calculation reduces the scale
of the computation. However, the assessment is limited to the pair of alternatives
selected.
For choosing between a partial or total approach of assessing the payments on the
process level, the specic situation of the company has to be considered. In general,
different situations have to be analysed regarding the assessment of the architecture
and the services. Information about relevant types of payments is given by work in
the eld of the cost analysis of information systems (Faye Borthick & Roth, 1994;
Gartner, 2002; Tam, 1992).
Figure 3. Life cycle of a service portfolio
Phase of
Development
Phase of
Operation
Phase of
Adaptation
Phase of
Disintegration
Service Portfolio Measurement (SPM) 65
Copyright © 2007, Idea Group Inc. Copying or distributing in print or electronic forms without written permission
of Idea Group Inc. is prohibited.
Payments Related to the Architecture
With respect to the information-systems architecture, two typical context situations
have to be distinguished: projects for new information systems and projects for the
redesigning of information systems. In the case of designing a new system, a total
calculation may be undertaken in order to compare a wide range of alternatives.
In case of a redesign, on the contrary, payments for setting in place the existing
architecture are not relevant for decision making. They have to be considered as
so-called sunk costs. Thus, a partial assessment appears to be adequate. As most
companies in fact run certain architectures already, they are actually concerned
with decisions on migrating toward service-oriented architectures. Hence, a partial
calculation will be conducted in the following.
Phase of Development
In analysing the series of payments brought about by a migration toward a ser-
vice-oriented architecture, payments related to purchasing hardware and software,
implementing the architecture, building up know-how, and those for administration
and support have to be considered. In-payments will hardly be occurring in this
phase. They can result from saving on labour by not implementing services that
are outsourced.
Considering the situation of a systems redesign, special aspects have to be considered.
As the tasks that are likely to be outsourced have been implemented already, the
payments driven by them are no more relevant for the out-tasking decision. They are
classied as so-called sunk costs. In addition, further out-payments brought about
by the work for redesigning have to be considered. As far as the functionality of
the information system is not extended, these payments are totally to be charged to
the out-tasking decision.
Phase of Operation
In TCO analyses, costs for the maintenance work on information systems and user
support are usually considered during operations (Faye Borthick & Roth, 1994).
Against this background, it can be argued that by out-tasking services, total pay-
ments for maintenance work are reduced by the equivalent for the work on these
services. In contrast, additional payments have to be considered for the maintenance
of the interfaces. Examples of this kind of maintenance work are adaptations to
new versions of exchange formats on both data and services. Correspondingly, the
payments related to support are derived. In addition, the implementation of a ser-
vice-oriented architecture offers the potential of modernising information systems.
66 vom Brocke
Copyright © 2007, Idea Group Inc. Copying or distributing in print or electronic forms without written permis-
sion of Idea Group Inc. is prohibited.
If legacy systems can be replaced by the purchase of an SOA, running costs would
consequently be cut. Savings would be rendered possible that would be calculated
as in-payments of an operational phase.
Another important effect, however, is neglected in most of the analyses: the ef-
ciency of business processes that are enabled by the information system. In order
to calculate these effects properly, Grob and vom Brocke (2005) suggest a method
in which process models are used in order to identify relevant in- and out-payments
brought about by a certain process design. According to this concept, out-tasking
creates the opportunity to reduce the resources that are needed for running the in-
formation system. In order to calculate the amount of savings that are chargeable
to a service, the values of all relevant resources as well as the rate at which they
are used have to be considered.
Further in-payments can be gained during the operation phase by sharing parts of the
information-systems architecture with partners. These partners can be found either
inside or outside the company. Due to increasing costs and risks of an information
system’s architecture, these cooperations are increasingly attractive for companies
in order to reach economies of scale. Therefore, service-oriented architectures
offer promising means for selective service sharing. Further in-payments may be
achieved as a wide range of partners can be involved in sharing information-system
services.
Moreover, specic payments to the service provider have to be considered during
the phase of operation. Both the amount of these payments as well as their distribu-
tion throughout the life cycle clearly vary according to the model of pricing that
has been agreed upon. Also, payments for general licensing agreements have to be
taken into account.
Phase of Adaptation
During the run time of an information system, adaptations will have to be made to
the system. These adaptations may be necessary in order to both implement new
services as well as to modify existing ones. Examples of drivers of such adaptations
are technological innovations and changing demands.
Depending on the information-systems architecture, different nancial consequences
of these adaptations have to be taken into account. In case parts of the system that
are run inside the company are affected, out-payments for the implementation of
changes to the system have to be charged. Relevant indicators are both the amount
of man months needed as well as the appropriate average cost rate to be calculated.
In case out-tasked services are affected, these payments might be saved. However,
it should be taken into account that the prices for the services provided might rise.