Enterprise service computing from concept_12 docx
Bạn đang xem bản rút gọn của tài liệu. Xem và tải ngay bản đầy đủ của tài liệu tại đây (792.75 KB, 30 trang )
312 Zhang, Chang, & Kim
Copyright © 2007, Idea Group Inc. Copying or distributing in print or electronic forms without written permis-
sion of Idea Group Inc. is prohibited.
Figure 11 and Figure 12 show the interconnection nets of the service components
commit engine and composer, respectively. The commit-engine service component
needs to invoke the enqueue service from the component method queue, and the
composer service component needs to invoke the dequeue service. Therefore, the
enqueue and dequeue services are represented as foreign transitions. Inscriptions
for the foreign transitions show that they are calling enqueue and dequeue services
from the service component message queue via SOAP.
After specifying individual service components in terms of the interface nets and
the interconnection nets, we are ready to visualize the entire topological view of a
system by interconnecting all of these WS-Net components. Firing a foreign transi-
tion means executing the corresponding service transition of the server component.
Therefore, connecting WS-Net components can be achieved by merging the ports
of the client service components with the ports of the server service components
after removing foreign transitions from the client service components. In our WS-
Net, we thus introduce a special kind of transition aiming at connecting ports. This
transition is called a connector transition, and it is named by a connector type. Figure
Figure 13. Unfolding interconnection net
A Petri Net-Based Specication Model Towards Veriable Service Computing 313
Copyright © 2007, Idea Group Inc. Copying or distributing in print or electronic forms without written permission
of Idea Group Inc. is prohibited.
13 shows the connected interconnection net that describes the entire information-
communication model by interconnecting the commit engine and the composer with
the message queue using SOAP connectors.
In summary, such an interconnection mechanism can be applied across different
levels of service-component diagrams. In detail, interconnections can be visualized
in two levels: (a) interoperation nets of client-server service components, and (b) the
folding and unfolding of interface nets of service components. This is an important
feature to visualize very large systems. By applying such visual abstractions, such
as replacing large interoperation nets with simpler interconnection nets or even
with interface nets, complicated nets can be effectively visualized at various levels
of abstraction.
Interoperation Net
The interoperation net describes the dynamic behaviors of a service component
by focusing on its operational nature. The goal of the interoperation net is to dis-
sect each service into fundamental process units, which, taken together, dene the
required functional contents of the service. This is similar to the SADT functional
decomposition, where each transition representing the operations of a component is
decomposed into subtransitions to represent fundamental operational states. One of
the most important differences between the decomposition in our interoperation net
and SADT is that the interoperation net uses decomposition as a means of express-
ing the behaviors of the services provided by an architectural service component
rather than functional decomposition for modularization as used in SADT. As in
SADT, the control ow and data ow are used to describe the interactions between
process units. Note that it is important to distinguish foreign transitions from detailed
processes. The foreign transitions along with plug-in places are used to interconnect
the interoperation nets to form the entire system view. Like other petri-nets-based
high-level design representations, places are used to represent the control or data,
and transitions are used to represent processes.
Chang and Kim (1999) found that the straightforward techniques converting functional
data ow to petri nets have a potential problem in repeated (persistent) simulations
of the nets. To solve this problem, in WS-Net, we distinguish persistent data from
transient data. Persistent places are represented as boldface circles. Persistent data
items are similar to the data attributes of a class in the object-oriented paradigm.
These persistent data items represent the state of a service component, and they
exist throughout the lifetime of the service component. On the other hand, transient
data items are produced by one process and are immediately consumed by another
process. Therefore, transient data items are created only when they are needed and
destroyed upon the completion of the service.
314 Zhang, Chang, & Kim
Copyright © 2007, Idea Group Inc. Copying or distributing in print or electronic forms without written permis-
sion of Idea Group Inc. is prohibited.
A service S
ij
∈ S
i
of service component C
i
can be denoted as follows:
S
ij
= (PI
ij
, PO
ij
, PT
ij
, PP
ij
, QI
ij
, QO
ij
, TL
ij
, TF
ij
, A
ij
, c, G, E, IN),
where PI
ij
and PO
ij
are the input and output ports, and PT
ij
and PP
ij
are a set of
transient data places and a set of persistent data places, respectively. TL
ij
is a set of
local transitions, and TF
ij
is a set of foreign transitions. QI
ij
is a set of input plug-in
places serving as input places for the foreign transitions, and QO
ij
is a set of output
plug-in places serving as output places for the foreign transitions. A
ij
is a set of
input and output arcs of the transitions. To describe the functional behaviors of a
component, we can use all the inscriptions used in CPN (Jensen, 1990). As before,
c is a color function to represent the color sets for the places. G is a guard function
for the transitions. E is an arc expression function, and IN is an initialization func-
tion for the tokens.
In our example, the message-queue service component has enqueue and dequeue
services. The control and data are represented by places, and processes are represented
by transitions. Figure 14 shows the rst phase of the interoperation description of
the message-queue component. The count and storage places are dened as persis-
Service Component Name: Queue
Enqueue
iport
item
Service Name:
Dequeue
Connector:
SOAP
Service Name: Enqueue
Connector:
SOAP
result
oport
Dequeue
iport
request
Dq_rslt
oport
count
store
Figure 14. First phase of Interoperation net for Queue
A Petri Net-Based Specication Model Towards Veriable Service Computing 315
Copyright © 2007, Idea Group Inc. Copying or distributing in print or electronic forms without written permission
of Idea Group Inc. is prohibited.
tent data and represented with boldface circles. Since the persistent data may exist
throughout the lifetime of a service component, we need to initialize the persistent
places with proper tokens for later simulations. Tokens in the transient places are
produced as a result of ring transitions. It is common for persistent data items to be
shared by other services in the same component. If different services use the same
persistent data, they need to be merged using the place-fusion technique dened
in high-level petri nets. As shown in Figure 14, count and storage are persistent
places of both the enqueue and dequeue services. By merging the persistent places
of the two services, the interoperation net for the message-queue component can
be completed.
As we further decompose the functional behaviors of each service, we can get a
more complex interoperation net. Figure 15 shows a more detailed interoperation net
of the service enqueue of the message-queue service component. First, the service
receives a request to insert a message into the message queue. Both the content
places and store place are checked for whether they are full before an item can be
inserted. If the store place is not full, the message can be inserted into the queue.
Then the service updates the full ag after the insertion of the message. A petri net
can be constructed by mapping each functional process into a transition, and input
and output into places. After all the interoperation nets of the architectural service
components are specied, we can again visualize the entire system topology by
connecting the plug-ins of the client service components with the ports of the server
components using the connector transitions.
Fi
gure
15. Inte
ropera
ti
on ne
t fo
r
Enqueue service
iport
item
Se
rvice Name
:
Enqueue
C
onnec
to
r
:
SOAP
Ge
t
Insert
Request
l i
value
Ch
eck
Full
reques
t
result
l flag
Check
Full
Check
Full
opo
rt
Check
Full
l i
va
lu
e
l flag
l f
lag
l flag
reque
st
resu
lt
st
oragecoun
t
item l flag
l f
lag
l i
value
l inde
x
l inde
x
l inde
x
l inde
x
l array
l array
reque
st
item
Figure 15. Interoperation net for Enqueue service
316 Zhang, Chang, & Kim
Copyright © 2007, Idea Group Inc. Copying or distributing in print or electronic forms without written permis-
sion of Idea Group Inc. is prohibited.
Connected interoperation nets can be executed under different input scenarios to
simulate the behaviors of a services-oriented system. The execution proceeds by
assigning initial tokens to the input ports. The execution traces can be visualized to
analyze the run-time quality attributes and to enhance communications with user
communities by providing an executable model of the system early in the develop-
ment process.
WS-Net-Based Formal Verication
We have introduced the basic concepts and specications of WS-Net. By using a
typical Web-services message process as an example, we illustrate how to model a
Web-services-oriented system into a hierarchical WS-Net. How to model a software
system using petri nets has already been extensively discussed in many other publica-
tions. In this section, we will introduce the mappings between Web-services concepts
and petri-net specications as general guidance for modeling Web-services-oriented
systems using petri nets. Figure 16 summarizes the mappings that are critical due
to the fact that petri nets do not explicitly support the concept of process.
As shown in Figure 16, Web services (i.e., service components and services provided)
are modeled using transitions. The input and output of a service are modeled by
Figure 16. Mapping between Web-services concepts and petri-net specications
Transient placeTransient data
Persistent placePersistent data
Transition
substitute
Hierarchy
Pl
ace fusion
Data sharing
Color
Signat
ur
e
TokenData
Inpu
t/ou
tput
places via
connect
or
Inte
ractio
n
Foreign transitionRequired service
Label
Name
Ou
tp
ut placeOu
tput
Inpu
t plac
eInput
Transition
Servic
e
Connect
orMessages
PN
concepts
WS c
oncepts
A Petri Net-Based Specication Model Towards Veriable Service Computing 317
Copyright © 2007, Idea Group Inc. Copying or distributing in print or electronic forms without written permission
of Idea Group Inc. is prohibited.
two kinds of places, namely, input places and output places, respectively. Messages
exchanging between Web services are modeled as connectors in petri nets. In order
to enhance readability, labels are used to identify Web services by names. If a Web
service requires other services as support, foreign transitions are used to model
supporting Web services. Thus, the message interactions between Web services are
modeled as data ow between input places and output places via connectors. In order
to handle complexity, transition substitution is used to fold and unfold hierarchical
services composition into modularized nets according to the architectural structure
of a system. In WS-Net, data are modeled by tokens. The concept of color is used
to specify the signature and types of data. Persistent data and transient data are dif-
ferentiated using persistent places and transient places. Data sharing between Web
services is modeled by the place-fusion concept in petri nets.
With the mapping mechanisms established, we can turn a Web-services-oriented
system into a petri-nets-based WS-Net able to be simulated. With this simulation, we
can detect and identify services-composition errors using the analysis mechanisms
provided by petri nets. The simulation of the executable system thus can be used
to verify the correctness of the system. The interconnection mechanism of WS-Net
enables analyzing complicated system composition at different granularities. As-
sociated with the interoperation net, WS-Net provides a structured way to zoom in
and out to analyze architectural system composition at various levels.
Using WS-Net, formal verication can be conducted at the design time of system
composition in order to detect potential composition errors at early stages, thus al-
lowing the correction of errors as early as possible. Particularly, WS-Net focuses
on analyzing important composition criteria, such as reachability, boundedness,
and liveness. By examining dead markings, we can verify the reachability of a
certain WS-Net, thus verifying whether certain composition protocols (i.e., rules)
are enforced and conformed. The state-space analysis can be carried out to detect
whether a deadlock possibly exists in the design of the services composition. The
visualization of the composition and interactions between Web-service components
helps engineers verify compositional message exchanges and synchronizations.
WS-Net analysis and simulation can start with an initial marking inputted into a
WS-Net model. Running the simulations, we can check whether the service com-
position will execute as expected, and whether the service composition conforms
to the conversational protocols between service components. Furthermore, different
markings can be used to feed the constructed WS-Net to verify system behaviors
under various situations.
318 Zhang, Chang, & Kim
Copyright © 2007, Idea Group Inc. Copying or distributing in print or electronic forms without written permis-
sion of Idea Group Inc. is prohibited.
Conclusion
In this chapter, we introduced an advanced topic of service computing: how to
formally verify Web-services-oriented system composition. We rst introduced the
basic concepts of services composition in the context of Web-services technologies.
Then we surveyed possible solutions and existing efforts for formally verifying
Web-services-oriented system composition. After comparing various options, we
introduced WS-Net, an executable petri-nets-based architectural description lan-
guage to formally describe and verify the architecture of a Web-services-oriented
system. The behaviors of such a model can be simulated to detect errors and allow
corrections and further renements. As a result, WS-Net helps enhance the reli-
ability of Web-services-oriented applications. Furthermore, it is compatible with
the object-oriented paradigm and component-based concepts. Supporting modern
software-engineering philosophies oriented to services computing, WS-Net provides
an approach to verify and monitor the dynamic integration of a Web-services-oriented
software system. Specication formalism in WS-Net is object oriented, executable,
expressive, comprehensive, and yet easy to use. A wide body of theories available
for petri nets is thus available for analyzing a system design. To our best knowledge,
our WS-Net is the rst to comprehensively map Web-services elements to CPNs
so that the latter can be used to facilitate the simulation and formal verication and
validation of Web-services composition.
However, manually transferring WSDL specications into the WS-Net specications
is not a trivial job. That is why currently we have only built some simple experi-
ments, for example, the example described in the chapter. In order for WS-Net to
monitor and verify real-life applications, the translation from WSDL into WS-Net
must be automated.
Meanwhile, since all transient tokens are created by local transitions and all persis-
tent tokens are restored before the completion of the service, repeated simulation of
the net is possible. Furthermore, in converting functional data-ow models to petri
nets, we also face the concurrency and choice problems (Trattnig & Kerner 1980).
These problems need to be addressed properly by system engineers who build the
system architecture by using WS-Net.
Despite the challenges WS-Net is facing, our preliminary experiences prove its
effectiveness and efciency in formally verifying Web-services-oriented system
composition. WS-Net uses an iterative and top-down process of investigating and
examining services composition using the petri-nets vehicle of technology. Future
work will focus on building automatic translation tools from Web-services system
specication into petri nets’ tool-based specications to automate the simulation
of Web-services composition.
A Petri Net-Based Specication Model Towards Veriable Service Computing 319
Copyright © 2007, Idea Group Inc. Copying or distributing in print or electronic forms without written permission
of Idea Group Inc. is prohibited.
References
Aggarwal, R., Verma, K., Miller, J., & Milnor, W. (2004). Constraint driven Web
service composition in METEOR-S. Proceedings of IEEE International Con-
ference on Services Computing (SCC), (pp. 23-30).
The American heritage dictionary of the English language (4
th
ed.). (2000). Hough-
ton Mifin Company.
Arpinar, B., Aleman-Meza, B., Zhang, R., & Maduko, A. (2004). Ontology-driven
Web services composition platform. Proceedings of IEEE International Con-
ference on E-Commerce Technology (CEC), (pp. 146-152).
Berardi, D., Calvanese, D., Giacomo, G. D., Lenzerini, M., & Mecella, M. (2003).
Automatic composition of e-services that export their behavior. In Lecture notes
in computer science: Vol. 2910. Proceedings of 1st International Conference
on Service-Oriented Computing (ICSOC) (pp. 43-58). Springer-Verlag.
Bordeaux, L., Salaün, G., Berardi, D., & Mecella, M. (2004). When are 2 Web
services compatible? In Lecture notes in computer science: Vol. 3324. Pro-
ceedings of VLDB Workshop on Technologies of E-Services (VLDB-TES) (pp.
15-28). Springer-Verlag.
Bultan, T., Fu, X., Hull, R., & Su, J. (2003). Conversation specication: A new ap-
proach to design and analysis of e-service composition. Proceedings of the 12
th
ACM International World Wide Web Conference (WWW), (pp. 403-410).
Casati, F., Ilnicki, S., Jin, L., Krishnamoorthy, V., & Shan, M. (2000). Adaptive and
dynamic service composition in eFlow. Retrieved December 19, 2005, from
/>Chang, C. K., & Kim, S. (1999). I3: A petri-net based specication method for archi-
tectural components. Proceedings of IEEE 23
rd
Annual International Computer
Software and Applications Conference (COMPSAC) (pp. 396-402).
Ferrara, A. (2004). Web services: A process algebra approach. Proceedings of the
2
nd
ACM International Conference on Service Oriented Computing (ICSOC)
(pp. 242-251).
Fu, X., Bultan, T., & Su, J. (2005). Realizability of conversation protocols with
message contents. International Journal of Web Services Research (JWSR),
2(4), 72-97.
Jensen, K. (1990). Coloured petri nets: A high level language for system design and
analysis. In Lecture notes in computer science: Advances in petri nets.
Kiwata, K., Nakano, A., & Yura, S. (2001). Scenario-based service composition
method in the open service environment. Proceedings of 5th International
Symposium on Autonomous Decentralized Systems (pp. 135-140).
320 Zhang, Chang, & Kim
Copyright © 2007, Idea Group Inc. Copying or distributing in print or electronic forms without written permis-
sion of Idea Group Inc. is prohibited.
Leymann, F. (2001). Web services ow language (WSFL 1.0). IBM Corporation.
Liang, Q., Chakarapani, L. N., Stanley, Y. W., Su, Chikkamagalur, R. N., & Lam,
H. (2004). A semi-automatic approach to composite Web services discovery,
description and invocation. International Journal of Web Services Research
(JWSR), 1(4).
Medvidovic, N., & Taylor, R. N. (2000). A classication and comparison frame-
work for software architecture description languages. IEEE Transactions on
Software Engineering, 26(1), 70-93.
Meta Software Corporation. (1993). Design/CPN reference manual for X-Windows
version 2.0.
Microsoft. (2003). BizTalk server 2004: Architecture. Retrieved December 19,
2005, from />4e15-bd80-8c1c127e88e7/BTSArch.doc
Milanovic, N., & Malek, M. (2004). Current solutions for Web service composition.
IEEE Internet Computing, 8(6), 51-59.
Narayanan, S., & McIlraith, S. A. (2002). Simulation, verication and automated
composition of Web services. Proceedings of the 11
th
ACM International
Conference on World Wide Web (WWW) (pp. 77-88).
Peterson, J. L. (1981). Petri net theory and the modeling of systems. Prentice-Hall
International.
Petri, C. A. (1962). Kommunikation mit automaten. Unpublished doctoral disserta-
tion, Institut für Instrumentelle Mathematik, Schriften des IIM.
Pi-Calculus. (n.d.). Automata, state, actions, and interactions. Retrieved December
19, 2005, from />Pinci, V., & Shapiro, R. (1990). An integrated software development methodology
based on hierarchical colored petri nets. In Lecture notes in computer science:
Advances in petri nets (pp. 227-252).
Ponnekanti, S., & Fox, A. (2002). SWORD: A developer toolkit for building composite
Web services. Proceedings of Alternate Tracks of the ACM 11
th
International
World Wide Web Conference (WWW), Honolulu, HI.
Ross, D. (1984). Application and extensions of SADT. IEEE Computer, 18(4),
25-35.
Salaun, G., Bordeaux, L., & Schaerf, M. (2004). Describing and reasoning on Web
services using process algebra. Proceedings of IEEE International Conference
on Web Services (ICWS) (pp. 43-50).
Shaw, M., DeLine, R., Klein, D. V., Ross, T. L., Young, D. M., & Zelesnik, G.
(1995). Abstractions for software architecture and tools to support them. IEEE
Transactions on Software Engineering, 21(4), 314-335.
A Petri Net-Based Specication Model Towards Veriable Service Computing 321
Copyright © 2007, Idea Group Inc. Copying or distributing in print or electronic forms without written permission
of Idea Group Inc. is prohibited.
Simple object access protocol (SOAP) 1.2. (2003). World Wide Web Consortium
(W3C). Retrieved December 19, 2005, from />part1/
Specication: Business process execution language for Web services version 1.1.
(2003). Retrieved December 19, 2005, from />operworks/webservices/library/ws-bpel/
Thatte, S. (2001). XLANG: Web services for business process design. Microsoft
Corporation.
Trattnig, W., & Kerner, H. (1980). EDDA: A very high-level programming and
specication language in the style of SADT. Proceedings of IEEE Annual
International Computer Software and Applications Conference (COMPSAC)
(pp. 436-443).
Universal description, discovery, and integration. (2004). Retrieved December 19,
2005, from />Web service choreography interface (WSCI), version 1.0. (2002). Sun Microsys-
tems.
Web services description language. (2004). Retrieved December 19, 2005, from
/>XML. (n.d.). Retrieved December 19, 2005, from />Zeng, L., Benatallah, B., Dumas, M., Kalagnanam, J., & Sheng, Q. (2003). Quality
driven Web services composition. Proceedings of 12th ACM International
Conference on World Wide Web (WWW) (pp. 411-421).
Zeng, L., Benatallah, B., Ngu, A. H. H., Dumas, M., Kalagnanam, J., & Chang, H.
(2004). QoS-aware middleware for Web services composition. IEEE Transac-
tions on Software Engineering, 30(5), 311-327.
Zhang, J. (2005). Trustworthy Web services: Actions for now. IEEE IT Profes-
sional, 32-36.
322 Dotoli, Fanti, Meloni, & Zhou
Copyright © 2007, Idea Group Inc. Copying or distributing in print or electronic forms without written permis-
sion of Idea Group Inc. is prohibited.
Chapter XIII
Service Computing for
Design and Reconguration of
Integrated E-Supply Chains
Mariagrazia Dotoli, Politecnico di Bari, Italy
Maria Pia Fanti, Politcnico di Bari, Italy
Carlo Meloni, Politecnico di Bari, Italy
Mengchu Zhou, New Jersey Institute of Technology, USA
Abstract
This chapter proposes a three-level decision-support system (DSS) for integrated
e-supply-chains (IESCs) network design and reconguration based on data and
information that can be obtained via Internet- and Web-based computing tools. The
IESC is described as a set of consecutive stages connected by communication and
transportation links, and the design and reconguration aim of the DSS consists of
selecting the partners of the stages on the basis of transportation connections and
Service Computing for Design and Reconguration of Integrated E-Supply Chains 323
Copyright © 2007, Idea Group Inc. Copying or distributing in print or electronic forms without written permission
of Idea Group Inc. is prohibited.
information ows. More precisely, the rst DSS level evaluates the performance of
all the IESC candidates and singles out the best ones. The second DSS level solves a
multicriteria integer linear optimization problem to congure the network. Finally,
the third DSS level is devoted to evaluating and validating the solution proposed
in the rst two modules. The chapter proposes the use of some optimization tech-
niques to synthesize the rst two levels and illustrates the decision process by way
of a case study.
Introduction
The discipline of service computing covers the science and technology of bridging
the gap between business services and information-technology services (Institute
of Electrical and Electronics Engineer [IEEE], 2004). Among others, it encompasses
a new innovative area: business-process integration and management, also known
as enterprise service computing. Enterprise service computing focuses on issues,
modeling, methodologies, and the enabling of computing technologies in support
of integrated and collaborative enterprise applications. The main task of enterprise
service computing is to reengineer operations and integrate international logistics
and information technologies in the production process to improve efciency and
minimize risk and cost. This has given rise to the formation of integrated e-sup-
ply-chain (IESC) networks, dened as a collection of independent companies pos-
sessing complementary skills and integrated with streamlined material, informa-
tion, and nancial ow (Luo, Zhou, & Caudill, 2001; Viswanadham & Gaonkar,
2003). Service computing and Internet- and Web-based electronic marketplaces
can provide an inexpensive, secure, and pervasive medium for information trans-
fer between business units in IESC (Gaonkar & Viswanadham, 2001; Luo et al.;
Tayur, Ganeshan, & Magazine, 1999). Indeed, by taking advantage of these novel
opportunities, companies are able to make smart decisions based on voluminous
data ows. Hence, the research community envisages the need of IESC decision
support in many areas (Keskinocak, Goodwin, Wu, Akkiraju, & Murthy, 2001).
As a result, decision-support systems (DSSs) can be designed to provide effective
analysis and comprehension of complex supply chains (SCs). Although several
conceptual models for IESC are proposed and discussed in the related literature,
research efforts are lagging behind in the development of formal decision models
for IESC design (Talluri & Baker, 2002). A systematic way to capture all aspects of
SC processes is proposed by Chopra and Meindl (2001) and Biswas and Narahari
(2004). This guideline is based on the three levels of the decision hierarchy: the
strategic, tactical, and operational ones. Strategic level planning involves SC design,
which determines the location, size, and optimal number of suppliers, plants, and
324 Dotoli, Fanti, Meloni, & Zhou
Copyright © 2007, Idea Group Inc. Copying or distributing in print or electronic forms without written permis-
sion of Idea Group Inc. is prohibited.
distributors to be used in the network. It considers time horizons of a few years
and requires approximate and aggregate data and forecast. Tactical level planning
basically refers to supply planning, which primarily includes the optimization of
the ow of goods and services through a given SC network. Finally, operational-
level planning is short-range planning, which involves production scheduling at all
plants on an hour-to-hour basis.
Background
The reconguration of the supply network over time at the tactical level is essential
for a modern business to hold or increase its competitive advantage. Hence, a crucial
decision problem of IESC is the network design (Vidal & Goetschalckx, 1997), which
determines (a) the number, location, and type of manufacturing plants and warehouses
to use, (b) the set of suppliers to select, (c) the transportation channels to employ,
and (d) the amount of raw materials and items to produce and ship among suppliers,
plants, warehouses, and customers considering bill-of-materials (BOM) relationships.
Signicant literature deals with the key problem of component selection for network
design of the SC, and detailed surveys can be found in Vidal and Goetschalckx, and
Shapiro (2001). In the following, we present the research track of decision models
for IESC network design, and we show that the current trends go into the direction of
using in a more determinant and decisive way modern technologies for enterprises,
for example, Internet and service computing.
In particular, Wu, Mao, and Qian (1999) formulate partner selection for distributed
agile manufacturing as an integer programming problem to choose one and only one
candidate for each task of the production process. They minimize the sum of the
costs for performing all the tasks and the transportation costs. However, the method
assumes that each IESC task is carried out by one company only: Such a constraint
is restrictive and affects the exibility of the resulting network structure. Moreover, a
linear programming model for integrated SC planning is developed by Gaonkar and
Viswanadham (2001), who assume that information is freely shared by the SC partners
through an Internet-based platform. The linear programming model provides a basis
for partner selection such that the cost of operations is minimized. In addition, in a
subsequent work, Viswanadham and Gaonkar (2003) study and analyze a multitier
SC by using an optimization technique that takes into account capacities and costs.
In the work, the authors determined the suboptimal order quantities to be allocated
to each of the manufacturers, suppliers, and logistics service providers. A mixed in-
teger programming model is developed for a dynamic manufacturing network, and
its objective function maximizes the prot earned by the network subject to various
capacity, production, and logistics schedules and ow-balancing constraints. However,
Service Computing for Design and Reconguration of Integrated E-Supply Chains 325
Copyright © 2007, Idea Group Inc. Copying or distributing in print or electronic forms without written permission
of Idea Group Inc. is prohibited.
the information necessary to describe and characterize the SC can be so complex and
large that the denition of constraints appears critical. Hence, Yang, Yu, and Edwin
Cheng (2003) propose a strategic production-distribution model for SC design taking
into account the BOM constraints represented by logical constraints. In particular,
a mixed integer programming model captures the role of BOM in the selection of
suppliers to provide the SC structure. Since the work optimizes an objective function
considering purchasing, production, and transportation costs, it does not select solu-
tions on the basis of the relative importance of the performance indices.
To face the complexities involved in the SC design process, Talluri and Baker (2002)
propose a three-phase mathematical programming approach for SC network design
that involves multicriteria efciency models, and linear and integer programming
methods. In particular, Phases I and II design the network, and Phase III addresses
operational issues such as the routing of materials. In the same direction, Jang,
Jang, Chang, and Park (2002) propose another SC-management system consisting
of four modules: an SC network design optimization module, a planning module
for production and distribution operations from material suppliers to customers, a
model-management module, and a data-management module.
A novel approach to model and optimize IESC networks incorporating e-commerce
and electronic linkage is presented by Luo et al. (2001). Interaction and trade-offs
between the network components are analyzed and optimized using a fuzzy multi-
objective optimization approach. The optimization procedure considers new para-
digms for the design of the IESC structure, such as recycling and pollution, which
inuence the decision process, along with transportation costs and cycle times. The
drawback of this approach is that the fuzzy optimization technique provides only
one suboptimal network structure and disregards the impact of the solution on the
operational-level issues.
Summing up, the proposed models for decisions on SC conguration mainly ad-
dress the problem of designing a traditional SC, and consider only to some extent
the advantages of integrating modern available technologies in the management of
these complex systems.
Contribution
Although modern researchers and practitioners agree in asserting the importance of
enterprise service computing, few contributions can be found in the recent literature
in the eld. In order to ll this gap, the chapter proposes a DSS that deploys the
opportunities and potential of service computing for effective e-enterprise design
and conguration. A DSS is an interactive computer-based system or subsystem
that helps decision makers in using information, identifying and modeling prob-
lems, and taking decisions (Sprague & Carlson, 1982). The presented DSS ad-
326 Dotoli, Fanti, Meloni, & Zhou
Copyright © 2007, Idea Group Inc. Copying or distributing in print or electronic forms without written permis-
sion of Idea Group Inc. is prohibited.
dresses IESC network design based on data and information that can be obtained
via Internet- and Web-based instruments. Moreover, the DSS selects and updates
the IESC network for all stages, each collecting a set of competing companies with
analogous characteristics with regard to processes and products, for example, pro-
ducers, manufacturers, consumers, and so forth. Such a design and reconguration
process is carried out by the decision structure using the information available on
BOM relationships, inventory, transportation cost, distances, and environmental
impact. In addition, the DSS is designed with the aim of improving the business
agility and exibility of the IESC for adapting to market uctuations and evolving
as technology advances.
In more detail, in order to face the complexity of the decision process, the IESC
structure design is divided into a hierarchy consisting of three decision levels. The
candidate-selection level and network-design level take decisions referring to the
tactical planning, while the solution-evaluation and -validation level considers
operational decision problems and validates the solutions obtained on the rst two
levels. In particular, the candidate-selection level evaluates the performance of the
candidate entities to join the network. On the basis of efciency criteria considering
aggregate data stated by the decision team, the output of this module contributes
to create a set of candidate entities connected by links representing transportation
and communication. Different procedures can be considered for estimating the
relative efciency of a group of actors (i.e., the candidate members of the IESC
stages): Electre (Buchanan, Sheppard, & Vanderpooten, 1999; Mousseau, Slowin-
ski, & Zielniewicz, 2000), the analytic hierarchy process (AHP; Saaty, Vargas, &
Dellmann, 2003), the data envelopment analysis (DEA; Thanassoulis, 2001), and
many more. As an example and for the sake of brevity, here we consider only the
results obtained by the Electre method.
Furthermore, the second level receives the stages of the IESC by the rst DSS layer
and provides as output one or more network structures. More precisely, the IESC
network is described by the digraph proposed in Luo et al. (2001), where nodes are
partners and edges are links. Different costs are assigned to each link (edge) so that
the performance indices can be obtained by the digraph analysis. The data analyzed
at this level consider transportation and information connections among stages, cost,
and transport environment impact. In order to congure the IESC network and to
select appropriate links among the stages, some multicriteria objective functions are
dened, and suited constraints are introduced on the basis of the digraph structure.
Hence, a multicriteria integer linear optimization problem is solved.
While the rst and second layers help in tactical decision making and produce some
possible structures of the IESC network, the third level is devoted to evaluating
and validating the solution proposed in the rst two levels, taking into account
operational issues. In particular, this layer determines and studies the evolution of
Service Computing for Design and Reconguration of Integrated E-Supply Chains 327
Copyright © 2007, Idea Group Inc. Copying or distributing in print or electronic forms without written permission
of Idea Group Inc. is prohibited.
the IESC and evaluates appropriate performance indices using low-level analytical
models or simulation models. The validation process performed at this layer allows
us to verify the IESC structures obtained at the higher levels and helps in the nal
selection of the network.
The chapter focuses on the synthesis of the rst two higher levels of the DSS
(candidate selection and network design) with the perspective of realizing the third
level. The DSS realizes the IESC network on the basis of appropriate optimization
tools that deploy the available knowledge base and provide a set of solutions on
the basis of the determined performance indices. Moreover, modern information
technology supports the communication of different partners and enables the in-
formation ow within the value-added chain (Chryssolouris, Makris, Xanthakis,
& Mourtzis, 2004). This peculiarity is the key of the exibility and the business
agility of the DSS, which can easily modify and improve the structure of the IESC
for each market change.
The proposed methodology contributes to the development of the discipline of
enterprise service computing with particular regard to Web-based services in two
aspects. First, electronic links devoted to information and commercial services
play an important role in IESC design decisions. Second, the proposed DSS may
be implemented by employing Web-based technologies and remote modeling and
calculus services (see, for instance, Gaonkar & Viswanadham, 2001; Mustajoki et
al., 1999) in order to facilitate or enable the participation of different decision mak-
ers and develop and boost the collaboration and resolution of the various trade-offs
characterizing the different phases of the design and reconguration of an IESC.
Indeed, Web services offer, nowadays, simple ways to carry out different phases of
the decision process leading to an IESC design, for example, the constitution of the
decision-making team, acquiring and evaluation of historical data, development of
performance indices and recognition of best practices, development of models for
conguration of networks, tackling of optimization and decision-analysis issues, and
implementation and validation of models. Moreover, the proposed method supports
an effective team-oriented process for operational decision making, characterized
by exibility in response to market changes or organizational changes, while the
use of Web computing and modeling tools facilitates both its adoption and plain
use in a decentralized and collaborative way.
This chapter is organized as follows. First it describes the structure of the proposed
DSS and presents a methodology to obtain the DSS candidate-selection module.
Next we synthesize the DSS network design module and the optimization model
employed in the decision strategy. In addition, the technique is applied to a case
study. Finally, the chapter discusses the DSS solution and evaluation module, and
then summarizes the conclusions.
328 Dotoli, Fanti, Meloni, & Zhou
Copyright © 2007, Idea Group Inc. Copying or distributing in print or electronic forms without written permis-
sion of Idea Group Inc. is prohibited.
The Structure of the Decision-Support System
for Integrated E-Supply-Chains
Description of the Integrated E-Supply-Chain
Consider a generic distributed manufacturing process that requires a number of
component suppliers, subassembly manufacturers, logistics service providers, and
users located at different geographical sites. The distributed manufacturing system
is arranged as an IESC composed of a sequence of stages connected by material
transporters and by information exchange. More precisely, partners belonging to
different stages can exchange information on their product schedules and cost. The
considered IESC contains different stages: raw-material supply, intermediate supply,
manufacturing, distribution, retail, customers, and demanufacturing or recycling. After
the demanufacturing stage, recovered material, components, or energy feedback to
suitable supply-chain stages are considered. We denote the IESC stages by the set
{ }
1
, , , ,=
s
k N
ST P P P
, where N
S
is the number of stages. Each stage P
k
is described
as a set of partners representing different candidates (or actors) of the SC.
The Hierarchical Structure of the Decision-Support System
Analyzing both the characteristics of the candidate entities able to join the IESC
and the performance of members of the network is a crucial step of the decision
process related to the conguration of the overall system. As a decision maker is
often a heterogeneous team of experts, the proposed analysis tools have to be quite
simple to use and understand (Shapiro, 2001), as well as applicable to different SC
stages. Moreover, Web services provide an efcient and simple means to support
decision makers in taking decentralized and multidisciplinary decisions.
In this section, we describe a three-level approach to design the DSS for congur-
ing (or reconguring) the IESC. More precisely, the DSS decomposes the design
of the IESC into three hierarchical levels; then it proposes different solutions by
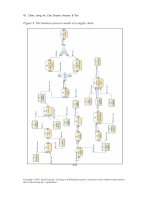
analyzing various sets of data and considering different scenarios. Figure 1 shows
the hierarchical structure of the DSS for IESC conguration and depicts the three
levels of the design procedure. A specic module is devoted to each decision stage,
and the interactions between modules allow us to obtain and rene proposed con-
gurations for the IESC (see Figure 1). The resulting DSS may be implemented as
a shared and remote platform dedicated to enterprise service computing. The levels
of the hierarchical DSS are described as follows.
Service Computing for Design and Reconguration of Integrated E-Supply Chains 329
Copyright © 2007, Idea Group Inc. Copying or distributing in print or electronic forms without written permission
of Idea Group Inc. is prohibited.
• First level: Candidate-selection module: Some multicriteria data-analysis
techniques are applied to the company’s database in order to create a pool of
ranked candidates to join a supply-chain project. At this DSS level, the criteria
to select partners are based on aggregate performance indices that are used to
analyze the efciency of the possible members. Hence, we consider different
procedures for estimating the relative efciency of a group of SC partners.
The output of this module produces a ranking and classication of the entities
considered as candidates for each IESC (see Figure 1).
• Second level: Network-design module: This DSS module receives the set of
IESC candidates that compose each stage from the rst level. Moreover, the
transportation and information links that connect the candidates have to be
specied. More precisely, each link is characterized by a structural description
(the partners that the link connects) and by some relevant performance indices
(distances, transportation cost, etc.). This decision level has to select the actors
of the stages and the transportation and information links that have to connect
the actors. To this aim, an integer multicriteria linear optimization problem
is stated, and a set of nondominated solutions are generated. Each solution
proposes an IESC network structure that minimizes a set of performance indices,
for example, transportation cost, CO
2
emission, cycle time, and energy. Note
that while some of the selected indices may be typical indicators of an IESC
operation, others are important for measuring the chain’s environmental im-
pact and sustainability. However, the optimization procedure may provide an
unsatisfactory set of networks. This situation can happen because the former
DSS level supplies this module with an insufcient number of stage candidates
or with candidates not properly connected. Thus, with reference to Figure 1,
Figure 1. The DSS structure for the IESC conguration
Request of
new networks
Request of new
candidate sets
Set of candidates
For
each stag
e
Set of networks
A selected
ne
twork
Level 3
Solution evaluation/validation
Level 2
Network desi
gn
Level 1
Candidate selection
Aggregate data from
company data base
Transportation and
information links
Capacities, times
and deadlines of
manufacturers and
transports
Decision
Making
Team
Real issues and
scenario analysis
330 Dotoli, Fanti, Meloni, & Zhou
Copyright © 2007, Idea Group Inc. Copying or distributing in print or electronic forms without written permis-
sion of Idea Group Inc. is prohibited.
in such cases the network-design module (Level 2) requires a new application
of the candidate-selection module (Level 1).
• Third level: Solution-evaluation and -validation module: This DSS module
receives as input the set of IESC networks determined by the second level
with the associated performance indices (see Figure 1). Moreover, this level
gets and takes into account the capacities of each partner and transportation
facility, the times employed to process and transport the products, and the
production deadlines. Hence, at this level, the IESC is modeled addressing
tactical and operational issues. Accordingly, analytical or simulation models
provide operational performance indices to evaluate and validate the solutions
generated by the previous levels. Therefore, this module allows us to validate
the IESC network structures obtained at the previous levels in order to evaluate
some lower level performance indices such as lead times, utilization, inventory
levels, and so on (Viswanadham & Raghavan, 2000). As a result, this DSS
stage veries whether the received system structures are suited to perform the
IESC tasks. In case the verication is not satisfactory, it is possible to feed
information back to the higher level to change the IESC network appropri-
ately (see Figure 1). For example, if the production capacities provided by
the proposed networks are not sufcient, then Level 3 asks Level 2 for IESC
networks having a larger number of manufacturers. More precisely, when the
verication fails, Level 3 has to single out the stages of the IESC networks
that must be modied by Level 2.
At this point, the reasons leading to the choice of the three hierarchical levels can
be clear: The DSS structure follows an intuitive procedure to nd the optimal net-
work. The rst level selects the available actors, the second one builds the possible
networks, and the last one chooses the suitable network on the basis of operational
performance indices. The proposed decision structure is able to operate both stati-
cally, that is, to design a new network, and dynamically, that is, when unsuccessful
validations from Level 3 or changes in the market context call for a reconguration
of the SC. Moreover, the decision team should analyze different scenarios so that
the applied optimization methods are able to yield a family of solutions according
to the required objectives of the problem.
Candidate-Selection Module
The DSS candidate-selection module is devoted to analyzing the performance and
efciency of the candidates of each IESC stage. This level of the DSS is modeled as
a candidate-ranking problem, that is, a multicriteria optimization problem in which
Service Computing for Design and Reconguration of Integrated E-Supply Chains 331
Copyright © 2007, Idea Group Inc. Copying or distributing in print or electronic forms without written permission
of Idea Group Inc. is prohibited.
a number of criteria are dened to measure the impact on the IESC. We remark that
the selection of the criteria and determination of the corresponding efciency is a
hard task for the decision team (Buchanan et al., 1999). Moreover, it is not possible
to provide a specic methodology to accomplish this work, which is based on expe-
rience in the particular eld in which the IESC operates and on the peculiar stage.
However, Web services and service-computing technology can support experts by
the use of Internet data and communication. Indeed, the criteria necessary for the
decisions have to be determined by the team of decision makers. Such a process may
be eventually performed with the support of an Internet-based platform, possibly
via a remote and collaborative evaluation. Similarly, the corresponding performance
indices may be obtained as 0-to-100 scores by a Web-based service collecting and
elaborating data in a remote way.
We can provide just a trace to follow in order to obtain the output of this module: a
current ranking (on the basis of the efciency criteria stated by the decision team)
of the considered entities, so that for each stage of the SC an ordered list of candi-
dates is provided. In the following, the structure and the tasks of this module are
described by four steps, which are iterated for each IESC stage.
Step 1. Single out the candidate set of the generic stage denoted by P
k
c
={n
i
c
}. The
set P
k
c
collects all the candidates n
i
c
that may compose stage P
k
of the SC.
Step 2.
Dene the most relevant criteria that measure the impact of each alternative.
To this aim, the following types of criteria can be used (Beamon, 1999; Buchanan
et al., 1999): nancial (F), including cost and nancial return; risk management
(RM), including the risk of plant failure and damage following natural disasters;
environmental (E), including the effect on relationships with resource partners and
on access to resources; exibility (FL), representing the capacity of a candidate to
adjust market requests; operation times (T), representing the ability to respect the
decided deadlines; and quality (Q), evaluating the products and provided service.
Step 3.
Determine a normalized score on a 0-to-100 scale for each candidate with
reference to each criterion. These data, where each alternative is assessed using each
criterion, produce a table of impacts, referred to as performance indices.
Step 4.
Perform an optimization process to provide a nal ranking of the partners
in P
k
c
on the basis of criteria and scores obtained at the previous steps. At this point,
the designer is ready to select the candidates in a subset P
k
⊂P
k
c
denoting the actors
of the kth stage of the IESC.
332 Dotoli, Fanti, Meloni, & Zhou
Copyright © 2007, Idea Group Inc. Copying or distributing in print or electronic forms without written permis-
sion of Idea Group Inc. is prohibited.
To implement this decision level, several well-known multiattribute decision-making
(MADM) methodologies can be adopted, for example, the Electre method (Buchanan
et al., 1999; Mousseau et al., 2000), the analytic hierarchy process (Saaty et al., 2003),
the data envelopment analysis (Thanassoulis, 2001), and many others, such as, for
instance, fuzzy methods (Farina & Amato, 2004). The customary best practice is to
apply different MADM methodologies to the given problem so that different rank-
ings of candidates are obtained: The set of candidates that receives the best scores
in each classication represents the “best” candidates with a good safety margin
(see, for example, Dotoli, Fanti, Meloni, & Zhou, 2005). Indeed, bearing in mind
the idea of a Web-based DSS implementation, the described module may consider
multiple optimization methods to remove subjectivity from the decision. Similarly,
the different decision parameters of the techniques may get rid of polarizations by
interviewing various decision makers. Moreover, the DSS lets us carry out differ-
ent investigations of the given data so that the decision makers may obtain diverse
answers to each decision question while being eventually oblivious of the details
of the underlying optimization techniques. For the sake of brevity and to show a
simple example of this DSS module, the candidate ranking and classication is here
performed using the Electre method.
Candidate Selection with Electre
The rst step of the procedure determines the candidate set of the generic stage
P
k
c
. All candidates to join the IESC kth stage are identied and their information
is collected.
Having dened the most relevant criteria in the second step (e.g., F, RM, E, FL, T,
Q), the third step assigns the scores to each candidate. Hence, a performance table
reports the obtained performance indices.
The fourth step determines the nal ranking of the candidates to each IESC stage
with the selected MADM technique, that is, Electre. In particular, the Electre method
is a multiple-criteria sorting method originally developed to integrate imprecision
and uncertainty in decision making by using the so-called thresholds of indifference,
preference, and veto. A further feature distinguishes Electre from many MADM
solution methods: It is fundamentally noncompensatory. In other words, low scores
with reference to some criteria cannot be compensated by high scores on other
criteria. To apply the Electre method, the decision makers are required to dene a
table collecting the indifference, preference, and veto thresholds as well as a set
of weight-importance coefcients. While thresholds model the noncompensatory
nature of the method, the weights deal with preference information, reecting the
relative importance of each criterion according to the decision-making team (Mous-
seau et al., 2000). The thresholds and weights are subjective: Once the performance
is agreed upon by all decision makers, then the subjective inputs of thresholds and
Service Computing for Design and Reconguration of Integrated E-Supply Chains 333
Copyright © 2007, Idea Group Inc. Copying or distributing in print or electronic forms without written permission
of Idea Group Inc. is prohibited.
weights can be processed. Hence, the indifference, preference, and veto thresholds
together with the weights are dened for the considered IESC with respect to each
criterion taken into account.
Using the dened thresholds, the Electre method seeks for an outranking relation
of the candidates resulting from the intersection of the results of an ascending and
descending distillation process (Buchanan et al., 1999; Mousseau et al., 2000). Ac-
cording to the ranking results, the decision makers select the required number of
actors for the kth stage, for example, via a Web-based platform (Gaonkar & Viswa-
nadham, 2001), to be included in the SC network starting from the top one in the
ordered list of candidates. The procedure is then iterated for each stage.
Network-Design Module
This module applies optimization algorithms to the IESC resulting from the previous
level of the DSS and determines the optimal subnetworks according to the objec-
tives and constraints indicated by the decision maker. Moreover, the user can select
different objectives: operative cost functions, cycle time, energy savings, environ-
mental cost, and so forth. In addition, by imposing the appropriate constraints, the
designer can ask for a certain number of manufacturers (or customers), the presence
of a specic link in the solution, and the presence of a particular subnet (e.g., in the
case of SC expansion) in the solution.
Similar to the previous DSS level, the present module may also benet from the
use of a Web-based platform with the previously discussed advantages, that is, an
automatic, decentralized, collaborative, and less subjective implementation of the
strategy.
The Network Description
Denoting the IESC as the stage set
{ }
1
, , , ,=
s
k N
ST P P P
, each stage P
k
is
described as a set of s
k
partners representing different actors of the IESC, i.e.,
{ }
k k k k k
i i 1 i 2 i s 1
n ,n ,n , n
+ + + −
=
k
P
, where i
k
is the generic index such that:
∑
=
=
1-k
1h
h
s
k
i
with k=2, 3, …, N
s
and i
1
=1. We suppose that there are N partners in the system. In
addition, the (k-i)th stage ((k+i)th stage) is called the upstream (downstream) stage
334 Dotoli, Fanti, Meloni, & Zhou
Copyright © 2007, Idea Group Inc. Copying or distributing in print or electronic forms without written permis-
sion of Idea Group Inc. is prohibited.
of P
k
, with i>0. Moreover, the BOM of stage P
k
is a set of components required for
processes in the kth stage and produced by upstream stages.
Furthermore, the partners of different IESC stages can be connected by two types of
links: material-ow links (m-links) and information links (e-links). More precisely,
an m-link represents the physical transportation link between two partners, and
multiple m-links are allowed between two partners to model different transportation
modes or split delivery routes. In addition, an e-link models e-business relationships
between business entities for streamlining the material ow efciently and effectively.
We assume that two partners can be connected by m-links and/or by e-links, and
that an e-link may connect two partners of the SC without the presence of an m-
link. Hence, the proposed structure is able to extend the traditional SC into a more
sustainable and integrated production system. Note that IESC partners belonging to
the same stage are not connected by links since in the considered model, material
and information ow through different stages. Formally, the m-links of stage P
k
are denoted by the set
{ }
ij
m=
k
m
L
, where m
ij
is an m-link starting from n
i
∈P
k
and
ending in n
j
∈P
h
, with P
k
,P
h
∈ST and k≠h. The set
= ∪
k
m m
L L
denotes the overall
material-ow link set. Analogously, we denote the e-links set of stage P
k
by
{ }
ij
e=
k
e
L
, where e
ij
is an e-link starting from n
i
∈P
k
and ending in n
j
∈P
h
, with P
k
,P
h
∈ST and
k≠h. The set
= ∪
k
e e
L L
denotes the e-links set and
= ∪
m e
L L L
is the complete set of
links of the IESC. Figure 2 depicts a generic IESC network exhibiting a succession
of stages; each stage is composed of a set of partners (actors). In addition, stages
are connected by different links that can represent here m- or e-links. Note that for
the sake of readability, only some IESC links are represented in Figure 2 and their
nature (m- or e-link) is omitted.
Moreover, we complete the description of the IESC network by introducing the
set of performance indices
{ }
M
1 2 N
M , M , , M=M
, where each element M
q
∈M cor-
responds to a performance measure. Typical indices include cost, transportation
and process time, product quality, energy consumption, and environmental impact
(Beamon, 1999; Luo et al., 2001). A performance value is assigned to each link
considering m- and e-links: M
q
(m
ij
) (M
q
(e
ij
)) with q=1, …, N
M
denotes the value of
the performance measure M
q
associated with the link m
ij
∈
k
m
L
(e
ij
∈
k
e
L
). Particu-
larly, an e-link speeds up the communication process and thus reduces the response
Figure 2. The structure of a generic IESC network
Stage P
1
.
.
.
.
.
.
…
Stage P
k
.
.
.
k
i1
n
+
kk
is1
n
+−
1
n
2
n
1
s
n
Stage P
k+1
k1
i
n
+
k1
i1
n
+
+
k1 k1
is1
n
++
+
−
…
Stage P
N
s
.
.
.
N
s
i
n
N
s
i1
n
+
N
n
k
i
n
Service Computing for Design and Reconguration of Integrated E-Supply Chains 335
Copyright © 2007, Idea Group Inc. Copying or distributing in print or electronic forms without written permission
of Idea Group Inc. is prohibited.
time affecting performance measures such as cost and productivity. Hence, if two
partners (e.g., n
i
∈P
k
and n
j
∈P
h
) are connected both by an e-link and m-link (i.e.,
m
ij
and e
ij
), the performance measures are suitably updated and are associated with
the m-link m
ij
only. On the other hand, if just an e-link connects two IESC actors,
then it models the fact that no material ow is possible between the two partners.
So, the performance measure assigned to the e-link is the cost of information, such
as Internet portals, Web sites, and electronic databases.
The Digraph Denition
To exhibit the interactions among the IESC stages, we dene a direct graph D=(N,E).
The node set N represents the complete partner set of the network, and each node
n
i
∈N for i=1, …, N is associated with partner n
i
∈P
k
for k∈{1,…,N
S
} of the IESC
network. For the sake of simplicity, the same symbols indicate nodes and partners.
Moreover, the edge set E is such that an arc y
ij
directed from n
i
to n
j
is in E if there
exists an m-link m
ij
∈L
m
and/or e-link e
ij
∈L
e
. We denote with E the number of edges
in D. Figure 3 shows the digraph associated with the generic IESC network in Fig-
ure 2. For the sake of simplicity, the digraph edges are not labeled. Note that there
is a one-to-one correspondence between the IESC structure (e.g., the example in
Figure 2) and its digraph (e.g., the example in Figure 3). Moreover, once the overall
IESC structure is known, an additional table can then collect all the information on
transportation ad communication links (i.e., m- and e-links).
The Optimization Model for the
Network-Design Module
This section proposes two alternative optimization models presented in the related
literature in order to design the IESC network. The rst optimization model was
presented by the authors and leads to an integer linear programming (ILP) prob-
lem (Dotoli, Fanti, Meloni, & Zhou, 2006); the second technique was presented
Figure 3. The digraph associated to a generic IESC
.
.
.
.
.
.
…
.
.
.
k
i1
n
+
kk
is1
n
+−
1
n
2
n
1
s
n
k1
i
n
+
k1
i1
n
+
+
k1 k1
is1
n
++
+
−
…
.
.
.
N
s
i
n
N
s
i1
n
+
N
n
k
i
n
336 Dotoli, Fanti, Meloni, & Zhou
Copyright © 2007, Idea Group Inc. Copying or distributing in print or electronic forms without written permis-
sion of Idea Group Inc. is prohibited.
by one of the authors and uses a fuzzy optimization model (Luo et al., 2001). The
two procedures start from the knowledge of the digraph D=(N,E), which takes into
account all the possible actors belonging to the IESC stages and all the possible
links that can connect the considered partners. Hence, an optimization technique
has to select a subdigraph D*=(N*,E*), with N*⊂N and E*⊂E, that corresponds to
an IESC responding to structural constraints and exhibiting optimal or suboptimal
performance indices. To this aim, the optimization problems are established consid-
ering a single-criterion or a multicriteria optimization subject to a set of constraints
obtained by the structure of the IESC.
In order to state the optimization model and to use a clear mathematic notation, we
introduce the decision variable vector x=[x
1
x
2
…x
E
]
T
, where each element x
h
∈{0,1}
with h=1, …, E is associated with an edge y
ij
∈E. More precisely, the value of x
h
indicates the presence (x
h
=1) or the absence (x
h
=0) of the edge y
ij
∈E in the solution
digraph (Hillier & Lieberman, 2005). The objective functions are obtained consider-
ing the performance index functions M
q
that assign to each m-link m
ij
and e-link e
ij
the value M
q
(m
ij
) and M
q
(e
ij
), respectively, and to each m- and e-link m
ij
and e
ij
the
comprehensive value M
q
(m
ij
). Consequently, value M
q
(m
ij
) or M
q
(e
ij
) is associated
with edge y
ij
∈E and the corresponding variable x
h
. Let us indicate with c
q
the column
vector of E entries where the hth entry is c
q
h
=M
q
(m
ij
) or c
q
h
=M
q
(e
ij
) associated with
the edge y
ij
∈E and the decision variable x
h
labeling y
ij
.
The Optimization Model Solved by ILP
The objective of the model is to minimize a single-criterion or multicriteria cost
function subject to the constraints that we characterize as BOM, path, mutual-exclu-
sion, and structural constraints. The optimization problem is as follows:
z=min φ(x) (1)
subject to
Ax≥B (2)
x
h
∈{0,1} for h=1, …, E, (3)
where A is the constraint matrix of dimension v×E, B is a v-entry vector of integers,
and v represents the number of constraints. Minimizing the objective function φ(x)
means to minimize either only one performance index (Problem 1) or a subset of
the chosen performance indices (Problem 2); that is, φ(x) represents either a single-
criterion or multicriteria objective function.