Advances in Measurement Systems Part 1 doc
Bạn đang xem bản rút gọn của tài liệu. Xem và tải ngay bản đầy đủ của tài liệu tại đây (3.64 MB, 40 trang )
I
Advances in Measurement Systems
Advances in Measurement Systems
Edited by
Milind Kr Sharma
In-Tech
intechweb.org
Published by In-Teh
In-Teh
Olajnica 19/2, 32000 Vukovar, Croatia
Abstracting and non-prot use of the material is permitted with credit to the source. Statements and
opinions expressed in the chapters are these of the individual contributors and not necessarily those of
the editors or publisher. No responsibility is accepted for the accuracy of information contained in the
published articles. Publisher assumes no responsibility liability for any damage or injury to persons or
property arising out of the use of any materials, instructions, methods or ideas contained inside. After
this work has been published by the In-Teh, authors have the right to republish it, in whole or part, in any
publication of which they are an author or editor, and the make other personal use of the work.
© 2010 In-teh
www.intechweb.org
Additional copies can be obtained from:
First published April 2010
Printed in India
Technical Editor: Martina Peric
Cover designed by Dino Smrekar
Advances in Measurement Systems,
Edited by Milind Kr Sharma
p. cm.
ISBN 978-953-307-061-2
V
Contents
1. In-eldmeasurementofsoilnitrateusinganion-selectiveelectrode 001
KevinJ.Sibley,GordonR.Brewster,TessemaAstatkie,JohnF.Adsett
andPaulC.Struik
2. High-resolution,High-speed3-DDynamicallyDeformable
ShapeMeasurementUsingDigitalFringeProjectionTechniques 029
SongZhang
3. HighTemperatureSuperconductingMaglevMeasurementSystem 051
Jia-SuWangandSu-YuWang
4. AutonomousMeasurementSystemforLocalization
ofLoss-InducedPerturbationBasedonTransmission-ReectionAnalysis 081
VasilyV.Spirin
5. RadiationTransmission-basedThicknessMeasurementSystems
-TheoryandApplicationstoFlatRolledStripProducts 105
MarkE.Zipf
6. DesignofaMeasurementSystemofEnd-UserInformationCompetency
withaCaseStudy 159
ChuiYoungYoon
7. RadiationTransmission-basedThicknessMeasurementSystems
-Advancements,InnovationsandNewTechnologies 175
MarkE.Zipf
8. ExperimentalRadioIndoorPositioningSystemsBased
onRound-TripTimemeasurement 195
AlessioDeAngelis,AntonioMoschitta,PeterHändelandPaoloCarbone
9. Metrologyfornon-stationarydynamicmeasurements 221
JanPeterHessling
10. SensorsCharacterizationandControlofMeasurementSystems
BasedonThermoresistiveSensorsviaFeedbackLinearization 257
M.A.Moreira,A.Oliveira,C.E.T.Dórea,P.R.BarrosandJ.S.daRochaNeto
VI
11. AlgalBiosensor-BasedMeasurementSystemforRapidToxicityDetection 273
ThiPhuongThuyPham,Chul-WoongChoandYeoung-SangYun
12. Erroranalysisandsimulatorincylindricalneareldantenna
measurementsystems 289
BurgosSara,Sierra-CastañerManuel,MartínFernando,CanoFrancisco
andBesadaJoséLuis
13. Nano-metrologybasedontheLaserInterferometers 315
SaeedOlyaeeandSamanehHamedi
14. InductiveTelemetricMeasurementSystemsforRemoteSensing 343
DanieleMarioli,EmilioSardiniandMauroSerpelloni
15. MeasurementofVoltageFlicker:ApplicationtoGrid-connectedWindTurbines 365
J.J.GutierrezandJ.RuizandA.LazkanoandL.A.Leturiondo
16. WidebandMIMOMeasurementSystemsforAntennaandChannelEvaluation 393
CarlosGómez-Calero,JonathanMora,LuisCuéllarLeandrodeHaro
andRamónMartínez
17. PassiveAll-FiberWavelengthMeasurementSystems:
PerformanceDeterminationFactors 417
GinuRajan,YuliyaSemenova,AgusHattaandGeraldFarrell
18. Theideaofthemeasurementsystemforquicktestofthermalparameters
ofheat-insulatingmaterials 445
StanislawChudzik
19. NewTechnologiesForMeasurementSystemsDistributedOnAWideArea 467
GiovanniBucci,FabrizioCiancettaandEdoardoFiorucci
20. Amethodologyformeasuringintellectualcapital.Astructuralequations
modellingapproach 491
MariolinaLongoandMatteoMura
21. SIMEFAS:WideAreaMeasurement,ProtectionandControlSysteminMexico 511
EnriqueMartínezMartínez
22. Multi-wavedifferentialopticalabsorptionspectroscopysurface
ozonemeasurementwithopenpathmeters 537
LeonidBalatsko,VictarDziomin,AliaksandrKrasouski,AlexanderLiudchik
andVictarPakatashkin
23. Intermediatemeasuresconsiderationforavaluechainormultistagesystem:
anefciencyanalysisusingDEAapproach 561
WaiPengWongandKuanYewWong
24. AnalogtoDigitalConversionMethodsforSmartSensingSystems 575
JoséMiguelPereira,OctavianAdrianPostolacheandPedroSilvaGirão
In-eldmeasurementofsoilnitrateusinganion-selectiveelectrode 1
In-eldmeasurementofsoilnitrateusinganion-selectiveelectrode
KevinJ.Sibley,GordonR.Brewster,TessemaAstatkie,JohnF.AdsettandPaulC.Struik
X
In-field measurement of soil nitrate using
an ion-selective electrode
Kevin J. Sibley, Gordon R. Brewster, Tessema Astatkie, John F. Adsett
Nova Scotia Agricultural College
Canada
Paul C. Struik
Wageningen University
the Netherlands
1. Introduction
Standard laboratory methods for measurement of soil nitrate (NO
3
–N) use various
procedures and instruments to analyze soil samples taken from the field and transported to
the laboratory. Concerns with these procedures range from delays in measurement time, the
high cost of soil sampling and analysis, high labour requirements, and the need to aggregate
samples. With recent advances in using the ion-selective electrode, as presented in this
chapter, soil NO
3
–N can now be measured directly, rapidly, accurately, at low cost, at a fine
scale, and in real-time right in the field. This chapter describes the methodologies and
procedures for how this can be done and provides experimental data and results from data
analyses that validate measurements of soil NO
3
–N obtained with a prototype soil nitrate
mapping system (SNMS) developed at the Nova Scotia Agricultural College, Truro, Nova
Scotia, Canada. These advances in the in-field use of the nitrate ion-selective electrode
(NO
3
¯–ISE) provide the ability for (i) assessing soil nitrate variation, (ii) linking soil nitrate
variation to crop growth, (iii) developing site-specific crop management practices, and (iv)
environmental monitoring of soil nitrate.
This chapter will begin with a discussion of the concerns with nitrate in the soil and
environment, precision agriculture and site-specific crop management, variation in soil
nitrate and its links to crop growth and yield, and issues with assessing soil nitrate variation
in a field. Next will be a discussion of ion-selective electrode theory and application for
measuring soil nitrate, followed by a presentation and discussion of early experiments
conducted for determining electrode operating parameters to enable the electrode to be
used in a soil slurry. The development and testing of the mechanical system used for soil
nitrate extraction and measurement along with a description of the control sub-unit,
measurement methodology, and operation of the nitrate extraction and measurement sub-
unit (NEMS) for using the NO
3
¯–ISE in the field will be presented. And the results of
experiments used to validate in-field measurements of soil NO
3
–N obtained with the ion-
selective electrode will be presented and discussed. There will be a discussion of what is
1
AdvancesinMeasurementSystems2
significant about the new measurement advances presented along with some results of
experiments conducted using the SNMS in wheat and carrot production systems. Finally,
conclusions and recommendations for future research in this area will be made.
1.1 Soil nitrate is an environmental issue
In addition to the fertility needs of farmers, it is important to deal with environmental issues
associated with the use of nitrogen fertilizers. As agriculture continues its best efforts to
provide the world’s rising population with high-quality, safe, and nutritious food, water
sources contamination and associated socio-economic costs indicate a great need for precise
soil fertility management practices—using the right form of fertilizer, applied at the right
time and place, in the right amount, and in the right way (Power & Schepers, 1989; Dinnes
et al., 2002).
The seriousness and extent of NO
3
¯ contamination of water sources and its effect on
drinking water quality has been documented and discussed by many researchers in
Canada, the United States, and the European Community (USEPA, 1990; Reynolds et al.,
1995; Oenema et al., 1998; Henkens & Van Keulen, 2001). As a result, policy makers are
revising laws to ensure the safety of public water supplies. These include amendments to
the Water Pollution Control Acts in Canada and the United States, the European
Community Nitrate Directive, and the Mineral Policy in the Netherlands.
Nitrate leaching from soil into groundwater has been attributed to poor soil nitrogen
management practices involving inorganic and manure fertilizer inputs (Geron et al., 1993;
Campbell et al., 1994; Patni et al., 1998; Koroluk et al., 2000; Astatkie et al., 2001; Randall &
Mulla, 2001; Dinnes et al., 2002). As such, better soil nitrogen management practices,
including more accurate fertilizer recommendations and placement, could help minimize
the contribution by agriculture to the NO
3
¯ pollution problem.
1.2 Precision agriculture and site-specific crop management
The profitability of farmed crops can be severely affected if poor nitrogen management
practices are used. Precision agriculture technology offers farmers the potential to more
intensely and precisely analyze variations in numerous field conditions throughout the
growing season, in association with environmental and crop response data in order to make
the most sound, and site- and time- specific, management decisions possible. At the same
time the public can be assured those practices are being conducted in the most
environmentally friendly way (Adamchuk et al., 2004a; Bongiovanni & Lowenberg-DeBoer,
2004; Bourenanne et al., 2004).
The inability to assess soil and plant data rapidly and inexpensively in the field, however,
remains one of the biggest limitations of precision agriculture (Adamchuk et al., 2004b). In
particular, the lack of a soil NO
3
–N measurement system is a major roadblock (Ehsani et al.,
1999). If this roadblock could be overcome, a positive contribution toward improving
precision agriculture technology would be made.
1.3 Variation in soil nitrate and its links to crop growth and yield
Soil NO
3
–N levels in agricultural fields, as well as other chemical and soil physical properties,
exhibit high variation spatially and temporally and at different measurement scales and levels
of aggregation (Heuvelink & Pebesma, 1999). Much research has been dedicated to assessing
In-eldmeasurementofsoilnitrateusinganion-selectiveelectrode 3
and characterizing this variation to improve our understanding of the effects of soil NO
3
–N on
crop growth and yield within agro-ecosystems (Almekinders et al., 1995).
Growing plants utilize varying amounts of soil NO
3
–N during different phenological
(growth) stages and its availability should ideally be in response to the plant’s need. In
wheat, for example, the level of available soil NO
3
–N during early plant growth determines
yield for the most part by influencing population density and the degree of stimulation of
tiller fertility, spikelet initiation, and floret fertility. Soil NO
3
–N uptake is greatly reduced
shortly after anthesis, and nitrogen is re-translocated from leaves primarily, and other
vegetative organs secondarily, to the ears to meet the need of the filling grains (Simpson et
al., 1983). The reduction in soil NO
3
–N uptake during grain filling varies with weather
conditions, disease pressures, and subsequent management practices (i.e. irrigation or
chemical applications) which put stress on the plants. Physiologically, soil NO
3
–N and crop
yields are linked via nitrate uptake and its conversion into proteins and chlorophylls during
plant growth (Engel et al., 1999; Schröder et al., 2000) and photosynthesis buffering against
soil nitrogen deficits by an abundance of RuBP carboxylase that serves as a reserve of
protein in the leaves during unfavourable weather conditions (Hay & Walker, 1989).
The availability and distribution of NO
3
–N in the soil depends on many soil forming,
chemical, microbial, plant growth, environmental, and management factors that influence
soil crop dynamics (Addiscott, 1983; Wagenet & Rao, 1983; Trangmar et al., 1985). Because
the effects of these factors and their interactions are highly variable (Almekinders et al.,
1995), they also lead to the characteristic behavior of NO
3
–N being highly variable within
the soil.
Studying the levels of nitrogen in various plant tissues and organs at the various phenological
stages simultaneously with the availability of soil NO
3
–N, and on a fine-scale, could provide
information to researchers and farmers useful for developing better site-specific nitrogen
management (SSCM) practices. Collecting this information at the required sampling intensity,
however, has been found to be very tedious and generally cost and time prohibitive using
current methods (Engel et al., 1999; Ehsani et al., 2001; Adamchuk et al., 2004a).
1.4 Assessing soil nitrate variation
Geostatistical techniques have been developed to provide practical mathematical tools for
assessing spatial and temporal variation, and spatial structure of soil properties including
soil NO
3
–N (Burgess & Webster, 1980; Webster & Burgess, 1984; Webster & McBratney,
1989; McBratney & Pringle, 1999).
Research applying these tools on a field-scale, such as through SSCM-experimentation
(Pringle et al., 2004), has led to the development of a multitude of methods for determining
minimum soil sample spacing, sampling grid layout and cell size (Russo, 1984; Han et al.,
1994; Van Meirvenne, 2003; Lauzon et al., 2005), optimum number of samples (Webster &
Burgess, 1984), sampling schemes and protocols for pre-planning experimental designs
(Trangmar et al., 1985; Chang et al., 1999; Ruffo et al., 2005) and sample bulking strategies
(Webster & Burgess, 1984).
However, when using these methods for implementing precision agriculture practices
related to soil nitrogen management, the “most serious obstacles” are still the need to know
the spatial structure in advance and the cost of obtaining this information even though the
sampling effort required is much less than for full-scale sampling (Lark, 1997; McBratney &
Pringle, 1999; Jung et al., 2006).
AdvancesinMeasurementSystems4
1.5 Concept of a soil nitrate mapping system
Development of an SNMS could contribute to the advancement of precision agriculture by
providing a way to quickly, accurately, and affordably collect the data necessary to analyze
small-scale variation in soil nitrate in time and space while crops are being grown, thus
enabling this variation to be linked to crop growth and yield. Ideally, an SNMS would
automatically collect a soil sample in the field and directly measure nitrate concentration in
real-time. Moreover, global positioning system (GPS) geo-referenced data could be
simultaneously recorded at each sampling location to enable a nitrate map to be created for
the field. An SNMS, thus, would overcome many of the impediments, roadblocks, and
serious obstacles of measuring and assessing soil NO
3
–N variation using conventional
methods in terms of sample analysis lag time, high labour requirements, and high costs as
discussed above. The overall objective of the experimental work described in this chapter was
to develop and validate such an advanced soil NO
3
–N measurement and mapping system.
2. Attempts by others to develop methods for in-field measurement
of soil nitrate
Over the last 20 years or so, attempts to develop a real time soil NO
3
–N measurement
system by other researchers have been based on three types of sensors: (i) ion-selective field
effect transistor (ISFET), (ii) ISE, and (iii) spectrophotometer. The majority of this research
work has not progressed past laboratory feasibility studies and testing in soil-bins. A brief
review of these works is presented below. Details can be obtained by reviewing the cited
papers directly, or the summaries contained in the comprehensive review paper recently
published by Adamchuk et al. (2004a) who concluded that “sensor prototypes capable of
accomplishing this task are relatively complex and still under development.”
2.1 Ion-selective field effect transistor sensor based systems
Loreto & Morgan (1996) developed a prototype real time soil NO
3
–N measurement system
that consisted of a soil core sampling wheel, indexing and processing table, and a data
acquisition and control system. This system was quite similar to that of Adsett & Zoerb
(1991); however it used a specially developed prototype ISFET as the NO
3
¯ analysis
instrument. In soil bin tests, correlations between ISFET measurements with a NO
3
¯–ISE and
laboratory colorimetric analysis measurements had an R
2
between 0.65 and 0.43,
respectively. The system worked reasonably well as a first attempt, but issues with the
ISFET’s response characteristics and calibration drift were apparent. Work has continued
focusing on the development of ISFET technology and its use in combination with novel soil
extraction and flow injection analysis (FIA) systems as a potential method of real-time
measurement of NO
3
¯ in filtered soil extracts (Birrell & Hummel, 1997, 2000, 2001; Price et
al., 2003). This work has resulted in the development of a promising combination
ISFET/FIA system that gives reasonable results compared to a cadmium reduction method
using a Lachat FIA (Slope 1:1, R
2
= 0.78) with a measurement time ranging between 3–5 s
(Price et al., 2003), but it is still at the laboratory level.
In-eldmeasurementofsoilnitrateusinganion-selectiveelectrode 5
2.2 Ion-selective electrode sensor based systems
A prototype nitrate monitoring system (NMS), was developed by Adsett (1990) and Adsett
& Zoerb (1991). It used a specially designed unit for NO
3
¯ extraction wherein the soil was
mixed with de-ionized water and then the liquid fraction was clarified before being
presented to the electrode for NO
3
¯ measurement. Although the system functioned
reasonably well as a first attempt, it had major difficulties with collecting a soil sample and
obtaining a clear extractant for NO
3
¯ measurement on a consistent basis. This early work
was the starting point from which improvements have been steadily made by Thottan et al.
(1994), Thottan (1995), Adsett et al. (1999), Khanna & Adsett (2001), and Sibley (2008) that
have advanced the system to the form described below in sections 5 and 6 into a fully
functioning and field-validated prototype SNMS.
As part of an investigation into the feasibility of a real time soil K and NO
3
−N mapping
system, Adamchuk et al. (2002a) performed laboratory tests on four commercially available
NO
3
¯–ISEs to simulate the direct soil measurement technique used in an automated soil pH
measurement system developed by Adamchuk et al. (1999, 2002b). In the laboratory,
manually remoistened previously air dried soil samples were pressed into contact with the
sensing membrane of each NO
3
¯–ISE to determine NO
3
¯ concentration (liquid basis of mg L
–
1
reported as ppm). These results were compared to a standard cadmium reduction
laboratory analysis technique to give an indication of the accuracy of the NO
3
¯–ISEs. For
individual soil samples, R
2
values ranging 0.38–0.63 were obtained, depending on the ISE,
while averaging of three repeated measurements yielded R
2
values ranging 0.57–0.86. It was
concluded that it is feasible to use a NO
3
¯–ISE for measuring soluble nitrate concentration of
naturally moist soil samples, but one of the main limitations of the proposed method
reported was difficulty in maintaining high quality contact between soil and electrode. It
should also be noted that use of the proposed method in the field in combination with the
pH measurement system’s soil sampling mechanism would not enable the NO
3
−N content
(mg kg
–1
) of the sample to be directly computed since the ‘weight’ (mass) of the soil sample
would not be known.
2.3 Spectrophotometer sensor based systems
Laboratory testing and field-based experimentation of a near-infrared (NIR)
spectrophotometer conducted by Ehsani et al. (1999) using soils samples spiked with
ammonium sulfate, ammonium nitrate, and calcium nitrate (10–100 ppm) revealed that soil
NO
3
–N could be detected with R
2
ranging 0.76–0.99 using partial least squares regression
with each data point being an average of 10 sub-samples. However, the calibration equation
must be derived from samples taken from the same location, otherwise the analysis
procedure fails. Further laboratory-based research work (Ehsani et al., 2001) using soil
samples spiked with ammonium nitrate and calcium nitrate (400–3000 ppm) and a
spectrophotometer equipped with a deuterated triglycine sulfate (DTGS) sensor showed
that the ratio of area under the nitrate peak to area under the water peak in the mid-infrared
(MIR) spectra is proportional to NO
3
¯ concentration (R
2
= 0.81), and that the analysis
technique is not dependent on the time of measurement, soil type, or nitrate source.
However, as the authors themselves note, the range of NO
3
¯ concentration in agricultural
soils is usually less than 100 ppm so the practicality of this sensing method is questionable
unless a more sensitive mercury cadmium telluride (MCT) type sensor can be used.
Use of a real-time portable spectrophotometer using a multi-spectral approach has been
AdvancesinMeasurementSystems6
investigated by Shibusawa et al. (1999, 2003). They reported that NIR reflectance could be
used to detect soil NO
3
–N with an R
2
of 0.50.
Christy et al. (2003) have conducted preliminary field testing of a prototype soil reflectance
mapping unit utilizing a NIR spectrophotometer for simultaneously measuring total N,
total carbon, pH, and moisture content. Results from testing in a single field indicated the
system could repeatably produce clear definition of patterns in these soil parameters related
to spectral reflectance with an R
2
of 0.86, 0.87, 0.72, and 0.82, respectively.
3. Ion-selective electrode theory and application for measuring soil nitrate
The nitrate ion-selective electrode (NO
3
¯–ISE) (Fig. 1) provides a rapid and reliable method
for quantitative analysis of soil nitrate. Nitrate ISEs, which are highly selective to NO
3
¯ ions
in solution, were first used around 1967 as quick and reliable alternatives to chemical-based
laboratory methods for nitrate measurement (Dahnke, 1971). The NO
3
¯–ISE
electrochemically generates a voltage across its organophilic membrane that varies with
ionic strength (molarity) of the solution according to the Nernst equation (Morf, 1981).
E = E
o
+ S log (A) (1)
where E is the electrochemical cell potential (mV), E
0
is the standard potential (mV) in a 1M
solution, ideally a constant, S is the electrode slope (–mV per decade of concentration), and
A is the nitrate activity (effective concentration moles L
–1
) in the solution.
Through calibration with known standards, the logarithm of solution molarity is related to
electrode output voltage to determine a linear calibration curve for determining nitrate
concentration (mg L
–1
or ppm) of subsequent soil samples.
Typically in the laboratory, measurement of nitrate concentration of a soil sample then
proceeds by mixing together a known ‘weight’ (mass) of soil with a known volume of
deionized or distilled water (e.g. soil:extractant ratio). After an appropriate extraction time, the
extractant in the mixture is decanted from the soil particles and clarified by filtration. Then the
molarity of the clarified extractant is measured with the NO
3
¯–ISE. The resulting electrode
voltage output is mathematically converted to concentration via the calibration curve, and
subsequently to content (mg kg
–1
) via the soil:extractant ratio.
Many researchers over the years have studied various aspects of NO
3
¯–ISE performance
(accuracy, repeatability, stability, reliability), the potential for measurement interference by
other ions, solution ionic strength, and use of deionized or distilled water as an extractant, for a
multitude of use conditions, and in comparison with other chemical-based laboratory methods
of soil nitrate determination (Myers & Paul, 1968; Mahendrappa, 1969; Milham et al., 1970;
Onken & Sunderman, 1970; Dahnke, 1971; Mack & Sanderson, 1971; Yu, 1985; Sah, 1994).
In-eldmeasurementofsoilnitrateusinganion-selectiveelectrode 7
(a) (b)
Fig. 1. The Orion 97-07 ionplus nitrate ion-selective electrode. (a) Pictorial diagram, (b)
cross-section diagram of the electrode’s nitrate sensing module (Orion, 2005).
As a result, NO
3
¯–ISEs have enjoyed wide acceptability because the results obtained are
comparable to other chemical-based methods’ results, and they are quick and simple to use.
Today, several types of NO
3
¯–ISEs are manufactured commercially, and they are widely
used in laboratories around the world for water quality monitoring and plant tissue sap
nitrate measurement in addition to soil nitrate measurement. It is because of their well-
defined operating characteristics, reliability, and commercial availability that a NO
3
¯–ISE
was chosen as the analysis instrument for the SNMS to perform direct in-field measurement
of NO
3
¯ in a soil slurry.
4. Experiments conducted for determining electrode operating
variable parameters
Laboratory work conducted by Thottan et al. (1994) and Thottan (1995) determined that a
NO
3
¯–ISE could be used in a soil slurry whilst investigating operating variables of
soil:extractant ratio, slurry clarity, and electrode response time, repeatability and output
signal stability.
Soil samples of sandy loam, silty clay loam, and clay loam were taken from the surface layer
(15 cm) of fields in Cumberland and Colchester counties of Nova Scotia, Canada (45
0
N, 63
0
W). The results reported in this chapter relate to Chaswood clay loam, since of the three
AdvancesinMeasurementSystems8
soils tested it is considered to be more difficult to analyze because of the higher clay content
than the coarser textured soils. The Chaswood soil is of the gleysolic order, of the subgroup
RegoGleysol. Particle size analysis revealed a composition of 34.0% sand, 37.9% silt, and
28.1% clay. The sampled A horizon was a fine textured alluvial formation which had been
deposited above loamy sand.
Testing of the soil:extractant ratio revealed that there was no significant difference (α = 0.05)
between final NO
3
¯ concentrations for the three ratios tested. The mean NO
3
¯ concentrations
determined at soil:extractant ratios of 1:15, 1:5 and 1:3 were 18.6, 18.6, and 19.3 ppm,
respectively. In terms of mechanical extractor design, these results indicated that any of the
three ratios may be used in the field when extracting NO
3
¯ from soil with equal
effectiveness.
Tests to determine the effect of clarity on electrode performance showed that there was no
significant difference (α = 0.05) between mean final NO
3
¯ concentration measured in either
slurry (34.1 ppm), decanted (32.0 ppm), or filtered (33.8 ppm) soil samples. This result
confirmed the hypothesis that the NO
3
¯–ISE could be used in a soil slurry during in-field
use—obviating the need for time consuming filtering of soil extracts required by other
nitrate determination methods that would complicate mechanical system design and slow
down operation. Using a NO
3
¯–ISE, Paul & Carlson (1968), Myers & Paul (1968), Dahnke
(1971) and Yu (1985) also found that there was no significant difference between nitrate
determinations made in a slurry or filtrate.
Fig. 2. shows a typical response curve of the NO
3
¯–ISE in a soil slurry. The electrode
potential drops sharply indicating a rapid release of nitrate into solution. It was found that
the electrode detects a large percentage of the nitrate concentration in less than 20 s, but it
takes up to two minutes to detect the total nitrate concentration as the electrode signal
stabilizes. Electrode signal stability was considered to be achieved when a signal drift of less
than 1 mV min
−1
was obtained. It was also found that the electrode had very consistent
response time curves. Therefore, it was hypothesized that it was not necessary to wait until
100% of the NO
3
¯ in a soil sample is extracted before taking a measurement. This
characteristic was utilized to create normalized response curves (Adsett et al., 1999) to
speed up the measurement cycle. Accurate and reliable estimates of the sample’s total NO
3
¯
concentration could be made in six seconds, which is within the time required for rapid in-
field measurements. A successful mechanical system, however, would depend not only on a
properly functioning and calibrated electrode, but also on properly functioning mechanical
components, electronics, and controls to enable it to be reliably used in the field.
In-eldmeasurementofsoilnitrateusinganion-selectiveelectrode 9
Fig. 2. Typical electrode response in soil slurry during nitrate extraction and measurement
(Thottan et al., 2004).
5. Systems developed for in-field measurement and mapping of soil nitrate
In this section, a description of the mechanical systems and their operation for soil nitrate
extraction and measurement are presented and discussed. First will be a description of the
SNMS, followed by a description of the nitrate extraction and measurement sub-unit (NEMS).
5.1 Soil nitrate mapping system
Sibley (2008) and others (e.g.,Thottan, 1995; Adsett et al., 1999; Khanna & Adsett, 2001) have
developed a SNMS (Fig. 3) that uses a nitrate ion-selective electrode (NO
3
¯–ISE) (Orion
Model 9707 ionplus, Thermo Electron Corp., Massachusetts, USA) as the measurement
instrument. It is an electro-mechanical machine that automatically collects a soil sample (0–
15-cm depth), mixes it with water, and directly analyzes it electrochemically for nitrate
concentration in real-time (6 s). Additionally, global positioning system (GPS) geo-
referenced position data are simultaneously recorded at each sampling location to enable a
nitrate map to be created for the field being sampled.
The SNMS consists of six sub-units: (1) soil sampler, (2) soil metering and conveying, (3)
nitrate extraction and measurement, (4) auto-calibration, (5) control, and (6) GPS as
indicated in Fig 3.
AdvancesinMeasurementSystems10
7
Fig. 3. Soil nitrate mapping system with six sub-units: (1) soil sampler, (2) soil metering and
conveying,(3) nitrate extraction and measurement, (4) auto-calibration, (5) control and (6)
global positioning system, with (7) inset showing Orion 97-07 ionplus NO
3
¯-ISE used for
measuring soil nitrate (adapted from Sibley, 2008).
Prior to use, the NO
3
¯–ISE is calibrated using pre-prepared reagent-grade NO
3
¯ standards
placed into the calibration cups of the auto-calibration sub-unit. As well, a field (soil
condition) calibration is completed to enable rapid measurements of NO
3
¯ concentration to
be taken during system operation. As the tractor moves forward, the SNMS collects a soil
sample via the combination of soil sampler and soil metering and conveying sub-units.
During sampling, the hydraulic-powered wood-saw blade is lowered into the soil by the
carrying frame. Over a travel distance of approximately 0.5 m, the blade cuts a 15-cm deep
slot and throws a spray of finely chopped soil onto the head-end area of an automatically
positioned flat-belt transfer conveyer. This action creates a sample of uniform bulk density
and finely-granulated particles to facilitate the subsequent nitrate extraction process (Sibley
et al., 2008). The conveyor belt has an oblong fixed-volume pocket milled into its surface to
collect a sample from the soil landing on the conveyor. A specially designed scraper placed
above the belt levels the soil sample in the pocket without compaction and removes excess
soil from the belt as the belt moves to deliver the soil sample to the NEMS. During delivery,
the pocket stretches lengthwise as it passes around the conveyor’s tail-end roller to facilitate
complete emptying of the pocket.
Just prior to soil sample delivery, water for NO
3
¯ extraction is pumped into a nitrate
extractor to completely submerge the sensing module of the NO
3
¯–ISE and the stirrer is
activated. The soil sample is received into the extractor where vigorous mixing takes place
In-eldmeasurementofsoilnitrateusinganion-selectiveelectrode 11
creating a soil slurry. Nitrate in the soil sample is rapidly extracted into the slurry. The NO
3
¯
concentration of the mixture is measured by the NO
3
¯–ISE and stored in the control system’s
computer memory. Geo-referenced position data are simultaneously recorded by the GPS
sub-unit at each sampling location to enable a nitrate map to be subsequently created for the
field. All data collected are downloaded to a computer for post-sampling processing via the
computer-interface facility built into the control system.
The SNMS can be used to analyze soil samples automatically in real time, or manually while
stationary by hand-placing samples into the NEMS. It is envisioned that two configurations
of the system will eventually be used in practice—a tractor-mounted version (Fig. 3.) and a
‘suitcase’ (portable) version. Initial research on developing a ‘suitcase version’ was
completed by Brothers et al., (1997). The prototype developed was capable of measuring
NO
3
¯ and pH with the same mechanical system and control hardware.
5.2 Nitrate extraction and measurement sub-unit
The heart of the SNMS is the NEMS (Fig.4). It consists of an extractor, an impeller and drive
motor, a spray nozzle, a gate valve and drive actuator, and the NO
3
¯–ISE. The electrode and
the sample, plus associated electrode circuitry, comprise an electrochemical cell. The
extractor was constructed using 9.5 cm ID clear acrylic tubing so that the extraction process
could be viewed.
A 7.6 cm ID sliding-knife gate valve was installed to act as the bottom of the extraction
chamber, forming the extraction chamber outlet. This arrangement gives a nearly full-
diameter chamber pass-through capability for efficient clean-out of each sample and
prevents potential jamming by small stones or field debris that might enter the chamber
with the soil sample. A 12Vdc linear actuator is used to open and close the valve between
samples.
In normal position, the extraction chamber outlet is kept closed by the actuator. When the
actuator is powered, it opens the extraction chamber outlet. The extraction chamber was
electrically isolated from other components to eliminate any stray voltages that may
interfere with the NO
3
¯–ISE signal.
The added advantage of having the extraction chamber outlet normally closed was that the
extraction chamber could be used as a storage unit for the electrode in a dilute NO
3
¯
standard solution when not being used. To the lower end of the valve, a 3.5-cm diameter
polyvinyl chloride (PVC) pipe was connected. The PVC pipe provided structural support
and electrical isolation for the extraction chamber, as well as being an extension of the
extraction chamber outlet.
AdvancesinMeasurementSystems12
Signal
conditioner
Extractor
Calibration
cups
Actuator
Spray nozzle
Stirrer
Fig. 4. Soil nitrate extraction and measurement sub-unit. Inset is a close-up view of the
extractor showing a measurement being taken in a soil slurry.
A full cone spray nozzle was placed just above the extractor for supplying the water and
also for cleaning purposes between successive samples. The nozzle was connected to a
supply hose and a pump. A solenoid valve was fitted in between the nozzle and the pump
to allow on/off flow control and also to meter in the exact amount of water under computer
control by controlling the length of time the valve is turned on.
The mixing mechanism consisted of a fibreglass shaft with an acrylic impeller attached to
one end. The fibreglass shaft was used in order to eliminate the possibility of any stray
voltage being conducted into the extraction chamber. The shaft was powered using a
variable speed 12 Vdc motor and was operated at 300 rpm.
6. Electronic control sub-unit, measurement methodology and operation of
the nitrate extraction and measurement sub-unit
Development of the control sub-unit to operate the NO
3
¯–ISE within the NEMS and the
dirty, electrically noisy environment of an agricultural tractor required development of
significant advances in instrumentation signal conditioning and processing circuitry. These
advances are discussed in this section.
6.1 Electronic control sub-unit
A schematic diagram of the electronic control sub-unit is shown in Fig. 5. The electronic
control sub-unit consists of electronic circuitry, relays, a potentiometer, I/O ports, switches,
and a key pad all housed in two electrically isolated and waterproof metal boxes. These are
the control box shown in Fig. 3 and the signal conditioner box shown in Fig. 4, inside which
the functions of signal processing and system control, and signal conditioning occur,
respectively. The nitrate electrode sensing module generates a very small signal in mV,
which is entered as input to the signal conditioning circuitry. Before leaving the signal
In-eldmeasurementofsoilnitrateusinganion-selectiveelectrode 13
conditioner box the signal is converted to mA to prevent degradation as it travels along a
cable to the processing circuitry contained in the control box. The heart of the processing
circuitry is an EnT board (Advanced Monitoring Technologies Inc., New Brunswick,
Canada) with eight analog and eight digital input ports, plus transistor and relay outputs.
The BS2SX Stamp main processor and the BS2 Stamp chip are mounted in two on-board 24
pin sockets. The mA inputs received from the conditioning box are converted back to mV
and then pass through A/D conversion. The digital signals are then processed by the
Stamp BS2SX software program to produce a digital number which is stored in RAM. The
digital number is subsequently used after data downloading for calculating the NO
3
¯ level
represented by each electrode reading using a spreadsheet program. Each NO
3
¯
measurement is accompanied by its geographic position coordinates as determined by a
tractor-mounted GPS system (GBX-PRO with GPS/BCN, CSI Wireless Inc., Alberta,
Canada). Sample location coordinates are stored in RAM.
The BS2SX Stamp main processor, also through the software program, controls the various
mechanical components of the SNMS using 12 Vdc output relays mounted on the EnT
board with simple ON/OFF switching. These mechanical components are pumps, solenoid
valves, a linear actuator, and electric motors.
6.2 Operation of the nitrate extraction and measurement sub-unit
The operation of the NEMS includes the following procedures:
1. Electrode (NO
3
¯–ISE) Calibration
2. Field Calibration
3. Soil NO
3
¯–N analysis
The electrode calibration procedure is important since the reliability of the NO
3
¯
measurements depends entirely upon proper calibration of the NO
3
¯–ISE. Two NO
3
¯
standard solutions of known concentrations (0.0001M and 0.1M) made from reagent grade
KNO
3
crystals mixed with de-ionized water are used for calibration. The NEMS software
provides an auto-calibration routine which performs a calibration under computer control.
The electrode calibration provides the coefficients for the Nernst from which the NO
3
¯
concentration is calculated. Thottan et al. (1994) and Thottan (1995) describe the calibration
theory and process in detail.
Once the electrode calibration is completed, a field calibration is used to speed up the NO
3
analysis time. The calibration determines a scaling factor which allows the prediction of the
sample NO
3
¯ value (which occurs at electrode signal stability and which could take up to
two minutes or more) after a short measurement time of six seconds (Thottan, 1995, Adsett
et al., 1999).
AdvancesinMeasurementSystems14
Fig. 5. Schematic diagram of the electronic control unit measurement and control circuitry,
and electro-mechanical components.
The scaling factor can differ from field to field according to variations in soil characteristics,
thus the name ‘field calibration’, and thus the necessity of the procedure. Also the field
calibration is essential to monitor changes in the speed of response of the electrode’s
organophilic sensing membrane that have been observed with prolonged usage. A slowing
of the response speed indicates it is time to change the electrode’s sensing module. The time
used to determine when to change the module was when it took longer than two minutes to
perform a field calibration measurement. To-date, the NEMS has been used to analyze over
8,000 soil samples. And as many as 2,000 samples have been analyzed before it became
necessary to change the sensing module. The membrane of the sensing modules used
during this time has not showed any appreciable abrasion wear from soil particle contact.
Early work by Thottan (1994) and Thottan et al. (1999) performed a field calibration by
measuring soil NO
3
¯–N using a sufficient number of samples through to electrode signal
stability so as to determine the response characteristics of the NO
3
¯–ISE for the particular
soil type in the field being sampled. Data analysis then used a statistical routine
In-eldmeasurementofsoilnitrateusinganion-selectiveelectrode 15
programmed into the control system software to determine the quickest time that resulted
in a CV less than 5% with a 95% confidence level. The data corresponding to this time were
used to calculate a scaling factor that was subsequently used to predict the final NO
3
¯
concentration of a sample after measuring for this time. Six seconds always gave reliable
results, and even sometimes four seconds were sufficient.
Recent work (Khanna & Adsett, 2001; Sibley, 2008) has advanced the field measurement
process even further such that a field calibration can now be based on one soil sample taken
at a location considered typical of the soil texture in the field. During field calibration the
NO
3
¯ electrode signal (x) is measured at six seconds, and again at electrode signal stability
(y). These x and y values are stored in Scratch Pad RAM and the scaling factor (y/x ratio) is
calculated by the software program. The scaling factor is then used for prediction of the
final NO
3
¯ value for all subsequent samples taken in that field. Following field calibration,
soil samples can be collected and analyzed for NO
3
¯ every 40 seconds (6 seconds for NO
3
¯
analysis and 34 seconds for other mechanical system functions to cycle). Sibley et al. (2009)
has found this y/x routine sufficient for field use. After field calibration, soil samples can be
collected and analyzed for NO
3
¯.
Just prior to a soil sample being deposited into the extractor, water for NO
3
¯ extraction is
pumped into the extractor to completely submerge the electrode’s sensing module and the
stirrer is activated. The soil sample is deposited into the extractor where the stirrer
vigorously mixes the soil slurry into which NO
3
¯ is rapidly extracted from the soil sample.
The NO
3
¯ concentration of the slurry is measured by the NO
3
¯–ISE and stored in the control
system’s computer memory. Geo-referenced position data are simultaneously recorded by
the GPS sub-unit at each sampling location to enable a nitrate map to be subsequently
created for the field. All data collected are downloaded to a computer for post-sampling
processing via the computer-interface facility built into the control system.
7. Experiments conducted to validate in-field measurements of soil nitrate
obtained with the ion-selective electrode
Extensive field-scale validation testing of the NEMS in two crop (wheat and carrot)
production systems in Nova Scotia, Canada was conducted in 2006 (Sibley et al., 2009). Field
conditions used for testing included conventional tillage vs. no tillage, inorganic vs. organic
fertilization, four soil groups, and three time points throughout the season. Field moisture
content ranged between 12.5–28.5%.
Data was collected with the NEMS and analyzed using four data processing methods: i)
integer number (IN), ii) real number (RN), iii) integer number plus moisture content
correction (IN+MCC), and iv) real number plus moisture content correction (RN+MCC).
Duplicate samples were also analyzed in the laboratory using standard potassium chloride
(KCl) extraction and flow injection analysis methods.
The results indicated that the level of agreement between NEMS soil NO
3
–N measurements
and standard lab soil NO
3
–N measurements (Lab), as measured by Root Mean Squared
Error (RMSE), Mean Absolute Error (MAE) and Coefficient of Efficiency (CE) was excellent.
The results obtained also strongly suggest that the NEMS is quite robust and can be used for
measuring soil NO
3
–N in both wheat and carrot crops, as well as in different soil groups,
fertility levels, tillage conditions, and at any time throughout the season.
Representative graphs comparing NEMS and Lab soil NO
3
–N measurements over all field
AdvancesinMeasurementSystems16
0
5
10
15
20
25
30
35
40
45
50
1 2 3 4 5 6 7 8 9 10 11 12 13
Sample Location
�
0
5
10
15
20
25
30
35
40
45
50
1 2 3 4 5 6 7 8 9 10 11 12 13
Sample Location
Laboratory
SNMS RN
SNMS IN
SNMS RN+MCC
SNMS IN+MCC
0
5
10
15
20
25
30
35
40
45
50
1 2 3 4 5 6 7 8
Sample Location
�
0
5
10
15
20
25
30
35
40
45
50
1 2 3 4 5 6 7 8
Sample Location
�
a
S o il N O
3 ¯
N
(
m
g
k
g
ֿ ¹
)
S o il N O
3 ¯
N
(
m
g
k
g
ֿ ¹
)
S o il N O
3 ¯
N
(
m
g
k
g
ֿ ¹
)
S o il N O
3 ¯
N
(
m
g
k
g
ֿ ¹
)
b
c
d
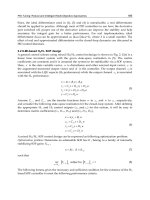
conditions tested are shown in Fig. 6. These graphs illustrate the how well the electrode
performed in the field on an individual sample basis, regardless of the field condition from
which the sample originated.
Fig. 6. Comparison of NEMS soil NO
3
-N measurements for each data processing method
with Lab soil NO
3
-N measurements by sample location. (a) Wheat plot 6 (NT, DRT52) on 30
May, (b) wheat plot 8 (CT, PGW52) on 7 Nov., (c) carrot plot 2 (IF, PGW82) on 20 June and
(d) carrot plot 3 (LDM, DRT22) on 7 Nov. (Sibley et al., 2009).
As well, they also indicate the responsiveness of the electrode, as the values are displayed
by sampling location (x-axis) in the order of measurement. It was found that the electrode
responded equally well regardless of whether the NO
3
–N level was changing from lower to
higher, or higher to lower during measurement.
Nested linear regression analyses revealed that the NEMS had the same level of
performance over all field conditions tested regardless of what data processing method was
used (Sibley et al., 2009).
It was concluded that any of the regression equations developed for describing the
relationship between NEMS measurements and Lab measurements for the four data
processing methods tested (Fig. 7) can be used to enable field measurements of soil NO
3
–N
using the NEMS to be obtained with lab-grade accuracy.
In-eldmeasurementofsoilnitrateusinganion-selectiveelectrode 17
706050403020100
70
60
50
40
30
20
10
0
706050403020100
70
60
50
40
30
20
10
0
Lab Soil NO
3¯
N (mg kg
ֿ¹)
NEMS Soil NO
3¯
N (mg kg
ֿ¹)
a
b
c
d
Lab NO
3
-N = 0.727 + 1.09 NEMS IN NO
3
-N
Lab NO
3
-N = 0.131 + 1.24 NEMS RN NO
3
-N
Lab NO
3
-N = 0.490 + 0.89 NEMS IN+MCC NO
3
-N Lab NO
3
-N = −0.040 + 1.00 NEMS RN+MCC NO
3
-N
(R
2
= 0.905, n = 381) (R
2
= 0.933, n = 381)
(R
2
= 0.910, n = 380) (R
2
= 0.936, n = 381)
Fig. 7. Relationship between NEMS soil NO
3
-N measurements and laboratory soil NO
3
-N
measurements for each data processing method; all field conditions data combined. (a)
Integer number data processing, (b) real number data processing, (c) integer number with
moisture content correction data processing and (d) real number with moisture content
correction data processing (adapted from Sibley et al., 2009).
8. Significance of the soil nitrate mapping system
The development of the SNMS, including its NEMS, is a significant advancement in real-
time field measurement of soil NO
3
–N from two main perspectives: (i) linking soil NO
3
–N
variation to crop growth, and (ii) assessing soil nitrate variation. These perspectives are
discussed below along with some results of experiments conducted using the system in
wheat and carrot production systems in Nova Scotia, Canada.
8.1 Linking soil nitrate variation to crop growth
Using data collected by the NEMS on small-scale sampling grids (6.0 × 7.5 m) at seven
sampling dates before, during, and after crops were being grown, the variation in soil NO
3
–
N levels in wheat and carrot production systems over time were linked to crop performance
(Sibley, 2008). In wheat under organic fertilizer management, the effects of conventional
tillage vs. no tillage on soil nitrate, plant nitrogen and yield responses were determined. In
carrot under conventional tillage management, the effects of inorganic fertilizer vs. organic
fertilizer on soil nitrate, plant nitrogen and yield responses were determined.
In wheat, it was determined that the only significant difference (α = 0.05) in mean soil NO
3
–
N level between the conventional tillage and no tillage treatments occurred early in the
growing season shortly after fertilizing, when the level for the conventional tillage
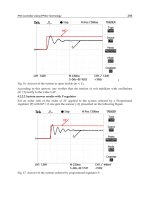
treatment was nearly two times higher than for the no tillage treatment (Fig. 8).
AdvancesinMeasurementSystems18
Day of Year
3
1
1
2
3
6
2
2
7
2
1
3
1
9
9
1
5
0
1
2
3
30
25
20
15
10
5
0
NT
CT
cde
e
cde
bcd
bc
b
e
de
e
cde
bcd
a
cde
e
Seeding
Harvest
Soil NO
3¯
N (mg kg
ֿ¹)
Fig. 8. Soil NO
3
–N response at 0–15-cm depth to conventional tillage (CT) and no tillage
(NT) treatments in the wheat field over the study period. Means sharing the same letter are
not significantly different at the 5% level (Sibley, 2008).
There was no significant difference (α = 0.05) in the response of plant tissue Total N to the
conventional tillage and no tillage treatments; however a significant Day effect was
detected. Significant differences (α = 0.05) were found in mean tissue Total N level between
grain set, grain filling, and maturity, but no significant difference thereafter. Mean plant
tissue-sap NO
3
–N, grain yield and grain Total N all showed no significant difference (α =
0.05) in response to the conventional tillage and no tillage treatments. These results suggest
that the plants responded equally well at producing final grain yield under either the
conventional tillage or no tillage management practice and despite there being significant
changes in soil NO
3
–N level over the growing season.
In carrot, early in the growing season shortly after fertilizing, the soil NO
3
–N level for the
inorganic fertilizer treatment was nearly three times higher than for the liquid dairy manure
treatment, while for the remainder of the growing season it remained in the order of two
times higher (Fig. 9). There was a significant (α = 0.05) increase in soil NO
3
–N for both the
inorganic fertilizer and liquid dairy manure treatments after harvest at the end of the study
period in late-Fall. It is suspected that these late-Fall increases were due to a ‘tillage effect’
from mechanical harvesting in combination with a short-term increase in soil temperature
typical for the geographic area.
In-eldmeasurementofsoilnitrateusinganion-selectiveelectrode 19
Day of Year
3
1
1
2
9
7
2
8
4
2
6
9
2
5
6
2
2
7
1
7
1
1
2
4
30
25
20
15
10
5
0
IF
LDM
bcd
fg
fg
fg
efg
efg
def
fg
bc
cde
b
bcbc
bc
a
g
Seeding
Harvest
Soil NO
3¯
N (mg kg
ֿ¹)
Fig. 9. Soil NO
3
–N response at 0–15-cm depth to inorganic fertilizer (IF) and liquid dairy
manure (LDM) treatments in the carrot field over the study period. Means sharing the same
letter are not significantly different at the 5% level (Sibley, 2008).
There was no significant difference (α = 0.05) in mean plant tissue-sap NO
3
–N response to
the inorganic fertilizer and liquid dairy manure treatments; however a significant Day effect
was detected. During mid-growth stage, plant tissue-sap NO
3
–N levels were sufficient for
maximum top-biomass growth and root yield and then dropped off dramatically during
active root bulking until homeostasis was reached. The level remained unchanged between
homeostasis and the time the roots were harvested.
Plant tissue Total N level for the inorganic fertilizer treatment dropped significantly during
active root bulking and then stabilized for the remainder of the growing season. During this
same period for the liquid dairy manure treatment, tissue Total N level also dropped
significantly (α = 0.05), but unlike for the inorganic fertilizer treatment, continued to drop
dramatically instead of stabilizing. This dramatic drop was attributed to a combination of
factors including weakness of the liquid dairy manure treated plants at that time resulting
in a higher rate of leaf senescence that enabled sufficient N re-translocation to meet the
needs of the bulking roots, rainfall-induced nitrification in the soil which was limiting N
availability to the plants, and a leaching effect of the heavy rains on the senescing leaves.
There was no significant difference (α = 0.05) in fresh root yield or root Total N between the
treatments. These results suggest that the plants took up enough N during shoot growth to
sustain root bulking, thereby utilizing stored N for root bulking rather than relying on
available N in the soil. These results further suggest that although there were significant
changes in soil NO
3
–N levels over the growing season, and between the inorganic fertilizer
and liquid dairy manure treatments, they did not affect very much what was happening in
the carrot plants. This finding stresses the environmental implications of managing soil
NO
3
–N in a carrot production system.