Báo cáo hóa học: " Investigation of cracks in GaN films grown by combined hydride and metal organic vaporphase epitaxial method" ppt
Bạn đang xem bản rút gọn của tài liệu. Xem và tải ngay bản đầy đủ của tài liệu tại đây (4.06 MB, 8 trang )
NANO EXPRESS Open Access
Investigation of cracks in GaN films grown by
combined hydride and metal organic vapor-
phase epitaxial method
Jianming Liu
1*
, Xianlin Liu
1*
, Chengming Li
1
, Hongyuan Wei
1
, Yan Guo
1
, Chunmei Jiao
1
, Zhiwei Li
1
, Xiaoqing Xu
1
,
Huaping Song
1
, Shaoyan Yang
1
, Qinsen Zhu
1
, Zhanguo Wang
1
, Anli Yang
1
, Tieying Yang
2
, Huanhua Wang
2
Abstract
Cracks appeared in GaN epitaxial layers which were grown by a novel method combining metal organic vapor-
phase epitaxy (MOCVD) and hydride vapor-phase epitaxy (HVPE) in one chamber. The origin of cracks in a 22-μm
thick GaN film was fully investigated by high-resolution X-ray diffraction (XRD), micro-Raman spectra, and scanning
electron microscopy (SEM). Many cracks under the surface were first observed by SEM after etching for 10 min. By
investigating the cross section of the sample with high-resolution micro-Raman spectra, the distribution of the
stress along the depth was determined. From the interface of the film/substrate to the top surface of the film,
several turnings were found. A large compressive stress existed at the interface. The stress went down as the
detecting area was moved up from the interface to the overlayer, and it was maintained at a large value for a long
depth area. Then it went down again, and it finally increased near the top surface. The cross-section of the film
was observed after cleaving and etching for 2 min. It was found that the crystal quality of the healed part was
nearly the same as the uncracked region. This indicated that cracking occurred in the growth, when the tensile
stress accumulated and reached the critical value. Moreover, the cracks would heal because of high lateral growth
rate.
Introduction
Group III nitrides are attracting much attention for
short-wavelength light emitters and high-temperature
electronic devices. Nitride-based devices are mostly het-
eroepitaxially grown on non-native substrates, such as
sapphire (Al
2
O
3
), Si, GaAs, and SiC. The dif feren ces of
thermal expansion coefficient (TEC) and lattice constant
between GaN and foreign substrates usually induce a
large residual stress in thick GaN films. Homoepitaxy is
very essential to improve the crystal quality. Hydride
vapor-phase epitaxy (HVPE) is a promising technique
for growing thick GaN film at reasonable cost. The con-
ventional method of growing high quality thick film
needs two systems. Before depositing the thick layer by
HVPE, a template has been predeposited by MOCVD
[1]. Compared with the conventional growth method,
the combined hydride and metal organic vapor-phase
epitaxial (MOCVD-HVPE) in one chamber has several
great advantages: (1) the MOCVD and HVPE run in the
same reactor without time-consuming modification or
equipments replacement; (2) furthermore, the cracks
and contamination introduced in the course of transfer
can be voided; and (3) the growth methods can be alter-
nated if necessary.
However, cracks are often produced in GaN thick film
grown by HVPE. There are several intriguing aspects for
the observed cracks of GaN on sapphire substrates. Itoh
et al. [2] proposed that the cracks originated from the
static cooling process. As the thermal expansion coeffi-
cient of GaN is smaller than that of sapphire [3], the
film will suffer from biaxial compressive stress during
cooling. Etzkorn and Clarke [4] also observed cracks in
GaN film deposited by HVPE on SiC substrate. In our
article, the cracks existing in GaN thick films were
observed directly and the probable formation mechan-
ism was proposed.
* Correspondence: ;
1
Key Laboratory of Semiconductor Materials Science, Institute of
Semiconductors, Chinese Academy of Sciences, P. O. Box 912, Beijing
100083, People’s Republic of China
Full list of author information is available at the end of the article
Liu et al. Nanoscale Research Letters 2011, 6:69
/>© 2011 Liu et al; licensee Springer. This is an Open Access article distributed under the t erm s of the Creative Commons Attribution
License ( g/licenses/by/2.0), which permits unrestricted use, distribution, and reproduction in any medium,
provide d the original work is properly cited.
Experiments
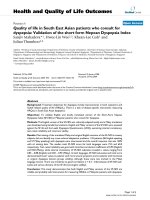
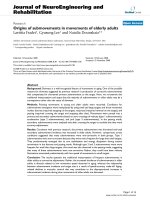
The sample was grown using a homemade MOCVD-
HVPE system, as shown in Figure 1. The reactor system
consists of two temperature zones which are heated by
resistance wire heate r. The liquid gallium (Ga) was
heated to 900°C by the first heater for reacting with
hydrogen chloride (HCl); the substrate was heated up to
1050°C using the second heater. Before depositing GaN
thick film, a 60-nm thick low temperature (550°C) GaN
buffer layer and a 0.82 -μm thick high temperature layer
were predeposited on a c-plane sapphire substrate by
MOCVD. Ammonia (NH
3
) and trimethylgallium
(TMGa) were used as N and Ga sources with the flow
rate of 0.18 mol min
-1
and 50 μmol min
-1
, respectively.
In addition, N
2
was used as carrier gas with the flow
rate of 2 standard liters per minute (SLM). In the HVPE
experiments, GaCl was formed by the reaction of gas-
eous HCl and liquid Ga at 900°C, and then reacted with
NH
3
to grow GaN thick film. A 22-μm thick film was
deposited by HVPE, with the HCl flow rate being 50
standard cubic centimeters per minute (sccm), NH
3
flow rate being 4 SLM, and the N
2
carrier gas flow rate
being 2 SLM.
The high-resolution X-ray diffraction (D8 discover)
was used to determine the lattice constant c near top
surface. The curvature was also determined by this
equipment, following the suggestion given by Liu et al.
[5]. D8 discover was equipped with a twofold hybrid
monochromatic and a threefold G e (220) analyzer. The
crystal quality of the sampl e was characterized using the
high-resolution X-ray diffraction apparatus at Beijing
Synchrotron Radiation Facility. The micro-Raman mea-
surements were do ne using JYHR800 Raman sp ectrum.
The laser was an argon ion laser operating at 514.5 nm.
The spectral frequency resolution was less than 0.2 cm
-1
and the spatial resolution was less than 1 μm. The error
bar is 0.2 cm
-1
. All micro-Raman spect ra were recorded
in the backscattering geometry. The spectrometer was
calibrated using single-cryst al silicon as a reference. The
surface morphology and cracks were observed by SEM
(using Hitachi S4800). The cathodoluminescence (CL)
was performed in a scanning electron microscope (SEM)
using Gantan mono CL system at room temperature.
Results and discussion
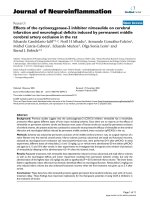
The overall crystal quality of the sample was determined
by high-resolution X-ray diffraction with Synchrotron
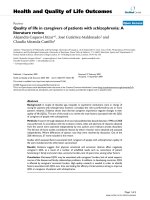
Radiation as light source. As illustrated in Figure 2a, the
rocking curves o f (0002) a nd (10
12)wereobtainedand
the full widths at half maximum (FWHM) were 970 and
1358 arc seconds, respectively. The phi scan presents a
sixfold symmet ry of wurtzite structure of GaN, as
shown in Figure 2b. The dislocation density of the crys-
tal was about 2 × 10
9
cm
-2
determined by XRC and
AFM after selective etching [6,7].
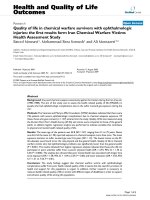
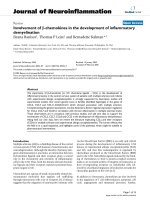
In order to observe the cracks under the surface, the
sample was etched for 5 and 10 min in a solution of
H
2
SO
4
:H
3
PO
3
(3:1) at 200°C, and the two samp les were
marked as Af5 and Af10, respectively. The unetched
sample was labeled as A. The etching rate was about 0.2
μm min
-1
. Cracks were observed on surface till the sam-
ple was etched for 10 min, as illustrated in Figure 3c.
The underlayer cracks were also observed by optical
microscope, as illustrated in Figure 3d. In the trans-
mitted light image, the cracks were parallel to {1010}
plane and formed a network arranged at 120° with each
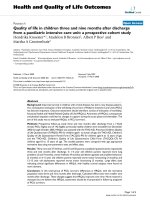
other. The effects of grain boundaries and dislocations
have been revealed by CL mapping. The crystal quality
of the grain boundaries is inferior to the other regions.
High density of dislocations and other extended defects
exist at the grain boundaries. If the cracks were located
near the gra in boundaries, various brightness distribu-
tions would exist between the cracked regions and the
far away cracked regions [8,9]. As shown in Figure 4a, c,
the bright distribution near the cracked regions and
regions far away from cracks was nearly the same. We
believe that the dislocations and grain boundaries do
not interact with the cracks. This conclusion is also con-
sistent with Figure 6b.
The stresses were det ermined by HR-XRD and
Raman, as shown in Figure 5. The lattice constant c is
calculated by [10].
d
0001
0002 0004
2
22
=
+
=
+
λ
Δ
4λ
Δsin( ) sin( )
,
(1)
where d
0001
equals to the lattice constant c; l is the
wavelength of the X-ray; θ
0002
and θ
0004
are the (0002)
and (0004) plane diffraction peaks, respectively. The
Figure 1 MOCVD-HVPE main reactor.
Liu et al. Nanoscale Research Letters 2011, 6:69
/>Page 2 of 8
Figure 2 The plots of XRD. (a) XRD rocking curves of the (0002) and (1012) planes and (b) the PHI scan curve.
Figure 3 SEM images of the GaN surface morphologies. The etching time is (a) 0min(b) 5min,and(c) 10 min. The cracks extend along
the (1010) plane. (d) This is an optical micrograph of the cracks. This image is a transmitted image (10.5 mm × 8.5 mm).
Liu et al. Nanoscale Research Letters 2011, 6:69
/>Page 3 of 8
curves were determined using θ-2θ mode. Δθ is zero
error. The strain along the c direction is expressed as
zz
cc
c
=
−
0
0
(2)
According to the r elationship between the strain and
stress [11], the stress in the plane can be expressed as
xx zz
E
=−
2
,
(3)
where c
0
is the lattice constant of stress-free GaN. At
room temperature, the free-stress lattice constant c
0
is
referenced to 0.51850 nm [12]. s
xx
and ε
zz
are the biax-
ial stress and strain in the growth plane, respectively. E
and ν are Young’s modulus and Poisson’s ratio, respec-
tively. The determined and concluded data are shown in
Table 1. These results suggest that the stress decreases
with increasing etching time. The values of the stress
and curvature in A and Af5 are nearly the same. How-
ever, the lattice constant c and the curvature rapidly
changed in Af10.
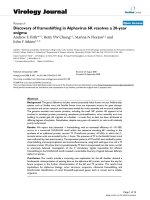
The Raman scattering is a useful tool for investigati ng
the strain of epitaxial film. The frequency of E
2
(high)
phonon is very sensitive to the in-plane strain. As illu-
strated in Figure 5a, the frequencies of E
2
high exhibit
Figure 4 The determination of the CL. (a) The cross-sectional image of SEM. (b) Panchromatic CL cross-sectional image of epitaxial l ayer
grown by MOCVD-HVPE, the white lines noted by red arrow line are cracks. (a) and (b) were taken simultaneously. (c) The panchromatic CL
image of the sample etched for 10 min.
Figure 5 The stress states of the top surface were determined by: (a) the Raman frequency of the E2 (high), (b) the diffraction peaks of
(0002) and (0004) determined by XRD in the θ-2θ mode.
Liu et al. Nanoscale Research Letters 2011, 6:69
/>Page 4 of 8
redshift with increasing etching time, which is consistent
with the variations of lattice constant c. Many articles
reported that the strain-free frequency of E
2
high mode
was 567.5, 567.6, and 568 cm
-1
[13-15]. If the frequency
is larger than the value of reference, the presence of
compressive stress will be expected; on the other hand,
the stress will be tensile. This effect had already been
observed for hydrostatic pressure, biaxial strain, and uni-
axial strain [11]. The obtained lattice constants c were
larger than the reference value, so the samples suffered
from compressive stress at room temperature. The var-
iation of the stress which was calculated along depth
was in agreement with the shift of E
2
(high) phonon fre-
quency. Furthermore, this trend was consistent with the
variation of the curvature. Sample Af10 had two notable
features: the cracks were observed in the surface; stress
rapidly dropped. We could believe that the stresses were
mainly relaxed by producing cracks.
In order to gain further insight into the nature of the
cracks, we observed the cross-sections of films after
cleaving. The cleavage plane was (1010). A typical cross-
sectional SEM image was shown in Figure 6a. The
cracks marked in black frame had a number of notable
features: the cracks were perpendicular to the film/
substrate interface; the cracks neither approached to the
surface nor extended to the substrate; and the cracks
appeared to be pinched off at several locations, and with
well-rounded ends, suggesting the cracks may heal up.
In order to gain a deep insight into the origin of the
cracks, stress distribution along depth was mea sured by
cross-sectional micro-Raman spectral. Raman spectra
were conducted in 2 μm steps along the depth. The fre-
quencies and the linewidths of the Raman mode were
shown as a function of the distance from the interface
of GaN/substrate as shown in Figure 7b. It was notice-
able that the peaks of Raman E
2
(high) phonon mode
were variable; it blueshifts at the interface of film/sub-
strate, then goes to steadiness in the following, after that
the peaks fall down and then returned to blueshift; the
linewidth of the E
2
phonon was approximately 2.6 cm
-1
near the surface and increased with decreasing distance
from the interface of film/substrate. The linewidths were
mainly affected by stress and defects. Many articles
reported that columnar structures and defects existed at
the near interface region [8,16]. It is reasonable to con-
clude that the broad er E
2
linewidth near the interface is
due to the disorder and strain associated with these
defects. With increasing thickness, the crystal quality
Table 1 The lattice constant determined by XRD
Degree Lattice constant c (nm) ε
zz
E
2
(high) (cm
-1
) Radius of curvature (m)
(0002) (0004)
A 34.6848 73.0178 0.51870 0.000386 568.735 0.98
Af5 34.6851 73.0176 0.51869 0.000366 568.711 0.98
A10f 34.6844 73.0174 0.51858 0.000154 568.504 1.02
The Raman shift at the near surface.
Figure 6 Cross-sectional SEM images and the cleavage plane is (1010). (a) The cross-sec tion was unetched, the black frame indicates the
cracks. (b) The cross-section was etched for 2 min.
Liu et al. Nanoscale Research Letters 2011, 6:69
/>Page 5 of 8
gets better. This result is in agreement with the varia-
tion of the linewidths.
The determined stress is the sum of the in trinsic and
extrinsic at room temperature. The stress is affected by
lattice mismatch, coefficient of thermal expansion mis-
match, islands coalescence, grain growth, and gas
impurity [17]. Thermal strains induced by the expansion
coefficient difference between the substrate and GaN
film dominate in the extrinsic stress. This strain is
expressed as
tfs
room
growth
d=
()
−
()
()
∫
TTT
T
T
,
(4)
where a
f
(T) and a
s
(T) are the thermal expansion coef-
ficients of the film and substrate, respectively. a
s
(T)is
larger than a
f
(T) [18]. The film/substrate system reduces
their elastic potential e nergy by bending, resulting in a
strain gradient along the depth. It is assumed that the
stress distribution in the substrate and film is a linear
function along the depth. The elastic energy in the zth
layer U(z) caused by bending is given by [19]
Uz
Mkz
h
zh
h
Mkz
h
z
h
() ,
(),
(),
=
⎧
⎨
⎪
⎩
⎪
−+ <<+
−−<<
ft
s
f
s
s
ss
0
2
0
2
22
22
(5)
where h
f
and h
s
are the thicknesses of the film and the
substrate and their values are 22 and 430 μm, respec-
tively. z is the distance from the bottom of the substrate.
M
s
and M
f
are the elastic constants of the substrate and
film, respectively. ε
0
is the strain in the central plane of
substrate. The system potential energy V
system
is
V= Uzz
-h
h
+h
system
2
2
()d
s
s
f
∫
(6)
Based on energy minimization principle, k and ε
0
can
be obtained by ∂V/∂ε
0
= 0 and ∂V/∂k = 0, We defined r
as the weighted ratio of elastic constant of the film and
the substrate.
r
Mh
Mh
=
ff
ss
and
k
er
h
h
h
rr
h
h
r
h
h
r
h
h
=+
⎛
⎝
⎜
⎞
⎠
⎟
++ +
⎛
⎝
⎜
⎞
⎠
⎟
+
⎛
⎝
⎜
⎞
⎠
⎟
6
11464
2
2
t
s
f
s
f
s
f
s
f
s
22
1
⎡
⎣
⎢
⎢
⎤
⎦
⎥
⎥
−
,
(7)
0
22
2
11464=− +
⎛
⎝
⎜
⎞
⎠
⎟
⎛
⎝
⎜
⎜
⎞
⎠
⎟
⎟
++ +
⎛
⎝
⎜
⎞
⎠
⎟
+
t
f
s
f
s
f
s
rr
h
h
rr
h
h
r
h
h
r
h
ff
s
h
⎛
⎝
⎜
⎞
⎠
⎟
⎡
⎣
⎢
⎢
⎤
⎦
⎥
⎥
−
2
1
,
(8)
where M
f
and M
s
are the elastic constants and can be
calculated by
MC C
C
C
xx xy
xz
zz
=+−
2
2
,
(9)
where C
ij
are the stiffness constants (as shown in
Table 2) and the x, y,andz axes are chosen along the
GaN 1120, 1100, and 0001 directions, respectively. Since
these directions are parallel to the crystal principal axis,
the shear stress components (i ≠ j) are zero. The values
Figure 7 The determination of Raman. (a) Micro-Raman spectra of the cross-section are obtained by scanning from the bottom of the
interface to the surface. (b)The phonon frequencies of the E2 (high) and FWHM vary with depth.
Liu et al. Nanoscale Research Letters 2011, 6:69
/>Page 6 of 8
of M
f
and M
s
are 455 and 603 GPa, respectively. We cal-
culated that the radius of curvature was 0.123 m and ε
0
was 6.4 × 10
-4
, assuming the film and the substrate were
not in the plastically deforming area in the cooling pro-
cess. As illustrated in Figure 8b, the largest tensile strain
is 0.0025 located at substrate side near the interface and
whole GaN film suffers from the compressive stress. If
cracking happened in the cooling process, it would be
difficult to explain why the cracks did not appear in the
substrate but in the film. It is reasonable to believe that
the cracks are generated in the growth process.
The cracks nucleation and extension are the conse-
quences of both the existence of tensile stress and
exceeding the critical thickness durin g the growth pro-
cess. We should explain the origin of the tensile stress.
Many authors observed intrinsic tensile stress using in
situ measurements of wafer bending curvature [20-22].
They found that the compressive stress appeared first,
and then the compressive stress switched to steady ten-
sile stress. This tensile stress was attributed t o islands
coalescence. This phenomenon was in dependent of the
substrate. Hoffman [23] proposed that adjacent islands
with vertical surface grew closer to one another and
then elastically snapped together when the gap between
the islands reached some critical size. The decrease of
the solid-vapor interfacial energy balances the increase
of the stress-related m echanical energy and grain
boundary-related surface energy. Cracks will o ccur once
the stressed films reach the critical thickness. O nce the
cracks have been introduced, an opening channel would
be left. However, it is difficult to explain that the cracks
do not extend to the surface and many cracks are buried
in the consequence growth. Etzkom and Clarke [4] pro-
posed several possibilities for the cracks that get closed
up and buried: film lateral growth at the crack opening;
concurrent diffusion transport by surface diffusion, dri-
ven by capillarity; and cracks face touch in cooling pro-
cess. However, only at high temperature the atom have
high diffusing rate. In our system, the temperature drop-
ping from 1050 to 600°C only needs 3 min. Some
authors had calculated the Ga atom surface diffuse
length and the value was less than 13 nm min
-1
at 1050°
C [24]. A large number of Ga and N atoms concurrent
diffusion along the cracks surface are very difficult. If
the healed part originates from the face touch in cool-
ing, the crystal quality would be inferior to the
uncracked part. In order to compare crystal quality of
the cracks edge with that of healed part, the cross was
etched for 2 min at 200°C in mixed solution of H
2
SO
4
:
H
3
PO
3
(3:1). Only crack edges were etched faster than
those of the healed part, as shown in the Figure 6b. It
would be concluded that the lateral growth predomi-
nates in the healing process. The tensile stress was
mainly relaxed by the cracks, but residual tensile stress
also was present in the uncracked region [25]. The
cracking will be reproduced in the uncracked region.
When the temperature dropped from the growth tem-
perature to the room temperature, the thermal stress
Figure 8 The schematic diagram of: (a) the bending in the Ga N/Al
2
O
3
, induced by the difference in the t hermal expansion coefficients. (b)
The strain distribution with the depth by calculation.
Table 2 The value of elastic stiffness tensor elements C
ij
C
xx
(Gpa) C
xy
(Gpa) C
xz
(Gpa) C
zz
(Gpa) References
GaN 374 106 70 379 [26]
Al
2
O
3
409.2 165.4 113.0 490.2 [27]
Liu et al. Nanoscale Research Letters 2011, 6:69
/>Page 7 of 8
mostly exerted in the healed apartment and uncracked
region. These explanati ons are consistent with the result
of Raman spectra in Figure 7b and surface stress analy-
sis in Table 1. The variatio n of phonon frequency
appeared as S-shape d distribution along dep th; the
cracks did not extend to the surface or approach the
substrate; the crystal quality of healed part is compar-
able with the uncracked part.
Conclusion
The origin of cracks in GaN film grown by MOCVD-
HVPE system has been an alyzed by SEM, HR-XRD,
Raman, and CL. The stress distribution was obtained by
cross-sectional Raman spectra. According to the stress
distribution and the cracks distribution, it would be
expected that the cracks originate from the growth pro-
cess. When the films reach the critical thickness, cracks
will be generated. Then the cracks will be healed in the
consequent growth by lateral growth. So the cracks do
not extend to either the substrate or the film surface.
Abbreviations
CL: cathodoluminescence; Ga: gallium; HCl: hydrogen chloride; HVPE: hydride
vapor-phase epitaxy; MOCVD: metal organic vapor-phase epitaxy; NH
3
:
ammonia; SEM: scanning electron microscopy; SLM: standard liters per
minute; sccm: standard cubic centimeters per minute; TEC: thermal
expansion coefficient; TMGa: trimethylgallium; XRD: X-ray diffraction.
Acknowledgements
This work was supported by National Science Foundation of China (Nos.
60776015, 60976008), the Special Funds for Major State Basic Research
Project (973 program) of China (No. 2006 CB604907), and the 863 High
Technology R&D Program of China (Nos. 2007AA03Z402, 2007AA03Z451).
Author details
1
Key Laboratory of Semiconductor Materials Science, Institute of
Semiconductors, Chinese Academy of Sciences, P. O. Box 912, Beijing
100083, People’s Republic of China
2
Beijing Synchrotron Radiation Facility,
Institute of High Energy Physics, Chinese Academy of Sciences, P. O. Box
918, Beijing 100039, People’s Republic of China
Authors’ contributions
JL carried out the experiments and measured the material, drafted the
manuscript. XL, SY, QZ and ZW directed the experiments and the drafting of
the paper. CL and YG participated the growth of material. ZL and XX carried
out the measurement of Raman. TY and HW carried out the measurement
of XRD. AY and HS carried out the etching. HW and CJ carried out the
measurement of CL.
Competing interests
The authors declare that they have no competing interests.
Received: 23 June 2010 Accepted: 12 January 2011
Published: 12 January 2011
References
1. Jain RB, Fareed RSQ, Zhang J, Gaska R, Kuokstis E, Yang J, Maruska HP,
Khan MA, Mickevicius J, Tamulaitis G, Shur MS: Growth of high resistance
thick GaN templates by HVPE. Phys Stat Sol (c) 2005, 7:2091.
2. Itoh N, Rhee JC, Kawabata T, Koike S: Study of cracking mechanism in
GaN/α-Al
2
O
3
. J Appl Phys 1985, 58:1828.
3. Leszczynski M, Teisseyre H, Suski T, Grzegory I, Bockowski M, Jun J, Palosz B,
Porowski S, Pakula K, Baranowski JM, Barski A: Acta Phys Pol A 1996, 90:887.
4. Etzkorn EV, Clarke DR: Cracking of GaN films. J Appl Phys 2001, 89:1025.
5. Liu JQ, Wang JF, Qiu YX, Guo X, Huang K, Zhang YM, Hu XJ, Xu Y, Xu K,
Huang XH, Yang H: Determination of the tilt and twist angles of curved
GaN layers by high-resolution x-ray diffraction. Semicond Sci Technol 2009,
24:125007.
6. Tavernier PR, Etzkorn EV, Wang Y, Clarke DR: Two-step growth of high-
quality GaN by hydride vapor-phase epitaxy. Appl Phys Lett 2000, 77:1804.
7. Dam CEC, Grzegoczyk AP, Hagenman PR, Larsen PK: Method for HVPE
growth of thick crack-free GaN layers. J Cryst Growth 2006, 290:473.
8. Hwa-Mok Kim, Jun-Sung Choi, Jae-Eung OH, Tae-Kyung Yoo:
Cathodoluminescence Characterization of GaN Thick Films Grown by
Using the HVPE Method. J Korean Phys Soc 2000, 37:956.
9. Lu H, Cao XA, LeBoeuf SF, Hong HC, Kaminsky EB, Arthur SD:
Cathodoluminescence mapping and selective etching of defects in bulk
GaN. J Cryst Growth 2006, 291:82.
10. Zheng XH, Wang YT, Feng ZH, Yang H, Chen H, Zhou JM, Liang JW:
Method for measurement of lattice parameter of cubic GaNlayers on
GaAs (0 0 1). J Cryst Growth 2003, 250:345.
11. Wagner JM, Bechstedt F: Properties of strained wurtzite GaN and AlN: Ab
initio studies. Phys Rev B 2002, 66:115202.
12. Detchprohm T, Hiramstsu K, Itoh K, Akasaki I: Relaxtion Process of the
thermal Strain in the GaN/α-Al
2
O
3
Heterostructure and Determination of
the Insrinsic Lattice Constants of GaN Free from the strain. Jpn J Appl
Phys 1992, 31:L.1454.
13. Tripathy S, Chua S, Chen P, Miao Z: Micro-Raman investigation of strain in
GaN and Al
x
Ga
1-x
N/GaN heterostructures grown on Si (111). J Appl Phys
2002, 92:3503.
14. Davydov VYu, Kitaev YuE, Goncharuk IN, Smirnov AN, Graul J: Semchinova
O, Uffmann D, Smirnov MB, Mirgorodsky AP, Evarestov RA. Phonon
dispersion and Raman scattering in hexagonal GaN and AlN. Phys Rev B
1998, 58:91289.
15. Perlin P, Jauberthie-Carillon C, Itie JP, San Miguel A, Grzegory I, Polian A:
Raman scattering and x-ray-absorption spectroscopy in gallium nitride
under high pressure. Phys Rev B 1992, 45:83.
16. Paskova T, Goldys EM, Monemar B: Hydride vapour-phase epitaxy growth
and cathodoluminescence characterization of thick GaN films. J Cryst
Growth 1999, 203:1.
17. Koch R: The intrinsic stress of polycrystalline and epitaxial thin metal
films. J Phys Condens Matter 1994, 6:9519.
18. Gil B: Group III Nitride Semiconductor Compounds-Physics and Application
Oxford: Oxford University Press; 1998.
19. Freund LB, Suresh S: Thin film material: stress, defect formation, and evolution
Cambridge: Cambridge University Press; 2003.
20. Raghavan S, Redwing JM: Growth stresses and cracking in GaN films on (111)
Si grownby metal-organic chemical-vapor deposition. I. AlN buffer layers.
J Appl Phys 2005, 98:023514, Raghavan S, Redwing JM: J Appl Phys 2004, 96: 2995.
21. Raghavan S, Acord J, Redwing JM: Intrinsic stresses in AlN layers grown
by metal organic chemical vapor deposition on (0001) sapphire and
(111) Si substrates. Appl Phys Lett 2005, 86:261907.
22. Raghavan S, Acord J, Redwing JM: In situ observation of coalescence-
related tensile stresses during metalorganic chemical vapor deposition
of GaN on sapphire. Appl Phys Lett 2005, 86:261907.
23. Hoffman RW: In situ observation of coalescence-related tensile stresses
during metalorganic chemical vapor deposition of GaN on sapphire.
Thin Solid Films 1976, 34:185.
24. Morkoc H: In Handbook of Nitride Semiconductors and Devices: Materials
Properties, Physics and Growth. Volume 1. Weinheim: Wiley-VCH Verlag
GmbH & Co. KGaA; 2008:464.
25. Hiramatsu K, Detchprohm T, Akasaki I: Relaxation Mechanism of Thermal
Stresses in the Heterostructure of GaN Growth on Sapphire by Hapor
Phase Epitaxy. Jpn J Appl Phys 1993, 32:1528.
26. Polian A, Grimsditch M, Grzegory I: Elastic constants of gallium nitride.
J Appl Phys 1996, 79:3343.
27. Simmons G, Wang H: Single Crystal Elastic Constants and Calculated
Aggregate Properties: A Handbook. Cambridge, MA: Massachusetts
Institute of Technology Press, 2 1970.
doi:10.1186/1556-276X-6-69
Cite this article as: Liu et al.: Investigation of cracks in GaN films grown
by combined hydride and metal organic vapor-phase epitaxial method.
Nanoscale Research Letters 2011 6:69.
Liu et al. Nanoscale Research Letters 2011, 6:69
/>Page 8 of 8