Báo cáo hóa học: " A novel mechanical cleavage method for synthesizing few-layer graphenes" ppt
Bạn đang xem bản rút gọn của tài liệu. Xem và tải ngay bản đầy đủ của tài liệu tại đây (3.34 MB, 7 trang )
NANO EXPRESS Open Access
A novel mechanical cleavage method for
synthesizing few-layer graphenes
Buddhika Jayasena, Sathyan Subbiah
*
Abstract
A novel method to synthesize few layer graphene from bulk graphite by mechanical cleavage is presented here.
The method involves the use of an ultrasharp single crystal diamond wedge to cleave a highly ordered pyrolytic
graphite sample to generate the graphene layers. Cleaving is aided by the use of ultrasonic oscillations along the
wedge. Characterization of the obtained layers shows that the process is able to synthesize graphene layers with
an area of a few micrometers. Application of oscillation enhan ces the quality of the layers produced with the layers
having a reduced crystallite size as determined from the Raman spectrum. Interesting edge structures are observed
that needs further investigation.
Introduction
There is an urgent need to develop a large-scale method
to manufacture graphene reliably f or various promising
applications being developed [1]. These applications rely
largely on the unique properties of graphene [2,3] and
the properties are strongly affected by the method of
synthesis [4]. While several laboratory methods to
synthesize graphene have been developed and reported,
the suitability of these methods to large-scale manufac-
turing remains to be proven. These methods can be
broadly classified as epitaxial growth, colloidal suspen-
sion, unconventional methods, and exfoliation. In the
epitaxial growth method graphene can be grown on top
of either metallic or insulator substrates using physical
and chemical vapour deposition methods [2,4,5]. In the
colloidal suspension method, a combination of aqueous
or organic solvent with an initial raw material such as
graphite oxide is used [2]. There are also several unc on-
ventional methods such as unzipping carbon nanotubes
(CNT), arc discharge, and detonation using chemicals
that have been explored for graphene manufacturing.
The unzipping of CNT can be categori zed as an oxidiz -
ing method involving insertion of metal atoms with
ammonia us ing thermal treatment, p lasma cutting after
embedding in polymer, and catalytic microwave cutting
[6]. The arc discharge method involves the use of a
high-current arc discharge between a graphite anode
and graphite cathode in a chamber filled with hydrogen
and helium gas [7]. In the detonation method, a mixture
of natural graphite, nitric acid, and CH
3
NO
2
is exploded
in a vessel and graphene detected in the soot obtained
[8]. All these methods suffer from various limitations
such as poor yield, use of special hazardous chemicals,
and contaminati on of graphene with impurities or func-
tional groups, and l ong processing time. The exfoliation
method, the method of interest in this paper, essentially
involves separation of graphene layers from bulk gra-
phite; this technique can be further classified into t her-
mal, chemical, or mechanical methods.
In thermal exfoliat ion, graphite (natural or graphite
oxide) is used as the starting material and the process
comprises of three steps: oxidization, thermal expan-
sion/exfoliation and centri fugation, and ultra sonicati on
[9]. Chemical exfoliation is carried out at high temper a-
tures and involves several process steps and chemicals
[10]. The devices can be fabricated on several surfaces,
and deposition of graphene from solution is the main
merit of this method. Mechanical exfoliation, the main
focus of this paper, is another laboratory-based method
for graphene sample preparation. The scotch tape
method is the popular method of mechanical cleavage
[11] that has been explored for separation of graphene.
Repeated peeling is needed to achieve single layer gra-
phene and it is difficult to predict the number of peel-
ings required. Another micromechanical cleaving
method reported by Ruoff et al [12] involves the use of
an atomic force microscope (AFM) tip along with an
* Correspondence:
School of Mechanical and Aerospace Engineering, Nanyang Technological
University, 50 Nanyang Avenue, 639798 Singapore
Jayasena and Subbiah Nanoscale Research Letters 2011, 6:95
/>© 2011 J ayasena and Subbiah; licensee Springer. This is an Open Access article distributed under the terms of the Creative Commons
Attribution License ( which permits unres tricted use , distribution, and reproduction in
any medium, provided the original work is properly cited.
array of highly ordered pyrolytic graphite (HOPG) mesas
made from oxygen-plasma etching method. The HOPG
islands were transferred to a SiO
2
/Si substrate using
hydrofluoric acid. It is then manipulated using an AFM
tip to obtain multiple layers o f HOPG. A variation of
this method involves gluing a block of prepared graphite
to an AFM tip and scratched on Si substrates [13]. In
general, it is difficult to control the separation and num-
ber of graphene layers generated using these mechanical
methods. In this context, there i s further scope in
exploring o ther mechanical exfoliation techniques for
graphene synthesis with potential for low chemical
usage and better process controllability. Application
areas where ultrathin sectioning is routinely performed
offer some ideas for mechanical exfoliation of layers
from a bulk substrate.
Use of an ultrasharp wedge as a sectioning method
has been used in biological sample preparation and
ultrathin samples (as thin as 40 nm) are generated with
either glass or diamond wedges [14]. Mica, a layered
material, was cleaved using a glass wedge proving the
possibility o f layer separation as early a s in 1930 [15].
Brittle and hard materials such as germanium have also
been sectioned to nanometer-scale thickness using this
technique [16]. Reproducibility of section thickness, che-
mical inertness, and durability of the diamond wedge
are the main advantages of this technique . Thus, there
is potential in exploring the use of this technique in gra-
phene synthesis as well.
Here, we adopt this sectioning technique to develop a
novel mechan ical exfoliation method to synthesize few
layer graphene from bulk graphite. The method uses an
ultrasharp single crystal diamond wedge to exfoliate a
highly ordered pyrolytic graphite sample and generate
the graphene layers. We test the effect of high-frequency
oscillations applied along the wedge, which will enable a
smooth sliding motion of the cleaved layers over the
diamond wedge surface leading to better q uality layers.
The thickness of the layers obtained is analyzed using
AFM and transmission electron microscopy (TEM) to
study the layer structure and the edges in detail. The
effect of applied oscillations is studied by calculating the
crystallite size from Raman spectroscopic analysis.
Experimental setup and characterization methods
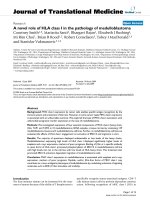
HOPG, SPI grade ZYH, with dimensions of 2 × 12 ×
12 mm, is used as the starting substrate m aterial. The
HOPG is first cut into small pieces of size 1 × 1 ×
2 mm using a sharp blade a nd then embedded into an
epofix embedding medium. It is then trimmed as shown
in Figure 1a into a pyramid shape u sing a trimming
machine so as to make it r eady for cleaving. The ultra-
sharp wedge used for sectioning is made of a single
crystal diamond with sharpness less than 20 Å and has
an included angle of 35°. The diamond wedge is
mounted on an ultrasonic oscillation system capable of
providing tunable frequencies in the 10-kHz range
(25-45 kHz) with an amplitude of vibration of a few
tens of nanometers (set as a voltage value in the range
0-30 V). The diamond wedge mounted on the oscilla-
tion system is aligned carefully with respect to the
HOPG mount (Figure 1b). The HOPG and the diamond
wedge system are mounted on two different high-
precision slide systems on a Leica Ultracut system
(Figure 1c). The ultrasharp wedge is held fixed while the
work material is fed slowly downwards at a controlled
speed (0.6 mm/s) towards the wedge. The overlap
between the diamond wedge and the HOPG surface is
set to 40 nm. A tool setting angle of 6°, frequency of
vibration of 0 kHz (no oscillation) and 33.1 kHz, and vol-
tage of 2.1 V are used as process parameters. The cleaved
layers slide off the diamond wedge surface, are floated on
to a water bath arrangement, collected onto a loop and
then transferred to a copper grid (diamet er, 3.05 mm;
400 meshes; mesh opening size, 37 × 37 μm) for AFM
(Digital Instrument with Nanoscope software) and TEM
(JEM 2010 with DigitaMicrograph software) observations
and also to a Si/SiO
2
substrate for optical and scanning
electron microscopic (SEM) observation. Characteriza-
tions are performed on six samples prepared using iden-
tical process parameters with a R enishaw Raman
microscope (633-nm wavelength).
Results and Discussion
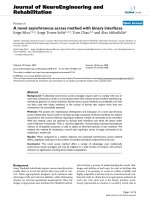
Under perfect cleaving conditions, we can expect the
layer size to be comparable to the dimensions of the
face of the pyramid (1 × 0.5 mm). We were able to
observe layers with approximate dimensions of 900 ×
300-μm area a nd with thic kness range of a few tens of
nanometers. The observed layers are shown in Figure 2.
The layer dimensions were seen to be approximately
900 × 300-μm area.
During every experimental run, it involved a series of
20 cleaving passes. During every pass, a layer is gener-
ated. As t he wedge retracts and is ready for the next
pass, the layer just generated remains adhered to the
wedge surface. The subsequent cut generates another
layer which pushes the previous lay er further onto the
wedge and subsequently on to the water bath. When
the new layer goes underneath the previous layer or
when the layer reaches the w ater surface, then in some
cases curling of the layers was observed. More often
than not a series of layers were observed floating on the
water bath. The process is yet to be o ptimized and the
current success rate in cleaving to obtain layers of 900 ×
300-μm area is more than 50%.
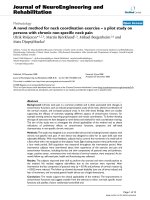
Atomic force microscope operated in the tapping
mode is used to determine the thickness of the layers
Jayasena and Subbiah Nanoscale Research Letters 2011, 6:95
/>Page 2 of 7
obtained. The sectional analysis (Figure 3) of this data
shows that the layer thickness is almost equal to few
tens of nanometers. It is also seen that the edges of the
layers are composed of uneven thickness as shown in
Figure 3a. Figure 3b represents the plan view and Figure
3c shows the topography of a measured area.
Observations using TEM of the few layer graphenes
obtained with and without oscillations are shown in
Figure 4 and 5 respectively. In the micrographs, of layers
without application of oscillations, the folded graphene
sheet is clearly visible (marked as 1). In addition, several
grain boundaries (marked as 2) are also observed. No
other notable edge structures are seen.
Figure 4a shows an area where the sheet appears to be
heavily crumpled. In the micrographs o f layers o btained
with application of oscillations, grain boundaries, folded
graphene sheets, and smooth areas of the sheets are also
clearly observed. No heavily crumpled regions were
seen, but some structures that seem to resemble nano-
horns can be observed (marked as 3 in the enlarged
area), whi ch needs further investigation. Nanohorns are
considered as structures resulting from crushing of a
single sheet of graphene [17]. The large surface area of
the nano horns is reported to be useful in vari ous appl i-
cations such as hydrogen gas storage.
Raman spectroscopy data of the cleaved layers, pro-
duced with and without oscillation indicates several fea-
tures such as the D band (information about defects), G
band (in plane vibration) and 2D band (stacking order);
these correlated well with reported data in the literature
[3,18]. There are no differences in the D band positions
(1,332 cm
-1
) with and without oscillations. However,
1 mm
0.5 mm
HOPG
EPOFIX
HOPG
embedded
in epoxy
and
trimmed
Ultrasharp wedge
alignment
(a) (b) (c)
Figure 1 HOPG, SPI grade ZYH. (a) HOPG mounted in epofix and trimmed to pyramid shape. (b) Setup showing wedge alignment with HOPG
layers. (c) Actual experimental setup.
Figure 2 Images of cleaved layers. (a) SEM image, (b) optical microscope image (scale 50 μm).
Jayasena and Subbiah Nanoscale Research Letters 2011, 6:95
/>Page 3 of 7
this D band position observed is different from that of
bulk graphite (1,355 cm
-1
). The G band position was
1,577 cm
-1
with oscillatio n and 1,578 cm
-1
without.
The Raman data is further analyzed using a curve fit-
ting method involving deconvolution and fitting two
Lorentzian functions, HOPG being a polycrystalline
material [19].
Figure 6 shows the fitted curves obtained, from wh ich
the ratio of D and G band peak intensities ( I
D
/I
G
) can
be obtained. There are two different ways to calculate
this I
D
/I
G
ratio. One method is to obtain it directly from
the peak height [19-22] and the other way is to use the
integrated area of the fitted curves [23-25]. Here, both
methods are used to analyze the Raman data. The I
D
/I
G
ratio obtained using both peak height and integrated
intensitymethodsareplottedinFigure7aforthesix
samples. A statistical two-sample t test conducted on
the samples showed that the I
D
/I
G
ratios for the layers
obtained with and without oscillation, calculated using
the direct peak height method, were statistically differ-
ent (p value = 0.031 at 95% conf idence); thus oscillation
hassomedistincteffectonthe process and the layers
obtained.
The I
D
/I
G
ratios can also be used to calculate the
crystallite size. The average crystallite size (La) and exci-
tation laser energy both are correlated with the I
D
/I
G
ratio. There are different equations reported in the lit-
erature to estimate La. The original equation deter-
mined by Tuinstra and Koenig [26] is said to be not
appropriate for all graphite forms. Hence, a general for-
mulaforLainvolvinganyexcitationenergy,E
l
,was
proposed by Canado et al. [23] as shown in Equation 1
is adopted here.
La =× ×
−
560
14
(/) ()II E
DG l
(1)
The values of La calculated using this equation and
experimentally ob tained values of I
D
/I
G
are plotted as
shown in Figure 7. It appears that La is smaller when
ultrasonic oscillation is applied to the wedge. The value
of La is inversely proportional to “amount of crystal
boundary” and is a measure of dislocations, vacancies, as
well as number of non-graphitic atoms, which in turn is
proportional to chemical functionality and shear
strength of linkages [22]. The amount of disorder is an
indication of fr action sp
2
bond and it is a measure of
Figure 3 AFM image. (a) Sectional analysis of edge, (b) plan view of edge, (c) 3-D topography, (d) position of AFM tip.
Jayasena and Subbiah Nanoscale Research Letters 2011, 6:95
/>Page 4 of 7
Figure 4 TEM images. TEM images without ultrasonic oscillation (a) large FLG edges, (b) and (d) folded FLG, (c) large graphene sheet with
rolled edge.
Figure 5 TEM images. TEM images with ultrasonic oscillation (a) FLG, (b) Edge of graphene sheet, (c) and (d) folded FLG.
Jayasena and Subbiah Nanoscale Research Letters 2011, 6:95
/>Page 5 of 7
electri cal, mechanical, and optical properties. The lower
value of La when oscillations are applied indicates the
improved the quality of the layers obtained. Also, higher
the value of La, lower is said to be the shear strength
and from Figure 7 we can conclude that shear strength
tends to increase when ultrasonic oscillation used.
Conclusion and future work
We have demonstrated a novel mechanical cleavage
techni que to produce few layer graphene from bulk gra-
phite using an ultrasharp diamond wedge assisted by
ultrasonic oscillations. AFM measurements indicate that
the proposed mechanical cleaving method is capable o f
Figure 6 Lorenztian curve fitting of Raman spectroscopy data (GRAMS wire software).
(
a
)
(
b
)
Figure 7 The values of La calculated using experimentally obtained values of I
D
/I
G
. (a) I
D
/I
G
ratio obtained by both direct peak height
measurement and using integrated area method. (b) The La values calculated using both these methods is plotted.
Jayasena and Subbiah Nanoscale Research Letters 2011, 6:95
/>Page 6 of 7
producing thin layer graphene with a thickness of tens
of nanometers . TEM studies reveal that there is consid -
erable amount of attention required to understand the
edge formation with ultrasonic oscillation usage since
structures that seem to resemble nanohorns w ere
observed. Application of ultrasonic vibrations along the
tool edge is seen to significantly reduce the I
D
/I
G
ratios
seen in a Raman spectrum. Hence, the applied oscilla-
tions may have potential to reduce the defects in cleaved
layers. The application of ultrasonic vibration also
reduces the crystallite size. In the future we will perform
molecular d ynamic simulations to understand the clea-
vage mechanism and the effect of process parameters on
the cleavage.
Acknowledgements
Partial funding from NTU-MoE AcRF/Tier-1 RG11/07 grant is acknowledged.
We thank Dr. G. A. J. Amaratunga (University of Cambridge) for the
discussion on this topic and useful suggestions, during his visit to Nanyang
Technological University (NTU). We also thank Dr. V. M. Murukeshan (NTU)
for his valuable suggestions on formatting this paper.
Authors’ contributions
BJ designed and conducted all experiments and characterisation and helped
in drafting the manuscript. SS conceived of the study, participated in the
experimental setup design, and drafted the manuscript. Both BJ and SS have
read and approved the final manuscript.
Competing interests
The authors declare that they have no competing interests.
Received: 26 August 2010 Accepted: 19 January 2011
Published: 19 January 2011
References
1. Stankovich S, Dikin DA, Dommett GHB, Kohlhaas KM, Zimney EJ, Stach EA,
Piner RD, Nguyen ST, Ruoff RS: Graphene-based composite materials.
Nature 2006, 442(7100):282-286.
2. Park S, Ruoff RS: Chemical methods for the production of graphenes. Nat
Nanotechnol 2009, 4:217-224.
3. Zhenhua Ni YW, Ting Yu, Zexiang Shen: Raman spectroscopy and imaging
of graphene. Nano Res 2008, 1(4):273-291.
4. Allen MJ, Tung VC, Kaner RB: Honeycomb Carbon: A Review of Graphene.
Chem Rev 2009, 110(1):132-145.
5. Lee BJ, Yu HY, Jeong GH: Controlled Synthesis of Monolayer Graphene
Toward Transparent Flexible Conductive Film Application. Nanoscale Res
Lett 2010, 1-6.
6. Janowska I, Ersen O, Jacob T, Vennégues P, Bégin D, Ledoux MJ, Pham-
Huu C: Catalytic unzipping of carbon nanotubes to few-layer graphene
sheets under microwaves irradiation. Appl Catal, A 2009, 371(1-2):22-30.
7. Subrahmanyam KS, Panchakarla LS, Govindaraj A, Rao CNR: Simple Method
of Preparing Graphene Flakes by an Arc-Discharge Method. J Phys Chem
C 2009, 113(11):4257-4259.
8. Sun G, Li X, Qu Y, Wang X, Yan H, Zhang Y: Preparation and
characterization of graphite nanosheets from detonation technique.
MATER LETT 2008, 62(4-5):703-706.
9. Jin M, Jeong HK: Synthesis and systematic characterization of
functionalized graphene sheets generated by thermal exfoliation at low
temperature. J Phys D, Appl Phys (UK) 2010, 43(27):275402.
10. PU NW, Sung YU, Yih-Ming LIU, Ming-Der GER: Production of few-layer
graphene by supercritical CO
2
exfoliation of graphite. 2009, 63(23):3.
11. Novoselov KS, Geim AK, Morozov SV, Jiang D, Zhang Y, Dubonos SV,
Grigorieva IV, Firsov AA: Electric Field Effect in Atomically Thin Carbon
Films. Science 2004, 306(5696):666-669.
12. Lu X, Yu M, Huang H, Ruoff RS: Tailoring graphite with the goal of
achieving single sheets. Anglais 1999, 10:269-272.
13. Zhang YB, Small JP, Pontius WV, Kim P: Fabrication and electric-field-
dependent transport measurements of mesoscopic graphite devices.
Appl Phys Lett 2005, 86(7).
14. Al-Amoudi A, Dubochet J, Gnaegi H, Lüthi W, Studer D: An oscillating
cryo-knife reduces cutting-induced deformation of vitreous ultrathin
sections. J Microsc (UK) 2003, 212(1):26-33.
15. Obreimoff JW: The Splitting Strength of Mica. P ROY SOC LOND A MAT
1930, 127(805):290-297.
16. Fernandezmoran H: A diamond knife for ultrathin sectioning. Exp Cell Res
1953, 5(1):255-256.
17. Wang H, Chhowalla M, Sano N, JIA S, Amaratunga JGA: Large-scale
synthesis of single-walled carbon nanohorns by submerged arc. Anglais
2004, 15(5):5.
18. Wang Yy, Ni Zh, Yu T, Shen ZX, Wang Hm, Wu Yh, Chen W, Shen Wee AT:
Raman Studies of Monolayer Graphene: The Substrate Effect. J Phys
Chem C 2008, 112(29):10637-10640.
19. Jawhari T, Roid A, Casado J: Raman spectroscopic characterization of
some commercially available carbon black materials. Carbon 1995,
33(11):1561-1565.
20. Tuinstra F, Koenig JL: Raman Spectrum of Graphite. J CHEM PHYS 1970,
53(3):1126-1130.
21. Ferrari AC, Robertson J: Interpretation of Raman spectra of disordered
and amorphous carbon. PHYS REV B 2000, 61(20):14095.
22. Tuinstra F, Koenig JL: Characterization of Graphite Fiber Surfaces with
Raman Spectroscopy. J COMPOS MATER 1970, 4(4):492-499.
23. Cancado LG, Takai K, Enoki T, Endo M, Kim YA, Mizusaki H, Jorio A,
Coelho LN, Magalhaes-Paniago R, Pimenta MA: General equation for the
determination of the crystallite size La of nanographite by Raman
spectroscopy. Appl Phys Lett 2006, 88(16):163106-163103.
24. Nistor LC, Landuyt J, Ralchenko VG, Kononenko TV, Obraztsova ED,
Strelnitsky VE: Direct observation of laser-induced crystallization of a-C:H
films. APPL PHYS A-MATER 1994, 58(2)
:137-144.
25. Beyssac O, Goff B, Chopin C, Rouzaud JN: Raman spectra of carbonaceous
material in metasediments: a new geothermometer. Journal of
Metamorphic Geology 2002, 20:859-871.
26. Nikiel L, Jagodzinski PW: Raman spectroscopic characterization of
graphites: A re-evaluation of spectra/structure correlation. Carbon 1993,
31(8):1313-1317.
doi:10.1186/1556-276X-6-95
Cite this article as: Jayasena and Subbiah: A novel mechanical cleavage
method for synthesizing few-layer graphenes. Nanoscale Research Letters
2011 6:95.
Submit your manuscript to a
journal and benefi t from:
7 Convenient online submission
7 Rigorous peer review
7 Immediate publication on acceptance
7 Open access: articles freely available online
7 High visibility within the fi eld
7 Retaining the copyright to your article
Submit your next manuscript at 7 springeropen.com
Jayasena and Subbiah Nanoscale Research Letters 2011, 6:95
/>Page 7 of 7