Báo cáo hóa học: " Polycrystallization effects on the nanoscale electrical properties of high-k dielectrics" doc
Bạn đang xem bản rút gọn của tài liệu. Xem và tải ngay bản đầy đủ của tài liệu tại đây (644.38 KB, 9 trang )
NANO EXPRESS Open Access
Polycrystallization effects on the nanoscale
electrical properties of high-k dielectrics
Mario Lanza
*
, Vanessa Iglesias, Marc Porti, Montse Nafria, Xavier Aymerich
Abstract
In this study, atomic force microscopy-related techniques have been used to investigate, at the nanoscale, how the
polycrystallization of an Al
2
O
3
-based gate stack, after a thermal annealing process, affects the variability of its
electrical properties. The impact of an electrical stress on the electrical conduction and the charge trapping of
amorphous and polycrystalline Al
2
O
3
layers have been also analyzed.
Introduction
To reduce the excess o f gate l eakage currents i n metal-
oxide-semiconductor (MOS) devices, the ultra thin SiO
2
gate oxide is replaced by other high-k dielectric materi-
als [1]. However, high-k-based devices still show some
drawbacks, and therefore to have a better knowledge of
their properties and to improve their performance, a
detailed electrical characterization is required. Many
researches have bee n devoted to the study of the electri-
cal characteristics of high-k gate dielectrics, mainly
using standard wafer level characterization techniques
on fully processed MOS capacitors or transistors [1-4].
However, since the lateral dimensions of complementary
MOS devices are shrinking to a few tens of nanometer s
or below, for a detailed and profound characterization,
advanced methods with a large lateral resolution are
required. In this direction,conductiveatomicforce
microscope (CAFM), as demonstrated for SiO
2
and
other insulators [5-14] , is a very promising tool which
allows for a nanometer-resolved characterization of the
electrical and topographical properties of the gate oxide.
Characterization at the nanoscale allows us to study
which factors determine the electrical properties of the
dielectric stack, and details on how they affect them. For
example, some manufacturing processes (such as high-
temperature annealing) can alter their electrical proper-
ties because of the polycrystal lization of the high-k
dielectric, which can affect its electrica l homogeneity
[15]. Recently, the CAFM has been started to be used to
evaluate the electrical conduction of polycrystalline
high -k dielectrics. While in some polycrystalline materi-
als the electrical conduction seems to be mai nly related
to the bulk of grains [16], in other s, current can flow
preferentially through grain boundaries (GBs) [17-20].
Since this topic can be crucial for the successful inclu-
sion of high-k dielectrics in electron d evices, in this
study, AFM-related techniques have been used to inves-
tigate, at the nanoscale, the effect of the high-k material
polycrystallization (derived from an annealing process)
on the conducti vity and charge trapping of Al
2
O
3
-based
stacks for Flash memories.
Experimental
Gate stacks, which consist of a nominal 10-nm-thick
Al
2
O
3
layer and a 1-nm-thick SiO
2
interface layer on
top of a p-type Silicon substrate, have been analyzed.
After the Al
2
O
3
deposition, some of t he samples were
annealed by rapid thermal process (RTP) in nitrogen at
750 or at 950°C. The electrical properties of the stack
were measured using a Dimension 3100 AFM p rovided
with CAFM and Kelvin probe force microscope (KPFM)
modules. The CAFM allows us to obtain, simultaneously
to the topog raphy, current images of the structures, by
means of applying a constant voltage between the t ip
and the sample during a surface scan, and I-V character-
istics on fixed locations, by means of applying ramped
voltage tests. The KPFM allows us to obtain, simulta-
neously to the topography, images of the contact poten-
tial difference (CPD) between the tip and the substrate.
For all the current and CPD measurements, Si tips with
a Pt-Ir or diamond coating were used. Topographic
images have been obtained in tapping mode using
Silicon ultra sharp tips without coating, which offer a
* Correspondence:
Dept. Eng. Electrònica, Edifici Q, Campus UAB, 08193 Bellaterra, Spain
Lanza et al. Nanoscale Research Letters 2011, 6:108
/>© 2011 Lanza et al; licensee Springer. This is an Open A ccess article distributed under the terms of the Creative Commons Attribution
License ( y/2.0 ), which permits unrestricted use, distribution, and reproduction in a ny medium,
provided the original work is properly cited.
better spatial resolution. Other techniques such as trans-
mis sion electron microscopy (TEM) and X-ray reflecto-
metry have been also used to perform a physical
analysis of the structures.
As-grown dielectrics
To begin with, a physical analysis of the two samples
has been performed with TEM and X-ray Reflectometry.
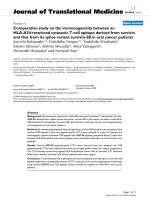
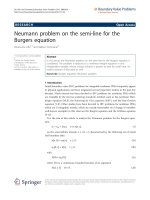
Figure 1 shows cross-sectional TEM im ages of the sam-
ple annealed at (a) 750 and (b) 950°C. Note that the dif-
ferent layers of the stack structure are clearly
distinguished (SiO
2
interfacial layer and high-k dielec-
tric). Moreover, it can also be observed that the sample
annealed at 950°C shows a pol ycrystalline structure (the
different gray intensities in the high-k layer correspond-
ing to the different orientations of the nanocrystals),
while the sample annealed at 750°C remains amorphous.
These results were confirmed from GIXRD measure-
ments [21]. From TEM images, the crystalline grains
seem to have a diameter of 15-30 nm. The surface of
the two samples has also been studied from AFM topo-
graphy maps. Figure 1 shows topographic images
obtained on the (c) amorphous and (d) polycrystalline
structures. The root mean square (rms) value of the
images is also included. Although in this experiment the
resolution of the set-up does not allow to distinguish
single crystals, the figure indicates an increase of the
surface roughness after polycrystallization, in agreement
with [11,22]. Finally, since a thermal annealing process
can also affect the thickness of the layers of the stack,
the actual physical thicknesses of the SiO
2
and Al
2
O
3
films were determined from X-ray Reflectometry (Table 1).
Note that, after polycrystallization, a reduction in the
thickness of the high-k layer is observed [23], leading to a
smaller equivalent oxide thickness (EOT) [17].
The impact of the polycrystallization of the Al
2
O
3
layer on the electrical conduction of the gate stack has
been analyzed at the nanoscale from current and CPD
images obtained on fresh structures (before an electrical
stress). Figure 1e,f shows two current images obtained
on the amorphous and polycrystalline sample, respec-
tively, at 10.25 V (their ave rage and rms values are
included in the figure). Note that smaller currents (in
average) are measured in the polycrystalline stack. How-
ever, since the EOT of the polycrystalline sample is
smal ler (see Table 1), its lower conductivity can only be
attributed to the crystallinity of the stack and not to the
reduction of the oxide thickness. Figure 1f also shows
that the rms value of the current and, therefore, the
electrical inhomogeneity of the polycrystalline stack is
larger. Both samples have also been analyzed with
KPFM [21], which can provide information about the
presence of charge and trapping centers in the stack.
Figure 1 shows two CPD images obtained on the
amorphous (g) and polycrystalline sample (h). Their rms
value is also included. Again, after crystallization, the
deviation increases, suggesting larger inhomogeneities in
its trapping properties.
The results presented until now demonstrate that the
polycrystallization o f the Al
2
O
3
layers leads to a larger
inhomogeneity of the sample conduction and charge
trapped in the stack, which could be attributed to the
different electrical properties of nanocrystals and grain
boundaries. Ta king advantage of the large lateral resolu-
tion of the CAFM, a more detailed analysis has been
performed to explore this point. Toward this aim, the
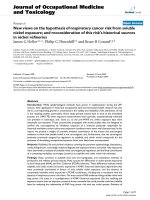
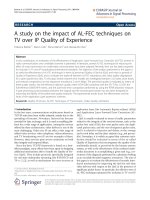
areas with smaller conductivity have been evaluated
from the current images of the sample that h as poly-
crystallized (Figure 2). In Figure 2, the white areas cor-
respond to the regions with a current above 0.2 pA,
while the black areas show a current lower than the
noise level. The t able in Figure 2 includes the results of
the statistical analysis of the image, indicating the num-
ber, density, and size of the regions with a smaller con-
ductivity (black regions). Note that the average size of
these areas is approximately 20 nm, which is compatible
with the results obtained from TEM images (Figure 1)
for the sizes of the A l
2
O
3
nanocrystals. Therefore, these
results suggest that the regions with a smaller conduc-
tivity could be related to the grains in the polycrystalline
structure: the nanocrystals are more insulating whereas
the grain boundaries show a larger conductivity. Note
that, in Figure 2, the width of the regions attributed to
the grain boundaries is much larger than that estimated
in other s tudies [22], when AFM measurements w ere
performed in ultra high vacuum (UHV). This apparent
discrepancy can be explained by considering the impov-
erishment of the lateral resolution of CAFM experi-
ments when working in air, compared to UHV
measurements [22,24]. The differences in electrical
behaviors between n anocrystals and g rain boundaries
could explain the larger inhomogeneity detected in the
current and CPD images after polycrystallization. Grain
boundaries, probably with an excess of some k ind of
defects or tra pping sites generated during the polycrys-
tallization (which could be related to O-vacancies [25]),
could enhance the gate current through them, probably
because of trap-assisted-tunneling (TAT) through the
defects detected with KPFM [23].
It is important to emphasize that the correlation of
the leaky positions with the grain boundaries is a quali-
tative result, since the resolution in these experiments is
not high enough to resolve grain boundaries. This is
because the CAFM measurements presented in this sec-
tion have been performed with Si tips coated with a
metallic layer in ambient conditions, drastically reduc ing
its lateral resolution to approximat ely 20 nm [26]. Note,
however, that other experiments, with sufficient
Lanza et al. Nanoscale Research Letters 2011, 6:108
/>Page 2 of 9
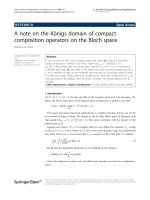
Figure 1 TEM images (a, b), topographic maps (c, d), current maps (e, f), and CPD maps (g, h) for amorphous (left column) and
polycrystalline (right column) samples. The values of the most relevant parameters are shown.
Lanza et al. Nanoscale Research Letters 2011, 6:108
/>Page 3 of 9
resolution, have shown the relation between leaky sites
and grain boundaries [27,28]. The section “Influence of
the environment on the resolution of grain boundaries”
will be devoted to investigate how the CAFM resolut ion
can be improved.
Stressed dielectrics
In this section, the impact of an e lectrical stress on the
electrical conduction and charge trapping of the Al
2
O
3
layers will be analyzed at the nanoscale. Differences
between amorphous and polycrystalline structures will
be evaluated. First, the effect of the degradation (before
breakdown) induced during a constant voltage scan on a
certain area of the oxide will be investigated. Toward
this aim, sequences of current images have been col-
lected, on amorphous and polycrystalline Al
2
O
3
samples.
First, a 500 nm × 500 nm area was scanned by applying
a large enough constant voltage to induce degradation.
Afterward, two zoom-outs were done, and larger areas
were scanned (1000 × 1000 nm
2
and 1500 × 1500 nm
2
),
which included the previously scanned smaller areas.
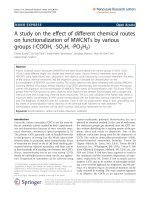
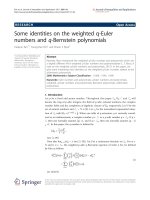
Figure 3 shows a sequence of three images measured on
the amorphous (a, b, and c) and polycrystalline (d, e,
and f) samples. The first scan corresponds to images (a)
and (d) and, the last scan, to images (c) and (f). The
sizes of the images are (a and d) 500 nm × 500 nm, (b
and e) 1 μm×1μm, and (c and f) 1.5 μm×1.5μm.
The applied voltage was 11.5 V in all the cases. This
procedure allows us to compare areas that have been
subjected to different stresses–or, in other words–areas
that have experienced different degradation levels.
Comparing Figure 3a,d, which corresponds to the first
image (fresh area) measured on amorphous and poly-
crystalline structures, respectively, results similar to
those shown in the previous sectio n are obtained. On
polycrystall ine samples, background conduction is smal-
ler (table of Figure 3, f irst scan). However, the leaky
sites of polycrystalline structures (spot S3, S4, and S5)
have a larger conductivity compared to t hose of amor-
phous samples (S1 and S2). As discussed in the previous
secti on, the la rger current differences in the polycrystal-
line structure could be attributed to the differences in
the conductivities between the crystals (background)
and grain boundaries (leaky sites).
Theeffectofthestresshasbeenanalyzedfromthe
images measured during the zoom-outs. On the amor-
phous sample (Figure 3b), the central area (which was
previously pre-stressed, Figure 3a) shows smaller cur-
rents than the rest of the scanned region. A similar
behavior can be observed in Figure 3c, where three co n-
centric areas can be distinguished: a first central area
with the smalles t current value (three scans), another
second area with a larger current (two scans), and the
peripheral and the most conductive area (only one scan,
that is, a fresh area). The quantitative values of the
background current on the three concentric areas are
shown in the table of Figure 3. In the amorphous sam-
ple, the background current decreases significantly as
the stress proceeds, making the structure less conduc-
tive. This behavior, as alre ady pointed out for SiO
2
layers [29] or high-k dielectrics, can be related to nega-
tive charge trapping in the native defects or in traps
generated during the stress. In the case of polycrystalline
structures (Figure 3d,e,f and table), the decrease in the
background conductivity is less important when com-
pared to amorphous samples. This result suggests a
smaller impact of the stress at the positions where crys-
tals are present.
Although, in polycrystalline samples, regions with
background currents (which can be probably related to
positions with a crystal u nder the CAFM tip) seem to
be more resistive and robust to an electrical stress than
amorphous oxides, this behavior cannot be extended to
Table 1 Thicknesses of the Al
2
O
3
and SiO
2
layers
obtained from X-ray reflectrometry on the amorphous
and polycrystalline samples
Phase Al
2
O
3
thickness
(nm)
SiO
2
thickness
(nm)
EOT (nm)
Amorphous 14.6 1.0 7.3
Polycrystalline 12.4 1.2 6.6
The EOT was estimated by considering a permittivity of 9.1 for the Al
2
O
3
layer.
# Grains
Density
ȝPð
Diameter (nm)
Mean Deviation
78 312 19.5 19.0
Figure 2 Grain analysis of a current image measured on the
sample annealed at 950°C. White areas correspond to currents
above the noise level (0.2 pA.)
Lanza et al. Nanoscale Research Letters 2011, 6:108
/>Page 4 of 9
the weak spots (leaky sites). A s an example, the table in
Figure 3 shows the maximum current in different spots
and its evolution with the stress on amorphous (spots
S1 and S2) and polycrystalline samples (S3, S4, and S5).
Note that the weak sp ots in the polycrystalline structure
show, before the stress ("first scan”), larger leakage cur-
rents compared with the amorphous gate oxide. How-
ever, after the stress ("second scan” and “third scan”),
the reduction of current through these spots is larger
than those in amorpho us structures. Therefore, initially,
the leaky sites of polycrystalline samples are, from an
electrical point of view, weaker (their conductivity is
higher) than those in amorphous oxides (because the
dielectric is thinner or because of the presence of
defects that enhance tunneling). Howeve r, as the stress
proceeds, a larger amount of charge is trapped in the
as-grown or generated defects on the leaky positions,
leading to a higher re duction of the current c ompared
to amorphous oxides. Since these leaky regions could be
related to the grain boundaries between nanocrystals,
charge trapping (in as-grown or generated defects)
mainly occurs at those locations, leading to a higher
reduction of the conductivity compared to the back-
ground areas. In amorphous samples, no distinction
between crystals and grain boundaries can be observed,
and so trapping is randomly distributed in the gate area.
Finally, the impact of breakdown (BD) was also inves -
tigated on polycrystalline and amorphous oxides.
Toward this aim, first, ramped voltage stresses (RVS)
with a current limit of 100 pA and with the same
Current on the amorphous sample (pA) Current on the polycrystalline sample (pA)
Background S1 S2 Background S3 S4 S5
First Scan 0.42 1.4 0.99 0.10 5.8 2.5 4.0
Second scan 0.13 1.2 0.51 0.07 1.2 0.87 1.1
Third scan 0.05 0.65 0.48 0.05 0.67 0.32 0.62
Figure 3 First scans (a, b) and two consecutive zooms out (b/e, c/f) on amorphous (a, b, c) and polycrystalline (d, e, f) samples. Their
sizes are (a, d) 500 nm × 500 nm (b, e) 1 μm×1μm and (c, f) 1.5 μm × 1.5 μm. The applied voltage was 11.5 V in all cases. The table shows
the evolution of the maximum current driven by the spots S1-S5 and on background areas for both samples.
Lanza et al. Nanoscale Research Letters 2011, 6:108
/>Page 5 of 9
ending voltage have been applied on different oxide
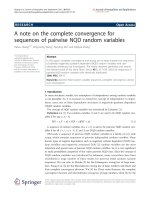
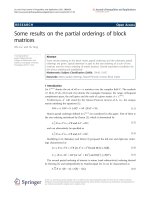
locations until BD. Figure 4a,b shows an example of two
consecutive I-V curves measured on an amorphous and
a polycrystalline structure, respectively. Note that, in the
second RVS, current can be measured at much lower
voltages in both cases, which is an indication that BD
has been triggered. Moreover, the voltage at which
current is measured in the polycrystalline structure is
lower, pointing out a harder BD. After the measurement
of t he I-V curves, current images of the areas that con-
tain the stressed locations have been collected. Figure
4c,d shows the current images obtained on a 1 μm×1
μm area of the amorphous (c) and the polycrystalline
(d) sample where four RVS had been previously applied
S1 S2 S3 S4
(c)
Current (pA)
0.38 0.74 0.66 0.54
Area (nm
2
)
8.8·10
2
1.1·10
2
1.1·10
4
7.2·10
3
(d)
Current (pA)
9.8 7.3 9.8 9.6
Area (nm
2
)
2.3·10
4
8.4·10
3
2.3·10
4
1.9·10
4
Figure 4 Current images obtained on an amorphous (c ) and polycrystalline (d) sample where previously, four RVS where applied to
induce BD. The voltage applied during the scan was, in both cases, -8.6 V. (a, b) correspond to typical I-V curves measured on those positions.
The maximum current and area of the BD spots can be found in the table.
Lanza et al. Nanoscale Research Letters 2011, 6:108
/>Page 6 of 9
until BD at different locations. Regions with larger cur-
rents a re observed, which correspond to the BD spots.
The table in the figure shows the maximum current and
area of the BD spots generated on each sample. Note
that, for the amorphous sample, the BD areas are smal-
ler and the post-BD electrical conduction is lower, sug-
gesting softer BD events, in agreement with the post-BD
I-V curves. From these results and those obtained dur-
ing the degradation stage, it seems reasonable to specu-
late that , in polycrystalline structures (with harder BD),
BD takes place at the weaker regions, that is, the grain
boun daries. Therefore, the presence of grain boundaries
on Al
2
O
3
layers could reduce significantly the reliability
of MOS devices due to their lower robustness.
Influence of the environment on the resolution of grain
boundaries
Some authors have suggested that, when working with a
CAFM in air, the tip-sample contact area increases,
probably due to the presence of a water layer on the
sample (and, therefore, a water meniscus between the
tip and the surface), which can reduce the lateral resolu-
tion of the measurements [19,30,31]. Since the grain
boundaries width is in the range of few nanome ters
[32,33] and the CAFM lateral resolution in air when
using metal coated tips is about 10 nm, grain bound-
aries could not always b e resolved. This would explain
why in the sections “As-grown dielectrics” and “Stressed
dielectrics” when working with a CAFM in ambient con-
ditions, a point-to-point correlation between the topo-
graphical and electrical properties (in particular,
between the leaky sites and the grain boundaries posi-
tion) was not possible. For this reason, when a higher
resolution is needed, CAFM in vacuum or UHV has
been used [12,24,34,35]. In this section, the impact of
environmental conditions on the CAFM electrical reso-
lution for the study of polycrystalline structures will be
analyzed.
Toward the above aim, topographical and current
images obtained on polycrystalline high-k dielectrics at
different ambient conditions have been compared.
Figure 5 shows topographical (first row) and current
(second row) maps measured on a 5-nm-thick HfO
2
layer grown on a Si substrate, obtained in air (a and d),
high-vacuum (b and e, 1.2 × 10
-6
mbar), and UHV
(c and f, 10
-9
mbar) [35]. In current images, the white
areas correspond to the regions with a current above
0.2 pA, while the black areas show a current lower than
the noise level. Note that as pressure decreases (and,
therefore, the size of the water meniscus is reduced),
topography images show a better-defined granular struc-
ture, which can be attributed to single (or a cluster of)
nanocrystals (grain boundaries would correspond to the
depressed regions [32]). Current maps show a s imilar
behavior. While in UHV, a clear granular pattern can be
obs erved [35] (which overlaps with that observed in the
topographical image, indicating that current flows
mainly through grain boundaries, as suggested in
the sections “ As-grown dielectrics” and “Stressed
dielectrics”), in HV and, specially, in air, the granular
structure is not so clearly distinguishable and a point-
to-point correlation of the leakage spots with the posi-
tion of the grain boundaries is not possible. If it is
assumed that, in (d) and (e), the current is measured
basically through GBs (conclusion that can be drawn
from the analysis of images c and f), then the measured
GB’s width is much larger than that in (f). All these
effects co uld be related, as demonstrated in [19], to the
contact area increase because of the presence of the
water meniscus. Therefore, the results clearly demon-
strate that the AFM lateral resolution is very sensitive to
the environment, a point that is extremely important
when studying polycrystalline high-k diele ctrics. Since
the grain boundaries width is close to the limit of the
AFM resolution, environmental conditions can be the
determinant factors to precisely correlate the leakage
spots position with the morpholo gical structure of the
high-k dielectric.
Conclusion
The conductivity and charge trapping of amorphous
and polycrystalline Al
2
O
3
layers stacks for memory
applications have been studied before and after an
electrical stress at nanometer scale using AFM-related
techniques in ambient conditions. The c urrent mea-
surements obtained with CAFM before an electrical
stress show that the polycrystallization of the Al
2
O
3
leads to a smaller a verage and a larger spatial inhomo-
geneity of the sample conductivity. A statistical analy-
sis of the current images registered on polycrystalline
samples has been compared to the measurements
obtained with TEM, showing that the mean size of the
less conductive areas is similar to the dimensions of
the crystals. Therefore, the regions with a smaller con-
ductivity could be related to the grains of the polycrys-
talline structure: the polycrystals are more insulating
whereas the grain boundaries show a larger conductiv-
ity. The charge-trapping properties of amorphous and
polycrystalline samples were also investigated after an
electrical stress. The results suggest that, although the
crystals are more resistive and robust (from an electri-
cal point of view) than the amorphous oxide, the grain
boundaries of the polycrystalline samples seem to be
more sensitive to an electrical s tress than those of the
non-crystallized structures: grain boundaries would
initially act as conductive paths, but would favor a fas-
ter charge trapping. Therefore, polycrystallization
strongly contributes to the inhomogeneity increase of
Lanza et al. Nanoscale Research Letters 2011, 6:108
/>Page 7 of 9
the conduction and trapping properties of the stacks,
which could reduce the reliability of the MOS devices
due to the weaker dielectric strength of the grain
boundaries. Finally, the influence of the environment
conditions on the study of polycrystalline high-k
dielectrics was also analyzed. The results demonstrate
that the reduction of the water meniscus can be a
determinant factor for a precise study in detail on the
electrical properties of the grain boundaries.
Abbreviations
AFM: atomic force microscopy; BD: breakdown; CFAM: conductive atomic
force microscope; CPD: contact potential difference; GBs: grain boundaries;
KPFM: Kelvin probe force microscope; rms: root mean square; RTP: rapid
thermal process; RVS: ramped voltage stresses; TAT: trap-assisted-tunneling;
TEM: transmission electron microscopy; UHV: ultra high vacuum.
Acknowledgements
This study has been partially supported by the Spanish MICINN (TEC2007-
61294/MIC research project and HA2007-0029 Integrated Action), and the
“La Caixa” and Deutscher Akademischer Austausch Dienst (DAAD) pre-
doctoral fellowships program. The authors are also grateful to P. Michalowski
and L. Wilde from Fraunhofer Centre Nanoelectronic Technology (Dresden)
for help in carrying out TEM experiments, to G. Benstetter and D.P. Yu from
Hochschule Deggendorf and Peking University, respectively, for hosting M.
Lanza to carry out some of the presented AFM experiments and to G.
Jaschke and S. Teichert (Qimonda, Germany) and G. Bersuker (Sematech,
USA) for sample provision. The authors also want to acknowledge T.
Schroeder (IHP) for hosting V. Iglesias in their facilities in Frankfurt Oder
(Germany). The authors are also indebted to them for valuable discussions.
Authors’ contributions
ML collected all topographic and current scans performed in air. VI carried
out the topographic and current scans performed in ultra high vacuum
conditions. MP contributed to the redaction of the manuscript and in the
design of the study. MN and XA participated in the design and coordination
of the study and reviewed the manuscript. All authors read and approved
the final manuscript.
Competing interests
The authors declare that they have no competing interests.
Received: 11 September 2010 Accepted: 31 January 2011
Published: 31 January 2011
References
1. Robertson J: High dielectric constant gate oxides for metal oxide Si
transistors. Rep Progr Phys 2006, 69:327-396.
2. Degraeve R, Aoulaiche M, Kaczer B, Roussel P, Kauerauf T, Sahhaf S,
Groeseneken G: Review of reliability issues in high-k/metal gate stacks.
15th Physical and Failure Analysis of Integrated Circuits (IPFA) 2008, 1-6.
3. Kittl JA, Opsomer K, Popovici M, Menou N, Kaczer B, Wang XP, Adelmann C,
Pawlak MA, Tomida K, Rothschild A, Govoreanu B, Degraeve R, Schaekers M,
Zahid M, Delabie A, Meersschaut J, Polspoel W, Clima S, Pourtois G,
Fi 5 T h ( ) d (d f) b i d l lli 5 hi k li
Figure 5 Topography (a, b, c) and current (d, e, f) maps obtained on a polycrystalline 5-nm-thick HfO
2
sample in different
environments: air (a, d), high-vacuum (b, e), and ultra-high-vacuum (UHV)–(c, f). In current images, white areas correspond to regions with
a current above 0.2 pA, while the black areas show a current lower than the noise level.
Lanza et al. Nanoscale Research Letters 2011, 6:108
/>Page 8 of 9
Knaepen W, Detavernier C, Afanas’ev VV, Blomberg T, Pierreux D, Swerts J,
Fischer P, Maes JW, Manger D, Vandervorst W, Conard T, Franquet A,
Favia P, Bender H, Brijs B, Van Elshocht S, Jurczak M, Van Houdt J,
Wouters DJ: High-k dielectrics for future generation memory devices
(Invited Paper). Microelectron Eng 2009, 86:1789-1795.
4. Pagano R, Lombardo S, Palumbo F, Kirsch P, Krishnan SA, Young C, Choi R,
Bersuker G, Stathis JH: A novel approach to characterization of
progressive breakdown in high-k/metal gate stacks. Microelectron Reliab
2008, 48:1759-1764.
5. Fiorenza P, Polspoel W, Vandervorst W: Conductive atomic force
microscopy studies of thin SiO
2
layer degradation. Appl Phys Lett 2006,
88:222104.
6. Frammelsberger W, Benstetter G, Kiely J, Stamp R: Thickness determination
of thin and ultra-thin SiO
2
films by C-AFM IV-spectroscopy. Appl Surf Sci
2006, 252:2375-2388.
7. Porti M, Nafría M, Aymerich X: Nanometer-scale analysis of current limited
stresses impact on SiO
2
gate oxide reliability using C-AFM. IEEE Trans
Nanotechnol 2004, 3:55-60.
8. Wang SD, Chang MN, Chen CY, Ley TF: Observation of localized
breakdown spots in thin SiO
2
films using scanning capacitance
microscopy. Electrochem Solid State Lett 2005, 8:G233-G236.
9. Zhang L, Mitani Y: Structural and electrical evolution of gate dielectric
breakdown observed by conductive atomic force microscopy. Appl Phys
Lett 2006, 88:032906.
10. Yanev V, Rommel M, Lemberger M, Petersen S, Amon B, Erlbacher T,
Bauer AJ, Ryssel H, Paskaleva A, Weinreich W, Fachmann C, Heitmann J,
Schroeder U: Tunneling atomic-force microscopy as a highly sensitive
mapping tool for the characterization of film morphology in thin high-k
dielectrics. Appl Phys Lett 2008, 92:252910.
11. Weinreich W, Wilde L, Kucher P, Lemberger M, Yanev V, Rommel M,
Bauer AJ, Erben E, Heitmann J, Schroder U, Oberbeck L: Correlation of
microscopic and macroscopic electrical characteristics of high-k ZrSi
x
O
2-x
thin films using tunneling atomic force microscopy. J Vac Sci Technol B
2009, 27:364-368.
12. Sire C, Blonkowski S, Gordon MJ, Baron T: Statistics of electrical
breakdown field in HfO
2
and SiO
2
films from millimeter to nanometer
length scales. Appl Phys Lett 2007, 91:242905.
13. Wu YL, Lin ST, Lee CP: Time-to-breakdown weibull distribution of thin
gate oxide subjected to nanoscaled constant-voltage and constant-
current stresses. IEEE Trans Devices Mater Reliab 2008, 8:352-357.
14. Efthymiou E, Bernardini S, Volkos SN, Hamilton B, Zhang JF, Uppal HJ,
Peaker AR: Reliability nano-characterization of thin SiO
2
and HfSi
x
O
y
/SiO
2
gate stacks. Microelectron Eng 2007, 84:2290-2293.
15. Blasco X, Petry J, Nafria M, Aymerich X, Richard O, Vandervorst W: C-AFM
characterization of the dependence of HfAlO
x
electrical behavior on
post-deposition annealing temperature. Microelectron Eng 2004,
72:191-196.
16. Menou N, Wang XP, Kaczer B, Polspoel W, Popovici M, Opsomer K,
Pawlak MA, Knaepen W, Detavernier C, Blomberg T, Pierreux D, Swerts J,
Maes JW, Favia P, Bender H, Brijs B, Vandervorst W, Van Elshocht S,
Wouters DJ, Biesemans S, Kittl JA: 0.5 nm EOT low leakage ALD SrTiO
3
on
TiN MIM capacitors for DRAM applications. Int Electron Devices Meeting
Tech Dig 2008, 929.
17. Lanza M, Porti M, Nafria M, Aymerich X, Benstetter G, Lodermeier E,
Ranzinger H, Jaschke G, Teichert S, Wilde L, Michalowski PP: Conductivity
and charge trapping in amorphous and polycrystalline Al
2
O
3
based
devices studied with AFM related techniques. IEEE Trans Nanotechnol
2010, 99:1-9.
18. Yanev V, Rommel M, Lemberger M, Petersen S, Amon B, Erlbacher T,
Bauer AJ, Ryssel H, Paskaleva A, Weinreich W, Fachmann C, Heitmann J,
Schroeder U: Tunneling atomic-force microscopy as a highly sensitive
mapping tool for the characterization of film morphology in thin high-k
dielectrics. Appl Phys Lett 2008, 92:252910.
19. Lanza M, Porti M, Nafría M, Aymerich X, Whittaker E, Hamilton B: UHV
CAFM characterization of high-k dielectrics: effect of the technique
resolution on the pre- and post-breakdown electrical measurements.
Microelectron Reliab 2010, 50:1312-1315.
20. Ho MY, Gong H, Wilk GD, Busch BW, Green ML, Voyles PM, Muller DA,
Bude M, Lin WH, See A, Loomans ME, Lahiri SK, Räisänen PI: Morphology
and crystallization kinetics in HfO2 thin films grown by atomic layer
deposition. J Appl Phys 2003, 93:1477-1481.
21. Lanza M, Porti M, Nafria M, Aymerich X, Benstetter G, Lodermeier E,
Ranzinger H, Jaschke G, Teichert S, Wilde L, Michalowski P: Crystallization
and silicon diffusion nanoscale effects on the electrical properties of
Al
2
O
3
based devices. Microelectron Eng 2009, 86:1921-1924.
22. Iglesias V, Porti M, Nafría M, Aymerich X, Dudek P, Bersuker G: Dielectric
breakdown in polycrystalline hafnium oxide gate dielectrics investigated
by conductive atomic force microscopy. J Vac Sci Technol B 2011,
29:01AB02.
23. Kim Y, Gebara G, Freiler M, Barnett J, Riley D, Chen J, Torres K, JaeEun L,
Foran B, Shaapur F, Agarwal A, Lysaght P, Brown GA, Young C, Borthakur S,
Hong-Jyh L, Nguyen B, Zeitzoff P, Bersuker G, Derro D, Bergmann R,
Murto RW, Hou A, Huff HR, Shero E, Pomarede C, Givens M, Mazanez M,
Werkhoven C: Conventional n-channel MOSFET devices using single layer
HfO
2
and ZrO
2
as high-k gate dielectrics with polysilicon gate electrode.
Proceedings of the IEEE International Electron Devices Meeting 20.2.1 2001,
455.
24. Lanza M, Porti M, Nafría M, Aymerich X, Wittaker E, Hamilton B: Electrical
resolution during Conductive AFM measurements under different
environmental conditions and contact forces. Rev Sci Instrum 2010,
81:106110.
25. Bersuker G, Korkin A, Jeon Y, Huff HR: A model for gate oxide wear out
based on electron capture by localized states. Appl Phys Lett 2002,
80:832-834.
26. Porti M, Nafría M, Aymerich X: Current limited stresses of SiO
2
gate oxides
with conductive atomic force microscope. IEEE Trans Electron Devices
2003, 50:933-940.
27. Yu X, Huang J, Mingbin Y, Chunxiang Z: Effect of gate dopant diffusion
on leakage current in n
+
Poly-Si/HfO
2
and examination of leakage paths
by conducting atomic force microscopy. IEEE Electon Device Lett 2007,
28:373-375.
28. Paskaleva A, Yanev V, Rommel M, Lemberger M, Bauer AJ: Improved
insight in charge trapping of high-k ZrO
2
/SiO
2
stacks by use of
tunneling atomic force microscopy. J Appl Phys 2008, 104:024108.
29. Porti M, Nafria M, Aymerich X, Olbrich A, Ebersberger B: Electrical
characterization of stressed and broken down SiO
2
films at a nanometer
scale using a conductive atomic force microscope. J Appl Phys 2002,
91:2071-2079.
30. Kremmer S, Peissl S, Teichert C, Kuchar F: Conducting atomic-force
microscopy investigations on thin silicon gate oxides: influence of tip
shape and humidity. Proceedins of the 28th International Symposium of
Testing and Failure Analysis, EDFAS 2002, 473-482.
31. Israelachvili JN: Intermolecular and Surface Forces London: Academic Press;
1992.
32. Bersuker G, Yum J, Iglesias V, Porti M, Nafría M, McKenna K, Shluger A,
Kirsch P, Jammy R: Grain boundary-driven leakage path formation in
HfO2 dielectrics. Proceedings of the 41th Solid-State Device Research
Conference ESSDERC 2010, 333-336, ISSN 1930-8876.
33. McKenna K, Shluger A: The interaction of oxygen vacancies with grain
boundaries in monoclinic HfO
2
. Appl Phys Lett 2009, 95:222111.
34. Uppal HJ, Mitrovic IZ, Hall S, Hamilton B, Markevich V, Peaker AR:
Breakdown and degradation of ultrathin Hf-based (HfO2
(x)
(SiO2)
(1-x)
. J
Vac Sci Technol B 2009, 27:443-447.
35. Iglesias V, Porti M, Nafría M, Aymerich X, Dudek P, Schroeder T, Bersuker G:
Correlation between the nanoscale electrical and morphological
properties of crystallized hafnium oxide-based metal oxide
semiconductor structures. Appl Phys Lett 2010, 97:262906.
doi:10.1186/1556-276X-6-108
Cite this article as: Lanza et al.: Polycrystallization effects on the
nanoscale electrical properties of high-k dielectrics. Nanoscale Research
Letters 2011 6:108.
Lanza et al. Nanoscale Research Letters 2011, 6:108
/>Page 9 of 9