Methods and Techniques in Urban Engineering Part 4 pot
Bạn đang xem bản rút gọn của tài liệu. Xem và tải ngay bản đầy đủ của tài liệu tại đây (938.44 KB, 20 trang )
Methods and Techniques in Urban Engineering
52
4.2 Overview on multicriteria analysis methods
There are numerous methods for structuring a decision problem, evaluating feasible
alternatives and prioritizing alternative decisions that can be implemented in siting
procedures (see Malczewski 1999 and Malczewski 2006 for an overview on methods). In this
subchapter, only some of them will be briefly described.
4.2.1 GIS-based overlay mapping
Overlay mapping is one of the most frequently used methods in environmental planning. Its
basis approach is relatively simple. Following a given problem definition, certain evaluation
criteria resp. attributes are presented in the form op maps or map layers in a GIS
environment. Each map can be regarded as an individual suitability map with respect to the
land use under consideration. Based on defined aggregation rules (see above), these maps
will then be combined to provide an overall suitability map. GIS software provides the
operator with a broad range of tools related to map algebra techniques. Therefore, if
appropriate geodata sources are available, overlay mapping is quite easy to implement.
A B
Determination of the analysis area
1
Determination of alternative routes
A B
4
Identification of corridors with minimal conflicts
A B
3
Analysis and mapping of environmental functions
A B
2
“Conflict-assignment” to alternative routes
A B
5
821512Area (ha)
743Number
VAR 3
VAR2VAR 1Conflicts
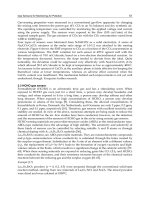
Fig. 2. GIS-based identification of infrastructure corridors with minimal environmental conflicts
Figure 2 shows the workflow of an overlay mapping approach used in transport planning in
Germany. The procedure intends to identify a suitable corridor for a road or railway track in
an early stage of planning. The “suitability” of potential corridors is assessed by their
potential conflicts with environmental and social values. After determining the study area
(phase 1), environmental and social values that might indicate natural or social constraints
for infrastructure planning (e.g. protected habitats that might be dissected or sensitive urban
functions that are affected by noise emissions) have to be mapped and organized in a GIS
layer structure (phase 2). Based on a spatial overlay of potential constraints and conflicts,
Locating Sites for Locally Unwanted Land Uses: Successfully Coping with NIMBY Resistance
53
alternative corridors with an expected minimum number of conflicts are determined (phase
3 and 4). Finally, all alternatives are compared with respect to their conflict intensity (phase
5). A simple summation of function-specific conflicts can be used here.
Another overlay mapping method, popular in German environmental planning, is called
Ecological Risk Assessment (ERA). The method attempts to estimate the “ecological risk” of
projects in situations that are characterized by a high degree of uncertainty. In ERA, “risk”
means the possibility of threats to valued natural assets and ecological components. The
estimated risk is regarded as the product of natural vulnerability and the level of
perturbation (or disturbance) due to the project under consideration. Risk modeling in ERA
follows the common rule that the higher the vulnerability and the level of perturbation, the
higher the risk of an environmental damage.
The method is organized in three steps. In step 1, the potentially affected area by the project
and its physical features has to be analyzed. Step 2 attempts to assess the level of
vulnerability based on a thorough analysis of valued ecological components (or functions).
The results of this analysis are stored as a series of GIS layers. With step 3, the ecological risk
has to be estimated. Usually, a simple matrix with ordinal scales for addressing vulnerability
and perturbation features is used for this final step (Figure 3). Map algebra functions
technically support this kind of risk modeling in a GIS environment.
low vulnerability
moderate vulnerability
high vulnerability
low level of perturbation
moderate level of perturbation
high level of perturbation
Perturbation
Vulnerability
High risk low risk
Fig. 3. Risk-assessment scheme in Ecological Risk Assessment (ERA)
4.2.2 Analytical hierarchical process
The Analytic Hierarchical Process (AHP) – developed by Thomas Saaty in 1980 (Saaty 1980)
– requires the operator to decompose a decision problem in form of a hierarchy of objectives,
criteria and alternatives (Figure 4). The method involves one-on-one comparisons between
each element of a certain hierarchy level. Pairwise comparisons are used to assign relative
weights on the objectives and criteria based on a standard ratio scale (Table 4). Saaty
introduced different approaches to calculating relative weights based on a pairwise
comparison matrix. The result is a composite set of priorities for the lowest tier of the
hierarchy, namely the alternatives.
Methods and Techniques in Urban Engineering
54
One of the main advantages of the method is the fact that it is able to process information of
different scales. Qualitative judgements (“A is much more important than B”) are handled in
the same way as numeric values (“A is 5.4 whereas B is only 2.9”).
Alternatives
Criteria
c
2
…
…
c
n
Objective
a
1
a
2
a
3
c
1
c
2.1
… c
2.n
Fig. 4. Hierarchical structure of a decision problem within the AHP process
S
cale Meaning/Interpretation
1 same
3 (1/3) a little bit larger (smaller) or more important (less important)
5 (1/5) significant larger (smaller) or more important (less important)
7 (1/7) much larger (smaller) or more important (less important)
9 (1/9) very much larger (smaller) or more important (less important)
Table 4. The AHP standard scale for pairwise comparisons
4.2.3 Utility analysis
Next to Cost-Benefit Analysis, Utility Analysis (UA) is one of the best-known multicriteria
analysis methods used in environmental and infrastructure planning in Germany (see
Figure 5). The key principle of UA approaches is the transformation of attribute values of
different scales into an interval (value) scale, usually a standard scale ranging from 0 to 100
or 0 to 1.0. The transformation process requires criteria-specific transformation functions
(also called utility functions), which reflect the decision maker’s preferences. The
transformed values are aggregated into a total utility value that represents the performance
of an alternative. Weights are used to express the different importance of the employed
criteria. The multiplication of (criteria resp. attribute specific) utility values by the
determined weights leads to partial utility values. In the standard procedure of UA, the final
aggregation is carried out as a simple summation of partial utility values. The alternative
with the highest total utility value is the preferred one.
Locating Sites for Locally Unwanted Land Uses: Successfully Coping with NIMBY Resistance
55
Problem definition
Planning alternatives Set of goals/objectives
Set of assessment criteria
Set of Indicators
Indicator values Transformation functions
Transformed values
Partial utility values/
Total utility value
Objective-specific
weight factors/
(aggregation)
factual level
normative level
Optimization of alternatives
Analysis of sensitivity
Fig. 5. Basic scheme of Utility Analysis methods (adapted from Bechmann, 1989)
It should be emphasized that UA approaches underlie one crucial assumption: the additivity
of attributes. The additivity assumption requires that there are no interaction effects
between the selected attributes. Complementarities between attributes may lead to
inappropriate results. Therefore, the implementation of UA methods should be based on a
thoroughly carried out theoretical analysis of the decision situation.
4.3 Case study: the siting of wind energy farms in Germany
Due to massive public funding, Germany experienced a tremendous growth in wind energy
production in recent years. Currently, more than 18,000 wind energy plants with a capacity
of 20,000 MW are installed throughout the country with spatial hubs in coastal and “flat”
regions of the North. In 2006, the share of wind energy to total electricity consumption was
more that 6%. Like in other western countries, wind energy planning in Germany is
characterized by high public support of wind energy use in general but massive opposition
against local windfarm projects.
After experiencing a phase of chaotic spread of wind mills in the 1990s, the German
legislator adopted some amendments to federal regional and urban planning codes in order
to achieve a more controlled wind energy planning. Henceforward, the use of wind energy
outside urbanized areas (“Außenbereich”) was regarded as privileged. “Privileged” means
that certain kinds of land uses are permitted in general without making any arrangements
for their location. Developers must get permission unless public concerns are opposed to a
specific (privileged) land use. Taken wind energy use as an example, relevant concerns
could encompass negative effects to scenic values, threats to well-being of residents nearby
Methods and Techniques in Urban Engineering
56
proposed mills or nature and species protection goals. However, the legal barriers for permit
agencies to deny permission are quite high.
At the same time, regional and local planning administration got the right to effectively
manage the location of wind energy mills by means of spatial concentration zones as well as
“no-go” zones for future wind energy production. The most powerful instrument of
regional and local land use planning is called suitability area (“Eignungsgebiet”) where
specified land uses (e.g. wind mills) are to be concentrated (see § 7 Sec. 4 No. 3 of the Federal
Regional Planning Act). Within the suitability area, the land use under consideration has
priority against rivaling land uses. Outside the area, the land use is totally prohibited.
Based on numerous court decisions and planning guidance documents provided by state
agencies, a standard procedure of wind energy planning (and the siting of wind mills) has
been implemented in regional and local land use planning. Most importantly, the courts
consider negative planning associated with a total ban for privileged land uses as illegal.
The Federal Administration Court has pointed out that the exclusion of wind energy
production from parts of the jurisdiction is justifiable only in cases when the land use plan
secures the priority of wind mills against other land uses on other suitable lands. Simply
spoken, a community that dislikes wind mills is not allowed to ban them from their territory
by exclusionary zoning. German courts demand a coherent planning concept that
acknowledges the privileged status of wind energy production outside urbanized areas
without violating the legal rights of other land users. Therefore, an area-wide and integrated
suitability analysis is regarded as crucial to meet the legal requirements for wind energy
planning.
The suitability analysis is usually organized as follows:
In step 1, areas that are regarded as non-suitable for wind mills are excluded from
further analysis; Table 5 outlines a set of exemplary criteria for the exclusion of “no-go
areas”.
In step 2, areas with wind speeds below commercial standards have to be excluded
from further analysis.
Step 3 aims to model the conflict potential in the remaining areas after excluding no-go
areas and areas with unsuitable resource quality. For this purpose, a set of criteria
indicating conflicts with other land uses is used. Areas with a critical spatial overlay of
conflicts are excluded. Often, a simple additive weighting is used to determine those
areas.
Step 4 excludes smaller areas below a threshold value (e.g. 20 hectares) to avoid a
spatial dispersion of small wind farms. However, the relevance of step 4 depends on
whether regional or local policy makers prefer a lower number of larger wind farms
(with more than 10 or 20 mills).
Finally, step 5 undertakes an individual assessment of remaining areas with technical
and economic criteria (e.g. accessibility by road or tracks, connectivity to existing power
lines) as well as small-scale conflict criteria (e.g. soil features, distance to farms or small
settlements).
This stepwise suitability analysis can be effectively supported by GIS tools. Both, raster and
vector data analysis will be relevant for solving the siting task.
Locating Sites for Locally Unwanted Land Uses: Successfully Coping with NIMBY Resistance
57
C
riterion Value
Distance to urbanized areas < 700 m
Distance to four-lane motorways < 40 m
Distance to two-lane federal and state roads < 20 m
Distance to railway tracks < 50 m
Nature protection areas Area with a 200 m buffer
Nature protection areas of European importance
(FFH and bird protection areas)
Area with a 1.000 m buffer
Distance to rivers and creeks < 10 m
Protected forest areas Area with a 200 m buffer
Areas for groundwater protection Area
Table 5. “No-go areas” for wind mill siting in Baden-Württemberg
5. Conclusion
The NIMBY syndrome is by no means an impregnable barrier towards successful facility
planning. The way in which planners and engineers deal with NIMBY attitudes held by
local residents highly influences the viability of resistance and the outcome of planning.
Planners should learn from “informative failures” and improve the quality of procedural
standards. Procedural fairness, based on a broad risk-communication, is a crucial
prerequisite in successfully coping with NIMBY opposition. GIS-based multicriteria analysis
methods may help to slow down protest by supporting a transparent, trustful planning
process. Providing transparency of information and explicit or implicit normative
assumptions is an effective means of communicating about risks of planned facilities. It
should be emphasized that quantitative multicriteria decision techniques, following a
rational and logical planning credo, on the one hand and forms of local negotiation and
consensus building on the other hand are complementary not exclusionary.
6. References
Bechmann, A. (1989). Die Nutzwertanalyse, In:
Handbuch der UVP
, Storm, P.C.; Bunge, T.
(Ed.), 31 p., Abschnitt 3555, Berlin
Bell, D.; Gray, T. & Haggett, C. (2005). The ‘social gap’ in wind farm siting decisions:
explanations and policy responses.
Environmental Politics
, Vol. 14, No. 4, 460-477
Davy, B. (1997).
Essential Injustice - When Legal Institutions Cannot Resolve Environmental
and Land Use Disputes
, Springer, New York
Fischel, W.A. (2001). Why are there NIMBYs?.
Land Economics
, Vol. 77, No. 1, 144-152
Freudenburg, W.R. (2004). Can we learn from failure? Examining US experiences with
nuclear repository siting.
Journal of Risk Research
, Vol. 7, No. 2, 153-169
Methods and Techniques in Urban Engineering
58
Kahn, R. (2000). Siting struggles: the unique challenge of permitting renewable energy
power plants.
Electricity Journal
, Vol. 13, No. 2, 21-33
Kunreuther, H. & Susskind, L.E. (1991).
The Facility Siting Credo: Guidelines for an
Effective Facility Siting Process
, Publication Services, University of Pennsylvania,
Philadelphia, PA
Lober, D.J. (1995). Why protest? Public behavioural and attitudinal response to siting a
waste disposal facility.
Policy Studies Journal
, Vol. 23, No. 3, 499-518
Malczewski, J. (1999). Spatial multicriteria decision making, In:
Spatial Multicriteria
Decision Making and Analysis. A Geographic Information Sciences Approach
,
Thill, J C. (Ed.), 11-48, Aldershot et al., Ashgate
Malczewski, J. (2006). GIS-based multicriteria decision analysis: a survey of the literature.
International Journal of Geographical Information Science
, Vol. 20, No. 7, 703-726
Owens, S. (2004). Siting, sustainable development and social priorities.
Journal of Risk
Research
, Vol. 7, No. 2, 101-114
Saaty, T. (1980).
The Analytic Hierarchy Process
, McGraw-Hill, New York
Schively, C. (2007). Understanding the NIMBY and LULU phenomena. Reassessing our
knowlegde base and informing future research.
Journal of Planning Literature
, Vol.
21, No. 3, 255-266
Wolsink, M. (1994). Entanglement of interests and motives: assumptions behind the NIMBY-
theory on facility siting.
Urban Studies
, Vol. 31, No. 6, 851-866
ComputationalToolsappliedtoUrbanEngineering
ArmandoCarlosdePinaFilho,FernandoRodriguesLima,RenatoDiasCaladodoAmaral
5
Computational Tools applied to Urban
Engineering
Armando Carlos de Pina Filho, Fernando Rodrigues Lima,
Renato Dias Calado do Amaral
Federal University of Rio de Janeiro (UFRJ)
, ,
Brazil
1. Introduction
The objective of this chapter is to present some of the main computational tools applied to
urban engineering, used in diverse tasks, such as: conception, simulation, analysis,
monitoring and management of data.
In relation to the architectural and structural project, computational tools of CAD/CAE are
frequently used. One of the most known and first software created to Personal Computers
(PCs), with this purpose, was the AutoCAD by Autodesk. At first, the program offered 2D
tools for design assisted by computer, presenting technical and normalisation resources.
After that, the program started to offer 3D tools, becoming possible the conception and
design of more detailed environments. The program is currently used for construction of
virtual environments (or virtual scale models), being used together with other programs for
simulation of movement and action inside of these environments.
Another software very used currently is the ArcGIS, created to perform the geoprocessing,
in which tools and processes are used to generate derived datasets. Geographic information
systems (GIS) include a great set of tools to process geographic information. This collection
of tools is used to operate information, such as: datasets, attribute fields, and cartographic
elements for printed maps. Geoprocessing is used in all phases of a GIS for data automation,
compilation, and management, analysis and modelling of advanced cartography.
In addition to the programs of CAD and GIS, other interesting technology is related to
Building Information Modelling (BIM), which represents the process of generating and
managing building data during its life cycle using three-dimensional, real-time, dynamic
building modelling software to decrease wasted time and resources in building design and
construction. Some of the main software used for BIM are Autodesk Revit Architecture and
Vico Constructor.
Computational tools for monitoring and management are very important for the urban
development. Several urban systems, such as: transports, water and sewerage system,
telecommunications and electric system, make use of these tools, controlling the processes
related to each activity, as well as urban problems, as the pollution.
5
Methods and Techniques in Urban Engineering
60
Therefore, in this chapter we will present details about these technologies, its programs and
applications, what it will serve as introduction for the other works to take part in this book,
many of which use such computational tools for study and solution of urban problems.
2. CAD (Computer-Aided Design)
It is a technology largely used in the conception of projects of Engineering and Architecture.
It consists of a software directed to the technical drawing, with several computational tools.
Amongst the areas in which the CAD is applied, we have the Urban Engineering.
Urban Engineering studies the problems of urban environments, emphasising the creation
of planned environments to be sustainable, considering the balance of economic, territorial,
and social factors. The infrastructure urban systems are subject of study, searching to
optimise the planning of the environment, sanitation sectors, transports, urbanism, etc. In
this context, we can observed the use of CAD programs to assist urban projects.
In respect of development of CAD software, we observe that without the postulates of the
Euclidean Mathematics (350 B.C.) it would not be possible to create this computational tool.
Thousand of years later, more specifically at the beginning of the 60
th
decade of the 20
th
century, Ivan Sutherland developed, as thesis of PhD in the Massachusetts Institute of
Technology (MIT), an innovative system of graphical edition called “Sketchpad”. In this
system, the interaction of the user with the computer was perform by “Light pen”, a kind of
pen that was used directly in the screen to carry through the drawing, together with a box of
command buttons. It was possible to create and to edit 2D objects. Such system was a
landmark in computer science and graphical modelling, considered the first CAD software.
In the beginning, the use of CAD software was restricted to companies of the aerospace
sector and automobile assembly plants, as General Motors, due to the high cost of the
computers demanded for the systems. Such software were not freely commercialised in the
market. The Laboratory of Mathematics of MIT, currently called Department of Computer
Science, was responsible for the main research and development of CAD software. In other
places, as Europe, this type of activity was started. Other prominence developers were:
Lockheed, with CADAM system, and McDonnell-Douglas, with CADD system.
From the 70
th
decade, CAD software had passed to be freely commercialised. The first 3D
CAD software, CATIA - Computer Aided Three Dimensional Interactive Application, was
developed in 1977 by French company Avions Marcel Dassault, that bought the Lockheed,
revolutionising the market. The investments, as well as the profits, vertiginously grown. In
the end of the decade, programs for solid modelling already existed, as, for example, the
SynthaVision of the Mathematics Application Group, Inc. (MAGI).
From 1980, with the development of the first Personal Computer (PC), by IBM, the
Autodesk released, in November 1982, the first program of CAD for PCs, the “AutoCAD
Release 1”. In 1985, the Avions Marcel Dassault released the second version of CATIA. In
this same decade, the workstations (microcomputers of great efficiency and high cost,
destined to technical applications) were developed, using the operational system UNIX.
In the 90
th
decade, specifically in 1995, the SolidWorks company released the SolidWorks 95
3D CAD, revolutionising the market for used the operational system Windows NT, while
the majority of the programs developed was destined to UNIX. In consequence of this,
SolidWorks 95 demonstrated to be a software with good relation of cost-benefit, when
compared with the competitors, excessively expensive.
Computational Tools applied to Urban Engineering
61
In the following years to present time, the technology comes being improved and the
software became very accessible around the world, with open access versions (freeware).
An important application of the 3D CAD programs is the creation of virtual environment,
also known as electronic or virtual scale models (Fig. 1). Such application is largely used in
architecture projects.
Fig. 1. Example of virtual scale model:
Hospital Metropolitano Norte
, Pernambuco, Brazil
()
2.1 Working with CAD
As previously said, we had a great development of CAD software in the last decades.
Amongst the main programs of CAD, the AutoCAD () is
distinguished. The software developed by Autodesk had its first version released in 1982,
and recently, the Autodesk released the AutoCAD 2010.
The AutoCAD (Fig. 2) is a 2D and 3D modelling program with several applications, such as:
mechanical, civil, electric, and urban engineering projects; architecture; industrial
manufacture; and HVAC (heating, ventilation and air conditioning). It is important to notice
that the AutoCAD is also largely used as tool in academic disciplines of technical drawing.
Fig. 2. Interface of AutoCAD software
Methods and Techniques in Urban Engineering
62
AutoCAD have commands inserted by keyboard, making possible a practical creation of
entities (elements of the drawing), at the moment of the conception of the desired model,
optimising the work of the designer. Such commands substitute the necessity of navigation
with the mouse to manipulate the toolbars.
The program generates diverse types of archive, which can be exported to other programs.
Some examples: DWG (*.dwg); 3D DWF (*.dwf); Metafile (*wmf); Encapsulated (*.eps); and
Bitmap (*.bmp). DWG archive is an extension shared for several CAD programs. AutoCAD
is capable to import archives of the type 3D Studio (*.3ds), from Autodesk 3D Studio Max.
User of AutoCAD is able to associate with your projects, programs made by programming
languages, such as: Visual Basic for Applications (VBA), Visual LISP e ObjectARX.
Another CAD software largely known is the SolidWorks ().
Developed by SolidWorks company, from group Dassault Systèmes, is a 3D CAD program
for solid modelling, generally used in the project of mechanical sets (Fig. 3).
Fig. 3. Project in SolidWorks ()
SolidWorks can also be used as CAE software (Computer-Aided Engineering), with
simulation programs, such as: SolidWorks Simulation, and SolidWorks Flow Simulation.
SolidWorks Simulation is an important tool of analysis of tensions in projects. The program
uses finite element methods (FEM), using virtual application of forces on the part.
SolidWorks Flow Simulation is a program of analysis of draining, based on the numerical
method of the finite volumes. This program allows the professional to get reasonable
performance in analysis of the project under real conditions.
SolidWorks is compatible with DWG files generated by AutoCAD, being able to modify 2D
data or to convert into 3D data.
Other interesting CAD programs include: CATIA (Computer-Aided Three-dimensional
Interactive Application), developed by Dassault Systèmes and commercialised by IBM
(), and Pro/ENGINEER, developed by Parametric Technology
Corporation ().
Computational Tools applied to Urban Engineering
63
2.2 Application of CAD
CAD software have as main use the aid in projects of Civil Engineering and Architecture for
urban environment, such as: buildings, roads, bridges, etc (Fig. 4).
CAD also is widely used in the project of transmission lines of electric energy. Such practice
consists in optimise the allocation of transmission towers and wires, in accordance with the
technical norms. An important characteristic is the topography of the land.
Fig. 4. Example of project of Civil Engineering - a highway ()
Other applications in Urban Engineering include: the maintenance and update of sanitary
networks, and the environmental recovery in urban areas. In the first case, CAD is used to
update the database of the sewer network of the city, supplying detailed information. In the
second case, CAD is used for mapping of a region, with the aid of a GPS system (Global
Positioning System), identifying environmental delimitation (sources of rivers, roads,
buildings, etc)(Mondardo et al., 2009).
There are several other applications of CAD in urban systems and areas related to Urban
Engineering, and it is important to note, in practical terms, that CAD is nearly always
associate to other technology: GIS (Geographic Information System), that it will be seen to
follow.
3. GIS (Geographic Information System)
Engineering problems were on the last 40 years gradually directed to employ computerised
solving techniques. Precision and increasing speed for calculating multi-variable operations
are a good reason to use computational resources, but the quite unlimited possibilities to
organize, simulate and compare data turned computer sciences on a strong allied for
research and design activities.
The final claim to say that now we are living in an information systems age is the large
accessibility of hardware and software, the diffusion of personal systems and all related
facilities: servers, networks, telecommunications, etc.
An information system can be defined as an organised quiver of tools and data that can be
used to answer on a systematic way questions structured by specialists. As these questions
can be classified in patterns, it should be possible to build on artificial intelligence to make
the system learn and deliberate by itself.
Methods and Techniques in Urban Engineering
64
If the answer to a problem employs variables associated to geographic information, it’s
recommended the use a dataset structure to implement and model graphic objects that
represents all on earth, natural or artificial. A Geographic Information System (GIS) is a set
of tools that work with data presenting three basic concepts (Fig. 5): Geodatabase,
Geovisualization and Geoprocessing (Harlow, 2005).
Fig. 5. Schema extracted from ArcGIS Reference manual showing the three views of GIS
Geodatabase represents the set of spatial data that can be expressed by rasters, vector
features, networks, etc., and every rule to control their creation and management.
Geovisualization is an action performed on spatial data by intelligent maps and views, from
which we can view the database for querying, analysing and editing. Geoprocessing is the
term used to designate operations on datasets that obtain outputs of analyses and generate
new information.
Some engineering projects have territorial themes as industrial projects, social benefits,
general infrastructure, logistics, demography, and other geo/urban/environmental aspects.
On those cases the solution involves studying geographic elements and their available
information, in order to perform technical analyses. So an information system for
geographic data organisation, visualisation and processing will be appropriate to those
problem solving. To be efficient as a GIS, the system must perform some general tasks:
acquire, convert, organise and project the geographic elements; import, organise and extract
imagery, numeric and textual information; process geographic elements and information
with data integrity and operational efficiency; display appropriately the data and related
operations (geoprocess techniques); perform simulations and comparison of alternatives;
present support for program language and custom computational routines; generate new
data based on selected results; publish maps and all sort of documents for project
discussion; and permit data interchange with other systems.
As we can observe, GIS is designed to manage spatial data, and the geographic
representation of this data can use many types of elements for plotting the information (Fig.
Computational Tools applied to Urban Engineering
65
6): vector based features classes, as points, lines and polygons; raster datasets, as digital
elevation models and imagery; networks, as roadways, pipelines, hydrology and other
interlaced elements; survey measurements, as topographic annotation; and other kind of
information, as postal codes, address, geographic place names, etc.
Fig. 6. Vector features overlays raster satellite image
These elements can be organised by layers, and could be selected by pointing or grouping
for edition tasks or custom display. The selection methods could also be performed from
spatial analyses or statistic classification. Georeferenced co-ordinates and related data tables
of GIS elements help to improve these tasks.
Geographic data representation has integrity rules (Harlow, 2005), performed by spatial
relationship patterns between elements, as topologies and networks. Topologies are used to
manage boundaries behaviour, to apply data integrity rules, to define adjacency and
connectivity properties, to structure creation and edition of new geometry, and to express
other topological operations. They are used to represent area contours, parcels,
administrative boundaries, etc. Networks are used to represent graphs and their
connections, controlling paths, barriers and flows. They are used to represent behaviour of
pipeline, transportation, traffic, etc.
Although organisation and management of spatial data can be well attempted with modern
GIS programs, there is until an important aspect: how to deal with data quality. The
cartographic databases can be generated from old charts or maps digitalisation, or from
satellite and aerial imagery treatment. The numeric and textual databases must be converted
into tables, and quite often comes from census and researches output. A great variability of
data procedures can be observed world-wide when integrating data obtained from different
fonts, places and scales. The periodicity of data actualisation is another deal to GIS users.
The problems don’t result ever from confidence, trusted fonts may have different
methodological approaches, and personal interpretation can also give different valid
outputs. Professional development of GIS operators can help them to detect, evaluate and
work that variability, and a methodological approach is needed to treat it suitable to each
research task.
Methods and Techniques in Urban Engineering
66
3.1 Working with GIS
Many users can be satisfied on using GIS as a dataset management tool for generating maps
and classify data, but nowadays GIS is turning on a knowledge approach, where models
incorporate advanced behaviour and integrity rules. The ultimate development on GIS
procedures is directed to intelligent use of geoprocessing for built, explore and share the
possibilities of geographic information. Users now are able to structure schemas and
workflow models in order to improve their geoprocessing tasks, as import, check, integrate
and compose data (Fig. 7).
Fig. 7. Example of a workflow model for GIS based research on industrial location
As GIS is the best way to work data from local to global level, an efficient DBMS (Data Base
Management System) is needed to perform data integration, actualisation, access and
sharing. As result, GIS catalogue portals based on Web nodes are increasing in number and
their interoperability is part of a concept called SDI (Spatial Data Infrastructure). Servers are
used to host enterprise GIS and their databases, and to provide multi-user access.
Geographic Databases are employed to control and develop published data, as maps,
features and tables. They are known as Geodatabase, have a proper logic to work with
datasets by applications and tools, and perform access and management tasks.
But GIS capabilities can also provide single users to customise their data. A Personal
Geodatabase (PGDB) is an example of option to collect and organise features and tables
attempting to user needs, using desktop computers at low cost and with feasible results. If
you are a adviser or researcher and are in charge of studying urban problems, you can go
ahead on mounting your PGDB, however some steps must be observed.
The start point is to structure correctly your problem, identifying the factors and conditions
that impacts on, a methodological approach to face it, and a technical procedure to get
alternatives and produce results.
First, you must study what kind of information you need, identify the sources and think
about layer and features organisation. Next, you must acquire geographic data from GIS
portals or institutional sources. Many research and administrative institutions provide
download of vector and raster data from their DBMS, or send it by request. If there is no
available geographic data, it will be necessary to digitalis existing map and imagery, but for
Computational Tools applied to Urban Engineering
67
this task is recommended a professional with advanced knowledge of geodesics,
cartography and geoprocessing.
After getting the appropriate geographic information is important to know that vector data
is usually related to a table, which has a column whose contents link the graphic
representation to a register. Raster image has pixel position attached to a co-ordinate value.
Vector features as point, line or polygon has as code number for the system link
requirements, but can also have a code for geographic cadastral purposes (Fig. 8). Geocode
is a tendency on GIS procedures and has the advantage to make easy later joins and relates
of table data with none geographic plot.
Fig. 8. Vector features as point, line and polygon with associated table containing geocode
In other words: if you get a basic data of shapes with related table presenting geocode
column you can aggregate new data from other ordinary tables that has also this geocode
column. GIS also enables visualisation of each element by selecting it from geocode, and
permits editing the tables to insert new columns containing yours own information.
Second, you must organise your features and tables in a dataset, defining co-ordinate
systems and importing independent features and tables to the PGDB. This modality of data
organisation provides more security and flexibility, increasing edition and analysis tasks.
Working with stand alone features can face restrictions that are not present on a PGDB
structure, as it works more properly with layers, overlays, projections and co-ordinates.
Third, you must know what to do to improve your queries on GIS ambience. It is a lost of
potential to use a GIS only for data visualisation or map creation, there is more than this.
Both DBMS or PGDB can generate data performing spatial analysis or statistic classification.
As you have the demands of your research well structured, GIS can help you to answer by
crossing multi-layer information, selecting and editing data from SQL (Structured Query
Methods and Techniques in Urban Engineering
68
Language) statements and processing new features containing partial and conclusive
results.
Finally, you must obtain a valid output for your problem solving, and communicate it to
others on a suitable way. GIS can help you on producing thematic maps, analytical graphs
and technical reports. You can also get community, representatives and specialists to work
in a participative mode using GIS to generate and validate output of decision sessions. Some
people have difficulties to identify and interpret geographic elements, and GIS can highlight
and detach text and visual information for making it easier.
3.2 Application of GIS
GIS technology is much used in Urban Engineering to analyse, in a detailed way,
characteristics related to urban planning. In addition to CAD, GIS presents solutions for
several problems, and it is applied, in a integrated way, in projects of Civil Engineering and
Architecture, including the most diverse urban systems (Fig. 9), making possible the
maintenance and update of service networks, as well as the environmental recovery in
urban areas.
Fig. 9. Use of GIS in the mapping of water and sewer ducts ()
Nowadays, the accessibility of GIS technology stimulates educators to work in a new
concept, called Geographical Inclusion, which can be performed on basic education class in
order to provide young students with geographic visualisation and interpretative
capabilities. We are living a age of saving resources, environmental care and sustainable
actions, and GIS with his solving problem design and participative net work potential is the
most strong partner in managing data for this purposes.
Concluding the technologies presented in this chapter, we will see to follow the BIM
technology (Building Information Modelling), that it represents, in a certain way, an
evolution of CAD technology, previously presented.
Computational Tools applied to Urban Engineering
69
4. BIM (Building Information Modelling)
It is a technology that consists in the integration of all types of information related to
conception and execution of a project of Civil Engineering. Such information, stored in
efficient database, not say respect only to design or to modelling of plants and virtual
environments, but also to management of execution time of project, geographic information,
quantification of material used in all building, detailing of the constructive processes,
sustainability, etc. In short, the technology makes possible that the work team has an
integrated vision of the project. This allows, for example, that engineers and architects
idealise and execute the project sharing the same base of information. This technology has
been spread together with the practice of Urban Engineering.
In a certain way, BIM is seen as an evolution of 3D CAD techniques. In fact, this technology
is defined as 4D CAD, where the fourth dimension is not physical, but the set of information
that go beyond the engineering concepts, used in the development of the project.
The use of BIM can mean an effective optimisation of time and increase of the productivity
levels. Other important characteristic is the easiness to perform modifications in the project,
in any phase of execution. BIM makes possible the meeting of information, such as: the
documentation of licensing for building, the established environmental conditions, and
other legal aspects that are of extreme importance for execution of the project. Thus, the
technology allows to greater efficiency in the taking of decisions during the elaboration of
the project, easiness in the emission of building documents, establishment of deadlines,
estimate of costs, information about the analysis of risks and management of the operational
conditions of the installations.
Using a CAD software in an engineering project, the designer inserts detailed specifications
through the headings, for example: specification of the material used in the confection of a
wall, manufacturer of the material, necessary amount. In the case of BIM technology, such
information is directly inserted in the drawing at the moment of the modelling.
4.1 Working with BIM
In BIM technology, a set of tools provided by one or more software is used for: modelling of
surfaces; modelling and structural calculation; management of the building; manufacture
management; environmental analysis; estimate of costs; and specification.
Autodesk Revit Architecture (usa.autodesk.com)(Fig. 10), is one of the main BIM software,
having: tools of 2D and 3D drawing; co-ordinated database, in such way that alterations
performed in the information are automatically update in all model, reducing the possibility
of errors and/or omissions; associative sections of divisions table; libraries of details, that
can be created and be adapted to the patterns of the project team; parametric components,
that function as an open graphical system for design concern and shape creation; inventory
of materials, that allows the calculation of detailed amounts of material, updating while the
project evolves, on the basis of parametric alterations; etc.
There are other BIM programs by Autodesk, as Autodesk Navisworks (usa.autodesk.com),
that it does not present tools of environment modelling, being destined to the revision of 3D
projects or visualisation of models, that is the case of the freeware NavisWorks Freedom.
The main tools include: aggregation of files and 3D data; revision tools; creation of 4D table;
object animation; management of interference and detention/correction of conflicts in the
project; exportation of DWF files (used in CAD programs); and navigation in real time.
Methods and Techniques in Urban Engineering
70
Fig. 10. Interface of Autodesk Revit Architecture ()
Other popular freeware is the Google SketchUp ()(Fig. 11),
much used in the academic area, presenting modelling by means of surfaces. Such software
presents limitations compared to the programs already cited. SketchUp works efficiently
with information related to the localisation, size and design, reason for which is used in the
confection of models that can be exported to programs, as for example, the Autodesk
NavisWorks Review.
Fig. 11. Interface of Google SketchUp ()
There are several other programs related to BIM technology, as for example, Vico
Constructor (), presenting diverse characteristics and
resources, such as: the structural analysis of the building; the constant update of the
information, correcting possible errors of execution; the estimate of costs of the enterprise;
etc.
Computational Tools applied to Urban Engineering
71
4.2 Application of BIM
As well as CAD and GIS technologies, BIM presents a series of applications in the area of
Urban Engineering, and currently it comes substituting CAD, in a effective way, because it
presents advantages in relation to the management of the projects.
A current example of BIM application is the National Centre of Swimming of Pequim, China
(en.beijing2008.cn/46/39/WaterCube.shtml). Seat of the competitions of swimming during
the Olympic Games of 2008, known as Water Cube, the place have a useful area of 90,000
m², five Olympic swimming pools and capacity for 17,000 spectators, and BIM was used in
all phases of the project (Fig. 12 and 13).
Fig. 12 and 13. Assembly of the structure of the Water Cube, and aerial photo of the place
()
Other example of BIM application is the International Airport Maynard Holbrook Jackson
Jr., Atlanta, United States (Fig. 14). This airport is in construction phase with a stipulated
deadline for 2011. In this project, of great magnitude, BIM is extremely necessary in the
optimisation of execution time, since the old airport of Atlanta is overloaded. The estimated
cost of the enterprise is approximately US$ 1.4 billion (Ford, 2009).
Fig. 14. Model of the Airport ()
Methods and Techniques in Urban Engineering
72
5. Conclusion
This chapter looked for to present the main details on three technologies much used in
Urban Engineering: CAD (Computer-Aided Design); GIS (Geographic Information System);
and BIM (Building Information Modelling). As it can be seen, each one of them presents
specific characteristics and with diverse applications in urban projects, providing better
results in relation to the planning, management and maintenance of the systems.
In relation to presented software, it is important to note that the authors do not have any
connections with the cited companies. The programs were shown only as computational
tools that use the presented technologies, and there are many other commercial software
and freeware that can be used in works involving CAD, GIS or BIM. Therefore, the work
presented here does not represent any intention of marketing for no one of cited software
and/or companies.
6. References
Autodesk (2006). Orange County Sanitation District – Customer Success Story.
Autodesk
Infrastructure Solutions
Autodesk (2009). Langan Engineering & Environmental Services – Customer Success Story.
Autodesk Infrastructure Solutions
Ford, K. (2009). Maynard Holbrook Jackson Jr. International Terminal.
Holder Construction
Group LLC
, Georgia Tech
Harlow, M. (2005).
ArcGIS Reference Documentation
. ESRI: Environmental Systems
Research Institute Inc., Redlands
Kymmell, W. (2008).
Building Information Modelling – Planning and Managing
Construction Projects with 4D CAD and Simulations
. The McGraw-Hill
Companies, Inc
Mondardo, D., Bellon, P. P., Santos, L. B., Meinerz, C. C. & Haoui, A. F. (2009). Proposta de
Recuperação Ambiental na Área Urbana da Microbacia do Rio Ouro Monte.
2nd
International Workshop – Advances in Cleaner Production
, São Paulo, Brazil
Sutherland, I. E. (2003).
Sketchpad: A man-machine graphical comunication system
.
Technical Report 574. University of Cambridge, Computer Laboratory, p. 20
Accessed in August 13, 2009
Accessed in December 04, 2009
Accessed in December 04, 2009
Accessed in December 04, 2009
Accessed in December 01, 2009
Accessed in November 27, 2009
Accessed in August 24, 2009
Accessed in August 21, 2009
Accessed December 03, 2009
Accessed in August 22, 2009
Accessed in August 14, 2009
Accessed in August 24, 2009
Accessed in August 22, 2009
Accessed in December 03, 2009