Báo cáo hóa học: " Research Article Pitch Ranking, Melody Contour and Instrument Recognition Tests Using Two Semitone Frequency Maps for Nucleus Cochlear Implants" doc
Bạn đang xem bản rút gọn của tài liệu. Xem và tải ngay bản đầy đủ của tài liệu tại đây (4.41 MB, 16 trang )
Hindawi Publishing Corporation
EURASIP Journal on Audio, Speech, and Music Processing
Volume 2010, Article ID 948565, 16 pages
doi:10.1155/2010/948565
Research Ar ticle
Pitch Ranking, Melody Contour and Instrument
Recognition Tests Using Two Semitone Frequency Maps for
Nucleus Cochlear Implants
Sherif A. Omran,
1, 2
Waikong L ai,
1
and Norbert Dillier
1
1
ENT Department, University Hospital Zurich, Frauenklinikstrasse 24, 8091 Zurich, Switzerland
2
Institute of Neuroinformatics, University of Zurich, Winterthurerstrasse 190, 8057 Zurich, Switzerland
Correspondence should be addressed to Sherif A. Omran,
Received 12 August 2010; Accepted 21 November 2010
Academic Editor: Elmar N
¨
oth
Copyright © 2010 Sherif A. Omran et al. This is an open access article distributed under the Creative Commons Attribution
License, which permits unrestricted use, distribution, and reproduction in any medium, provided the original work is properly
cited.
To overcome harmonic structure distortions of complex tones in the low frequency range due to the frequency to electrode
mapping function used in Nucleus cochlear implants, two modified frequency maps based on a semitone frequency scale (Smt-
MF and Smt-LF) were implemented and evaluated. The semitone maps were compared against standard mapping in three
psychoacoustic experiments with the three mappings; pitch ranking, melody contour identification (MCI) and instrument
recognition. In the pitch ranking test, two tones were presented to normal hearing (NH) subjects. The MCI test presented different
acoustic patterns to NH and CI recipients to identify the patterns. In the instrument recognition (IR) test, a musical piece was
played by eight instruments which subjects had to identify. Pitch ranking results showed improvements with semitone mapping
over Std mapping. This was reflected in the MCI results with both NH subjects and CI recipients. Smt-LF sounded unnaturally
high-pitched due to frequency transposition. Clarinet recognition was significantly enhanced with Smt-MF but the average IR
decreased. Pitch ranking and MCI showed improvements with semitone mapping over Std mapping. However, the frequency
limits of Smt-LF and Smt-MF produced difficulties when partials were filtered out due to the frequency limits. Although Smt-
LF provided better pitch ranking and MCI, the perceived sounds were much higher in pitch and some CI recipients disliked it.
Smt-MF maps the tones closer to their natural characteristic frequencies and probably sounded more natural than Smt-LF.
1. Introduction
Many postlingual recipients of cochlear implants (CIs)
who achieve good speech recognition with their devices
report that music is not well perceived. Music consists of
complex acoustic sounds composed of tones with harmon-
ically related overtones. Most musical instruments generate
fundamental frequencies below 1 kHz [1] which points to the
importance of preserving low frequency sound components
for music perception. In a companion paper, two semi-
tone (Smt) frequency mappings were proposed to improve
melody representation with CI patients [2]. Smt mapping
essentially involves assigning the fundamental frequencies
of adjacent tones on the musical scale to corresponding
adjacent electrodes or channels. This also requires that
the frequency to electrode/channel mapping is based on a
semitone scale. The idea was initially investigated in a study
by [3], using the 12 electrode Clarion CII (Advance Bionics)
implant with a limited range of semitone frequencies. The
Smt mappings investigated in this study, Smt-LF and Smt-
MF, cover the frequency ranges from 130 to 1502 Hz and
from 440 to 5009Hz, respectively. Smt mappings preserve the
representation of harmonic structure of musical tones for the
CI. This may help to improve music appreciation.
Psychoacoustic tests can be carried out to evaluate
various dimensions of music perception such as pitch,
melody, and timbre. Frequency representation, loudness,
and temporal resolution are important characteristics that
affect music perception. To examine music perception with
Smt mapping in this study, three psychoacoustic tests (pitch
ranking, melody contour identification (MCI) [4], and
instrument recognition (IR)) were conducted with the three
2 EURASIP Journal on Audio, Speech, and Music Processing
experimental conditions (Standard (Std) ACE (advanced
combination encoders), Smt-LF, and Smt-MF mappings).
Pitch ranking and MCI tests were carried out with normal
hearing (NH) subjects listening to noise band vocoded
representations of the test sounds while MCI and IR tests
were carried out with CI recipients.
An improved representation of the harmonic structure
through Smt mapping against the Std mapping is expected
to also yield better preservation of partials in individual tones
on the musical scale, particularly towards higher frequencies.
However, the harmonic relationship of low frequencies is
expected to be preserved more than Std mapping. Pitch
ranking was employed to determine whether Smt mapping
produces the expected improvement in resolution over Std
mapping. The test involved synthetic complex tones with
a harmonic structure, similar to musical tones, rather than
signals that only excite single electrodes. This test was mainly
intended to check whether Smt mapping is viable, and it was
decided that conducting these tests with NH subjects only
would help expedite the testing. Testing with NH subjects
requires that the processed signals of Std or either Smt
mappings, originally meant for presentation to CI recipients,
be made audible. This was achieved by additional processing
of these CI signals with an acoustic model (AMO) which
resynthesizes and simulates the sound of a CI [5]. The AMO
outputs are then presented to the NH subjects.
Melody is an important aspect of music [6]whichcan
be described as a group of tones perceived as a single
entity [7]. Each tone has a harmonic structure of overtones,
and preserving this structure (as with Smt mapping) may
improve melody perception. The Pitch Ranking test above
involving only single tones yields little direct informa-
tion about melody perception. A more complex task that
would reflect melody perception would necessarily involve
a sequence of tones. Galvin et al. [4] provided a very good
overview of the shortcomings of many existing tests that
attempt to measure melody perception. The MCI test [4]
which they developed was chosen for this study. The MCI
test was carried out with the three mapping conditions, first
with NH subjects and then with CI recipients.
Timbre (tone color) is another aspect of music, by which
different instruments are characterized [8]. Timbre depends
on the relationship between intensities of different partials as
well as the presentation of the temporal fine structure. In the
IR test, sounds from different musical instruments encoded
using the different mappings were presented to the subjects.
The experimental task was to identify the instrument by
which the sounds were played. As the mappings in this study
do not explicitly present any fine structure information,
this test investigates whether the expected improvement in
representation of the harmonic structure using Smt mapping
would be beneficial for timbre recognition. This test was only
conducted with CI recipients.
2. Hypotheses
(i) The discriminability of two complex tones separated
by only a few semitones will improve with Smt
mapping compared with Std mapping due to better
preservation of the harmonic structure.
(ii) Smt mapping will yield higher MCI scores than
Std mapping. Ambiguities may occur with Smt-
MF mapping at low frequencies due to filtering out
partials below 440 Hz, and the performance may
decrease with Smt-LF mapping because frequencies
are transposed to higher ranges.
(iii) Improving frequency representation with Smt map-
ping may improve instrument recognition compared
to the Std mapping.
3. Methods and Procedures
One way to improve melody representation would be to
ensure that the fundamental frequencies of individual tones
on the musical scale are assigned to separate electrodes. Such
an approach involves mapping fundamental frequencies of
musical tones to electrodes based on a semitone scale. In this
study, two different Smt mapping ranges were investigated.
The first one, Smt-LF, is restricted to the low and mid
frequency range (130–1502 Hz) using a buffer of 512 points
which is zero padded before undergoing a 2048-point fast
Fourier Transform (FFT). Smt-LF yields a resolution of
7.8 Hz for frequencies below 1054 Hz, and 31.25 Hz for
higher frequencies. The second mapping, Smt-MF, considers
frequencies in the mid and high frequency range (440–
5009 Hz) and involves a 512-point FFT, giving a resolution
of 31.25 Hz. The Std mapping uses a 128-point FFT with
a resolution of 125 Hz. All three mappings use overlapping
data buffers, the amount of overlap depending on the
stimulation rate such that at the end of each stimulation
period, as much new data (sampled at 16 kHz) as possible is
added to the data buffer. Details of the algorithms are given
in a companion paper [2].
3.1. Experiment 1: Pitch Ranking. The pitch ranking test
was intended to examine whether the Smt mappings would
produce better resolution of complex tones compared to the
Std mapping. This test was conducted with NH subjects and
involved using the AMO to process the test signals with Std,
Smt-MF, and Smt-LF mappings before being presented to
the subjects. The AMO, which is described in greater detail
in a companion paper [2] also employed modules from the
Nucleus Matlab Toolbox (NMT) from Cochlear Corporation
[9].
The signals used for the test were synthetic complex
tones which had the same fundamental frequencies as
corresponding musical tones. Each tone had four harmonic
overtones with successive 20% decrease in amplitude. To
avoid envelope cues, all tones were designed to have the
same temporal envelope, namely duration of 500 msec
including 30 msec fading in/out at the beginning and the
end, respectively. However, there are still periodicity cues in
the temporal domain. The root mean square (RMS) energy
of the signals (in digital form: WAV file format) was set
to
−15 dB, where 0 dB corresponded to the RMS signal
EURASIP Journal on Audio, Speech, and Music Processing 3
Rise Rise flat
Rise fall
Flat rise Flat
Flat fall
Fall rise Fall flat
Fall
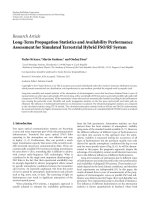
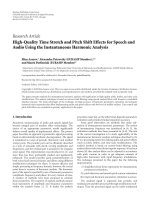
Figure 1: The nine different melody contour patterns used in the
MCI test with NH subjects. The root notes are indicated with gray
filling.
energy of the maximum peak-to-peak waveform, to prevent
saturation effects.
Subjects were presented with two synthetic complex
tones processed by the AMO at a time and were asked to
indicate the one higher in pitch. Each presentation consisted
of a probe and a reference tone. The fundamental frequency
of the probe was higher than that of the reference by 1, 3, or 6
semitones. Two reference tones D and G# in octaves 3, 4, and
5 were used and the full set of tone pairs tested is summarized
in Ta b l e 1.
The above signals were processed by the AMO with the
Std, Smt-MF and Smt-LF, mappings before being presented
via loudspeaker to the NH subjects. For this test, the AMO
was set to simulate CI stimuli that had a stimulation width
(spread of excitation) of 1 mm [5, 10]. The AMO also
incorporated virtual channels, produced by stimulating two
adjacent electrodes simultaneously with the same current
level, which had been found to result in intermediate pitch
percepts [11] compared to either of the corresponding
single electrode stimuli. Virtual channels increase the total
number of channels from 22 (for the Nucleus implant) to
a total of 43 channels, thereby also increasing the frequency
representation.
In each presentation, the reference and probe tones were
presented in random order, separated by a gap of 500 ms
between each tone. A single test session involved presenting
each of the 18 tone pairs, summarized in Ta b l e 1 ,atotal
of 4 times. The tone pairs were presented from a calibrated
loudspeaker (Genelec 1029A) at 65 dB(A) located 1.5 m in
front of the subject. The loudness of each tone was roved by
±6 dB to minimize the effects of loudness cues on the pitch-
ranking task.
Initially, the original unprocessed tones were presented
and tested to familiarize the subjects with the task. For this
condition, the test was conducted once, that is, each tone
pair was repeated a total of 4 times. Testing the unprocessed
tones also served to establish that the test material was not
too difficult to begin with. Thereafter, testing proceeded
with the AMO outputs for the Std, Smt-MF, and Smt-
LF mappings. The order of testing of the three mappings
was randomized. For each mapping condition, a training
session with correct/wrong feedback was first carried out.
Two test sessions without feedback were then carried out,
and the results from these two sessions were collected for
the final results. Thus, the results consisted of a total of 8
presentations of each tone pair for each subject. A total of
8 NH subjects were evaluated for this test. A custom test
software (MACarena) [12] was used to playback sound files
and record the responses.
3.2. Experiment 2: Melody Contour Identification. Melody
contour identification (MCI) is a test originally designed
and proposed by [4]. In the MCI test, subjects were
presented with a sequence of tones and had to identify the
corresponding contour pattern. For each contour pattern,
the lowest note was regarded to be the root note, which
was kept the same for all nine patterns (rise, rise-flat, rise-
fall, flat-rise, flat, flat-fall, fall-rise, fall-flat, fall) as shown in
Figure 1.
Each pattern consisted of a sequence of five synthetic
complex tones. For this study, each tone in turn consisted of
five harmonic partials. The fundamental frequency of each
synthetic complex tone was the same as its corresponding
musical tone. The amplitude of each partial was reduced
successively by 20% compared to the previous one. To
avoid envelope cues, all tones were designed to have similar
temporal envelope structure, and the RMS energy of each
pattern was normalized to
−15 dB, where 0 dB corresponded
to the RMS signal energy of the waveform with maximum
amplitude. However, there are still periodicity cues in the
temporal domain. Each tone in the pattern had a duration
of 250 ms with a 50 msec pause in between tones. Tones were
faded in/out with a 10 ms Hanning window at the beginning
and the end, respectively. A root note of “A” was used for all
the contour patterns, the same as was used by [4].
The MCI test was carried out first with NH subjects. The
interval size was varied between 1 and 5 semitones in octave
3, between 1 and 3 semitones in octave 4, and between 1 and
2 semitones in octave 5, as summarized in Ta b l e 2.
For NH subjects, the different patterns were processed by
the AMO with the Std, Smt-LF, and Smt-MF mappings using
a 1 mm stimulation width and 22 channels. The patterns
were presented at a level of 65 dB(A) at a distance of 1.5 m
in front of a calibrated loud speaker (Genelec 1029A). Test
subjects responded via a touch screen by indicating the
corresponding button containing the graphic display of the
corresponding MCI pattern as shown in Figure 1.Atthestart
of a test, the subjects were allowed to first familiarize them-
selves with the MCI contours in a condition expected to be
easy: for instance, octave 4 with 3 semitone intervals. In this
testing phase, pressing a button on the touch screen would
present the corresponding sound over the loudspeaker. After
they had heard each pattern at least once, a training session
with correct/wrong response feedback was conducted. A
single test session involved presenting each of the 9 contour
patterns with each of the 10 interval-size/octave conditions
4 EURASIP Journal on Audio, Speech, and Music Processing
Table 1: The signals used in each presentation can be separated into three groups with different interval sizes, each consisting of 6 tone pairs
with two references D and G# in octaves 3, 4, and 5.
Groups
Semitone intervals
1 D3, D3# D4, D4# D5, D5# G3#, A3 G4#, A4 G5#, A5
3 D3, F3 D4, F4 D5, F5 G3#, B3 G4#, B4 G5#, B5
6 D3, G3# D4, G4# D5, G5# G3#, D4 G4#, D5 G5#, D6
Table 2: Summary of the semitone interval sizes between successive tones in the contour patterns as well as the octave ranges that were
investigated for NH subjects and CI recipients.
NH subjects CI recipients
Intervalsize1234 5 12 3
Octave 3 xxxx x xx x
Octave 4 xxx xx x
Octave 5 xx
once. After 1 training session (with feedback), 2 test sessions
(without feedback) were conducted. A total of 8 NH subjects
were evaluated for this part of the MCI test.
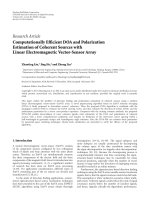
The nine patterns designed by Galvin et al. [4]were
utilized to test the NH subjects. However, the large number
of response choices proved to be too demanding for some CI
recipients in initial testing, and therefore, in order to simplify
the test, only five patterns were subsequently utilized to test
CI recipients as shown in Figure 2.
For the CI recipients, octaves 3 and 4 with interval
size from 1 to 3 semitones were tested. Testing in octave 5
was eliminated (see Ta b l e 2 ). This elimination was achieved
by studying NH responses, and it was found that tones
with one part being flat are likely to be misperceived with
Smt mapping in cases when the fundamental is filtered.
To simplify the test with CI subjects, all such tones were
eliminated. Conditions with one-semitone intervals were
processed with 22 channels and represent effectively a
resolution of two semitones. Another pitch ranking study
with NH using 22 and 43 channels showed no significant
differences. Therefore, it is assumed that results from CI
recipients with 22 channels are representative to those with
43 channels. Testing was done using the MACarena [12]
software which allowed randomized sound presentation and
automatic recording of subjects’ responses.
Testing with CI recipients involved stimuli being
streamed directly to the implant using the Nucleus Implant
Communicator (NIC) research software from Cochlear
Corporation [9]. Stimuli were first prepared offline using a
custom Matlab “Checker” program which implemented the
Std, Smt-LF, and Smt-MF mappings. The Std mapping is
the default implementation in the Nucleus Matlab Toolbox
(NMT) from Cochlear Corporation, whereas the Smt-LF and
Smt-MF mappings are custom implementations. Firstly, the
latest speech processor map for each CI recipient was loaded
from a clinical database. The WAV files for the different
MCI patterns were then loaded and processed for all three
mappings. For this test, the “Checker”programwasset
for 22-channel output, testing 43 channels with CIs was
eliminated due to technical constrains and time limitations
Rise
Rise fall
Flat
Fall rise
Fall
Figure 2: The five different melody contour patterns used in the
MCI test with CI recipients. The root notes are indicated with gray
filling.
of the project. The resulting output was ensured that the
stimuli were calibrated to correspond to an equivalent
acoustic level of 65 dB(A). The resulting output was a
sequence of parameters that when streamed to the CI would
produce a corresponding sequence of stimulation. To meet
safety requirements, the entire output sequence was verified
to ensure that none of the parameters exceeded the limits
set by the corresponding CI recipient’s individual speech
processor settings. Once the sequences had been verified,
the “Checker” program stored them offline as XML files.
During a test, the corresponding XML files for the selected
CI recipient were streamed to the L34 speech processor.
The MACarena test software had been provided with an
additional output option which allowed direct streaming
of CI stimulation sequences from XML files via the L34
speech processor. As with the NH subjects, a test began with
the CI recipient being familiarized with the MCI signals
in a higher octave (octave 4) and large interval size (3 or
4 semitones) (e.g., octave 4 with 3-semitone intervals) for
EURASIP Journal on Audio, Speech, and Music Processing 5
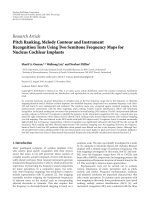
Brass Woodwind
Bowed string
Struck string
Trumpet Trombone Flute Clarinet Violin Cello Guitar Piano
Figure 3: The eight different instruments from four instrument families (Brass, Woodwind, Bowed Strings, and Struck Strings) used in the
instrument recognition test.
the three mappings used in order to avoid learning effect
which may influence the scores. This was then followed by a
training session with correct/wrong response feedback using
test signals. A single test session involved presenting each of
the 5 contour patterns with each of the 6 interval-size/octave
conditions twice. After one training session (with feedback),
two test sessions (without feedback) were conducted. A total
of 8 CI recipients were evaluated for this part of the MCI test.
All subjects had at least 1 year’s experience using a CI device.
All of them used the Nucleus Freedom CI24RE contour array
implant and Std mapping.
3.3. Experiment 3: Instrument Recognition. The first 8 bars
from the music piece “Vem kan segla f
¨
orutan wind?” (tra-
ditional Swedish folksong) played by professional musicians
on eight different instruments (Trumpet, Trombone, Flute,
Clarinet, Violin, Cello, Guitar, and Piano) were recorded and
used as the basis of the test material. Dividing each recording
into submelodies of 2 bars each then produced a total of 4
“pieces” per instrument. The instruments could be divided
into four families, namely Brass, Woodwind, Bowed Strings,
and Struck Strings, each consisting of two instruments (see
Figure 3). In the IR test, the listener was required to listen
and identify the instrument used to play the piece being
presented.
As with the MCI test, the signals were presented via
streaming to the CI recipients with the L34 speech processor.
The signals were preprocessed with the Matlab program
“Checker” for all three mappings (Std, Smt-MF, and Smt-LF),
using patient-specific settings of minimum and maximum
current levels per electrode retrieved from a clinical database.
The processed signals are first saved as XML files prior to
the test being conducted. The input signals to the Checker
were calibrated to correspond to an equivalent acoustic
(loudspeaker) mean level of 60 dB SPL.
CI recipients were seated in front of a touch screen
and an XML file was streamed to the L34 speech processor
from the MACarena test environment in combination with
NIC. The CI recipients had to select the instrument that
corresponded to the perceived sound from eight response
buttons corresponding to the eight instruments shown on
the touch screen display.
Before testing began, the CI recipients practiced with a
limited set of signals in familiarization and training sessions.
In a familiarization session, the CI recipient pressed a button
on the screen to listen to the corresponding sound. In a
training session, feedback was provided as to whether the
response was correct or wrong. If a response was wrong,
the correct response would be indicated on the screen, and
the same sounds could be repeatedly presented. The final
test involved presenting each of the 8 instruments a total of
4 times (corresponding to a single presentation of each of
the 4 submelodies) without feedback. 8 adult postlingual CI
recipients performed the test. All subjects had at least 1 year’s
experience using a CI device. All of them used the Nucleus
cochlear implant.
4. Results
4.1. Experiment 1: Pitch Ranking. The pitch ranking test
was conducted using tone pairs consisting of a probe and
a reference. Two references, D and G#, were used. Initially,
the test was carried out with unprocessed sounds and
NH subjects to establish that the tones could indeed be
distinguished in their original form. The results from this test
are shown in Figure 4 and confirm that the unprocessed tone
pairs are generally easy to rank correctly, yielding scores that
are significantly above chance. As expected, the scores also
tended to be lower with smaller interval sizes.
The results with sounds processed by the AMO for the
Std, Smt-MF, and Smt-LF mappings are summarized in
Figure 5. Scores in the pitch-ranking test were calculated
in percentage from 0% to 100%, biased to
−50% and
normalized to be between
±100. The negative side indicates
pitch reversals and
−100% is complete pitch reversal. With
the Std mapping (white filled bars), pitch ranking of tone
pairs separated by larger intervals was easier than that of tone
pairs with smaller intervals (e.g., the 6-semitones interval was
easier than the 3 and 1 semitone intervals). The score with 1-
semitone interval in octave 3 was close to chance level with
reference D but was higher with reference G#. This could
be due to the Std mapping compressing the input frequency
range, especially towards the lower frequencies. As a result,
the partials of tones at the lower end of the musical scale
are more likely to be compressed than those higher up on
the musical scale. This would cause tone pairs close to one
another to be more difficult to resolve.
Figure 5 also shows the results with Smt-MF (gray
bars) and Smt-LF (black bars) mappings. Smt-LF generally
performed significantly better in octaves 3 and 4 than Smt-
MF and Std, particularly with reference D and smaller
intervals. Smt-MF, apart from the pitch reversals observed,
also performed better than Std, especially at small (1-
semitone) intervals (octaves 3 and 5 with reference D). With
6 EURASIP Journal on Audio, Speech, and Music Processing
−100
−80
−60
−40
−20
0
20
40
60
80
100
Score
Octave 3 Octave 4 Octave 5
1Smt
3Smt
6Smt
Ref D-unprocessed tones condition
∗
∗∗ ∗
(a)
−100
−80
−60
−40
−20
0
20
40
60
80
100
Score
Octave 3 Octave 4 Octave 5
1Smt
3Smt
6Smt
Ref G#-unprocessed tones condition
∗∗
∗∗∗∗
(b)
Figure 4: Mean results for unprocessed tones with both references D (a) and G# (b) in octaves 3, 4, and 5 with 1, 3, and 6 semitone intervals
between the probe and reference tones. Pitch reversals, which would be indicated by negative scores, were not observed at all. Columns
marked with an asterisk are significantly above chance (P
= .05) according to the cumulative binomial distribution of mutually exclusive
events; at least 7/8 correct answers are considered significant. Chance level is indicated by the dashed line.
Octave 3
Octave 4
STD MF
STD MF
LF LF STD MF LF STD MF LF STD MF LF STD MF LF STD MF LF STD MF LF STDMF LF
Smt = 3
Smt = 6
Smt = 1 Smt = 3 Smt = 6 Smt = 1 Smt = 3 Smt = 6
Pitch ranking results-reference (D)
Octave 5
Smt = 1
−100
−80
−60
−40
−20
0
20
40
60
80
100
∗
∗
∗
∗∗
∗
∗
(a)
STD MF
Pitch ranking results-reference (G#)
Octave 3 Octave 4 Octave 5
STD MF
LF LF STD MF LF STD MF LF STD MF LF STD MF LF STD MF LF STD MF LF STD MF LF
Smt = 3
Smt = 6
Smt = 1
Smt = 3
Smt = 6
Smt = 1
Smt = 3 Smt = 6
Smt = 1
−100
−80
−60
−40
−20
0
20
40
60
80
100
∗∗
STD
Smt-MF
Smt-LF
(b)
Figure 5: Showing results with Std mapping (white), semitone mapping Smt-MF (gray), and semitone mapping Smt-LF (black) with
reference tones D (a) and G# (b) using semitone intervals (1, 3, and 6) in octaves range from 3 to 5. Chance level is indicated by the
dashed line. An asterisk between two columns indicates that the corresponding scores are significantly different (P
= .05) from one another
(t-test). When pitch reversals occur, which are indicated by negative scores, the significance test was calculated using the absolute values.
EURASIP Journal on Audio, Speech, and Music Processing 7
0
20
40
60
80
100
Mean score (%)
1234512312
Octave 3 Octave 4 Octave 5
Mean MCI scores-with NH
Semitones
∗
∗∗
∗
∗
∗
∗∗
∗∗
∗
∗
∗
∗
∗
∗
∗
∗
∗
STD
MF
LF
Figure 6: Results with standard mapping (white), semitone mapping Smt-MF (gray), and semitone mapping Smt-LF (black) for NH subjects
with AMO output. Three octave ranges (3, 4, and 5) were tested with different semitone intervals. Chance level is indicated by the dashed
line. An asterisk between two columns indicates that the corresponding scores are significantly different (P
= .05) from one another.
Reference G#, notwithstanding the pitch reversals with Smt-
MF, there were no significant differences observed between
the three mappings. The pitch reversals with Smt-MF were
most likely due to filtering out of partials below 440 Hz.
Reference G4# (415 Hz) had its fundamental filtered out,
leaving the first harmonic overtone as its lowest tone. Notice
that there is no evidence that CI recipients can perceive
missing fundamental [13]. This may be due to the spread
of excitation at electrodes. This can lead to pitch reversals
when the probe tone has an unfiltered fundamental at a
lower frequency than G4#’s first harmonic. In octave 3,
the reference tone G3# (207 Hz) and the probe tones all
have their fundamental filtered out, and pitch ranking can
apparently still be reliably carried out with the remaining
unfiltered overtones.
Smt-LF also appeared to perform better than Smt-MF.
One possible reason for this could be that it preserved the low
frequency components, transposing them into a higher per-
ceptual range, whereas Smt-MF tends to cut off frequencies
below 440 Hz (A4) and therefore had poorer representation
of the partials of tones, particularly in the lower octaves. Note
that the frequency transposition that occurs with Smt-LF
tended to also make the sounds unnaturally higher in pitch
than with Smt-MF, which had a frequency mapping which
was closer to the natural tonotopic characteristic frequency.
In general, the pitch ranking was improved with Smt
mapping compared to Std mapping.
4.2. Experiment 2: Melody Contour Identification. In the
MCI test, different contour patterns were presented to NH
subjects and CI recipients. The mean correct identification
scores of the MCI test were evaluated for different octaves
and different semitone intervals using Std, Smt-MF, and Smt-
LF mappings.
The results for NH subjects listening to the AMO outputs
are summarized in Figure 6 and generally showed that the
MCI scores improve with increasing interval size. With Smt-
MF mapping, the scores were significantly better than those
with Std mapping in octave 3 with 4 and 5 semitone intervals,
as well as in octave 4 with 1 and 3 semitone intervals. In
octave 3 with 1-semitone intervals, a significant decrease was
found, most probably due to Smt-MF filtering out partials
below440Hz,whichcanresultinpitchreversalswiththe
Smt-MF mapping at low frequencies due to strong confusion
between rise-fall, fall-rise, fall-flat, and flat-fall in octave 3.
Smt-LF mapping generally yielded significant improve-
ments over Std mapping, with the exception that a significant
decrease in the recognition score was found at octave 5
with 1 interval. For tones in octave 5, Smt-LF filters out all
overtones above 1502 Hz, leaving only the fundamental in
the melody contours. With only a single component which
is at the same time spread out over several adjacent critical
bands, the melody contour patterns with 1 semitone intervals
become difficult to resolve, as illustrated in Figure 7.There
was also a significant difference between Smt-LF and Smt-
MF in octaves 3 and 4 with 2-semitone intervals.
The inability or failure to resolve a melody contour is
indicated by “flat” responses when the presented contour was
not “flat.” Figure 8 shows the mean number of occurrences
of such failures to resolve melody contours. Std mapping
generally yielded significantly more failures at octave 3 with
1 semitone intervals compared to either Smt-MF of Smt-LF,
which is consistent with the expected compression of partials
in the lower frequencies. The failures became less frequent as
the interval size was increased or at a higher octave. For Smt-
LF, there was a significant increase in such resolution failures
at octave 5 with 1 interval. This corresponds to the reduction
in scores in Figure 5 and is due to the Smt-LF mapping
filtering out overtones higher than 1502 Hz, thereby reducing
the tones to only their fundamental component and thus
making it difficult to resolve tones in higher octaves.
8 EURASIP Journal on Audio, Speech, and Music Processing
400
800
1600
3200
6400
8000
Frequency (Hz)
0.20.40.60.811.21.4
Time
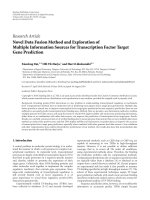
Figure 7: Spectrogram of the AMO output for the MCI rise-fall
pattern in octave 5 with 1-semitone intervals and fundamental
frequency of the root note equals 880 Hz, processed with Smt-LF
mapping. Only the fundamental frequencies are left after Smt-LF
has filtered out partials above 1502 Hz. The Smt-LF output is then
resynthesized in the AMO using the tonotopical frequencies at the
corresponding electrode positions, which results in a transposition
of the center activity to around 4000Hz [2].
The results in Figures 6 and 8 also show that there was
generally little difference between the three mappings with
large (4 and 5) intervals and these are therefore superfluous
for this test. Also, MCI contours in the higher octaves (4 and
5), except at 1-semitone interval, are also largely redundant.
Furthermore, Smt-MF mapping filters out too many of the
partials from tones in octave 5, making it difficult to perform
meaningful comparisons. Consequently, it was decided that
the subsequent testing with CI subjects would concentrate on
octaves3and4,with1,2,and3semitoneintervals.
The MCI test was repeated using a reduced number (5
instead of 9) of contour patterns with CI recipients. Eight CI
recipients took part in the MCI test with twice the number of
repetitions and the same mapping conditions.
Figure 9 shows the results for CI recipients with Std, Smt-
MF, and Smt-LF mappings. With all three mappings, the
identification scores generally improved when the interval
size was increased from 1 to 2 semitones, whereas the
differences in scores were smaller when the interval size was
increased from 2 to 3 semitones. No significant differences
were found between all three mappings. In octave 4, the Smt-
LF score was lower than in octave 3, and also lower than
the scores compared with Std and Smt-MF mappings. This
decrease may be due to filtering outof high frequency partials
with Smt-LF. This is illustrated in the electrodograms in
Figure 10 for the rise-fall pattern in octaves 3 (Figure 10(a))
and 4 (Figure 10(b)) with 2 semitone intervals. It also shows
that the Smt-LF pattern is transposed to channels with
higher characteristic frequencies, and that high frequency
overtones are filtered out from the 4th octave signal’s pattern
(see Figure 10(b)), leaving less cues in the resulting signal
to perform the contour identification compared to the 3rd
octave signal’s pattern as shown in Figure 10(a).
The CI recipients’ failure to resolve melody contours is
shown in Figure 11. A significant decrease in the number
of failures to resolve the contours with Smt-MF at octave 3
with 1 interval was found in comparison with Std mapping.
This was significantly smaller with Smt-LF mapping. The
difficulties in resolving the contours with Std are most likely
due to the poor representation at lower frequencies. In
octave 3, with Smt-MF, the lower frequency partials (the
fundamental in particular) have been filtered out, but this
wasnotthecasewithSmt-LF(seeFigures12 and 13).
Even with the semitone mapping, lower partials are generally
better resolved than higher partial, due to the logarithmic
nature of the frequency-to-channel assignment, resulting
in a spatially denser representation of the higher partials.
Together with effects like the spread of excitation, this
makes it more difficult to resolve contours when the lower
partials are missing. The importance of the lower partials is
supported by the observation that with Smt-LF in octave 4,
where the higher frequency partials have been filtered out,
the performance improved compared to octave 3.
Overall, CI scores were lower than simulation scores. The
significant benefits of semitone mappings does not exist in
CI users with MCI test, and this may be due to requirement
of a long-term familiarization or more CI subjects. However,
a significant reduction in failure to resolve tone is noticed
with Smt-LF. More importantly, unlike NH subjects listening
to simulations, CI users did not seem to have pitch reversals
because their Smt-MF scores were not poorer than their Std
scores in octave 3 with 1-semitone interval condition (see
Figure 9).
4.3. Experiment 3: I nstrument Recognition. Eight CI recipi-
ents took part in the IR test. Their task was to identify the
instrument used to play a musical piece. There were eight
instruments from four instrument families. The results were
analyzed for the percentage correct scores for identifying the
individual instrument (8 possibilities) and the instrument
family (4 possibilities).
Figure 14 shows the IR scores with CI patients with the
three mappings (Std, Smt-LF, and Smt-MF). In general, it
shows that the Std mapping was preferred. Piano and Clar-
inet tones were better recognized using Smt-MF mapping.
Whereas, Smt-MF was significantly higher than Std and
Smt-LF using the Clarinet instrument. One reason may be
because in general Clarinet partials are more harmonically
related than other instruments like the Cello (see Figure 15).
However, Violin was better recognized with Smt-LF and Smt-
MF than Std mapping.
Figure 15 shows a comparison between unprocessed
tones from Clarinet and Cello instruments. The figures
represent a polar representation of frequency values of
existing partials allocated on a binary spectrum to represent
octave spacing. The figure shows that the angular diff
erences
between partials in the clarinet instrument are almost equal,
which is not the case with Cello (see Figure 15(b)). This
equal spacing of harmonics in a natural instrument was
significantly recognized with Smt-MF as shown in Figure 14.
Figure 16 summarizes the average results with Std, Smt-
MF, and Smt-LF mappings. The average identification scores
decreased significantly with Smt-LF mappings compared to
Std mappings for individual instruments as well as instru-
ment families. This may be because characteristic differences
EURASIP Journal on Audio, Speech, and Music Processing 9
0
20
40
60
80
100
1234512312Semitones
Octave 3 Octave 4 Octave 5
Octaves (3–5) with different semitone intervals
∗
∗∗
∗
∗
∗
∗
Failure to resolve MCI patterns-with NH
∗
∗
STD
MF
LF
Figure 8: Mean frequency of occurrence of failures to resolve a contour pattern for NH subjects with AMO outputs for standard (white),
semitone Smt-MF (gray), and Smt-LF (white) mappings. An asterisk between two columns indicates that the corresponding scores are
significantly different (P
= .05) from each other.
0
20
40
60
80
100
Mean score (%)
12 312 3
Octave 3 Octave 4
Semitones
Octaves (3 and 4) with semitone intervals (1–3)
Mean MCI scores-with CI
STD
SMTMF
SMTLF
Figure 9: MCI test results with CI recipients for standard (white), semitone Smt-MF (grey), and Smt-LF (black) mappings. Two octaves (3
and 4) were tested with semitone intervals from 1 to 3. Chance level is indicated by the dashed line. There were no significant differences
found between the three mappings.
between instruments such as timbre are contained in the
temporal fine structure rather than the tonotopic frequency
allocation [14]. The three mappings Std, Smt-LF, and Smt-
MF use different window lengths of 128, 512, and 512,
respectively, for their processing algorithms. In addition,
Smt-LF halves the sampling rate to increase the frequency
resolution for frequencies below 1054 Hz, which account
for the majority of its input frequency range. Consequently,
the temporal resolution is expected to be best with Std and
poorest with Smt-LF. Additionally, as these strategies do
not encode the temporal fine structure properly, patients
may only be relying on the spectrum to identify different
instruments. Since the Std mapping is covering the widest
frequency range (180–7800 Hz) compared to semitone map-
ping Smt-LF and Smt-MF ranges (130–1502 Hz) and (440–
5009 Hz), respectively, the highest amount of spectral infor-
mation is transmitted with Std mapping. Another possible
reason could be that the subjects were more familiar with the
Std mapping, which is very similar to the mapping used in
their daily used speech processor, and this may illustrate the
need of a long term familiarization with Smt mapping.
5. Discussion
Although implant recipients perceive basic rhythm patterns
similarly to NH subjects [15], perception for pitch, pitch
10 EURASIP Journal on Audio, Speech, and Music Processing
21
20
19
18
17
16
15
14
13
12
11
10
9
8
7
6
5
4
3
2
1
Channel activity
0 500 1000 1500
Time (ms)
MCI rise fall: octave 3
(a)
21
20
19
18
17
16
15
14
13
12
11
10
9
8
7
6
5
4
3
2
1
Channel activity
0 500 1000 1500
Time (ms)
MCI rise fall: octave 4
(b)
Figure 10: Electrodograms for the MCI rise-fall pattern in octave 3 (a) and octave 4 (b) with 2 semitone intervals, using Smt-LF
mapping. Smt-LF, which has an upper cut-off frequency of 1502 Hz, has filtered out most of the octave 4 signal’s higher partials. The two
electrodograms also demonstrate how Smt-LF results in a transposition to higher frequencies (see [2]).
0
20
40
60
80
100
∗
Mean occurrences (%)
12 312 3
Octave 3 Octave 4
Semitones
Octaves (3-4) with semitone intervals (1–3)
Failure to resolve MCI patterns-with CI
STD
MF
LF
Figure 11: Mean frequency of occurrence of failures to resolve a contour pattern for CI recipients for standard (white), semitone Smt-MF
(gray) and Smt-LF (black) mappings. Two octaves (3 and 4) are plotted with different semitone intervals. An asterisk between two columns
indicates that the corresponding scores are significantly different (P
= .05) from one another.
sequences, and melody recognition is significantly poorer
than that of NH [15–21].
Pitch ranking was tested with two reference tones (D
and G#) with different semitones intervals for the three
mappings (Std, Smt-MF, and Smt-LF) using the AMO with
NH subjects only. The AMO is based on a noise band
vocoder [5]. One of the parameters needed for the AMO
was the width of stimulation. The authors in [5, 10]found
that a width of stimulation of around 1 mm produced
electrode discrimination similar to that of average Nucleus
CI24 recipients. Prior to using the AMO for testing with
NH subjects for the present study, a pilot test was initially
conducted to examine the effectofthewidthofstimulation.
The Oldenburg sentence recognition test [22–24]inquiet
was chosen for this purpose with the Std mapping using
different widths of simulation (1, 3.3, and 10 mm). The
results shown in Figure 17 indicate that widths of 1 and
3.3 mm gave very similar results (90% and 87%, resp.). With
10 mm, the results were very poor and were considered to
be not representative of CI recipients performances [25]. A
1 mm width of stimulation was selected for further tests with
the AMO as this matches well with the recommendation by
[5, 10].
The pitch ranking test with NH subjects was intended to
examine whether the Smt mappings would indeed produce
better representation of complex tones over Std mapping.
EURASIP Journal on Audio, Speech, and Music Processing 11
21
20
19
18
17
16
15
14
13
12
11
10
9
8
7
6
5
4
3
2
1
Channel activity
0 500 1000 1500
Time (ms)
Fall-rise in octave 3 with 1 semitone interval (Smt-LF)
(a)
21
20
19
18
17
16
15
14
13
12
11
10
9
8
7
6
5
4
3
2
1
Channel activity
0 500 1000 1500
Time (ms)
Fall-rise in octave 4 with 1 semitone interval (Smt-LF)
(b)
Figure 12: Results of Smt-LF (upper) mapping for the fall-rise pattern in octave 3 (a) and octave 4 (b) using 1-semitone intervals. It shows
also results of Smt-MF (lower) mapping for the same pattern in octave 3 (a) and octave (4) right with the same semitone intervals.
21
20
19
18
17
16
15
14
13
12
11
10
9
8
7
6
5
4
3
2
1
Channel activity
0 500 1000 1500
Time (ms)
Fall-rise in octave 3 with 1 semitone interval (Std)
(a)
21
20
19
18
17
16
15
14
13
12
11
10
9
8
7
6
5
4
3
2
1
Channel activity
0 500 1000 1500
Time (ms)
Fall-rise in octave 4 with 1 semitone interval (Std)
(b)
Figure 13: Results of individual musical instruments and instrument family recognition test with CI recipients using standard (Std) (bricked)
and Smt-MF (gray) and Smt-LF (black) mappings. Dashed lines illustrate chance level. An asterisk between two columns indicates that the
corresponding scores are significantly different (P
= .05) from one another.
Results with unprocessed synthetic complex tones confirmed
that (a) the test material was suitable for such a task, and (b)
thesubjectswereabletoperformthetask.Resultstended
to be poorer with smaller intervals between the probe and
reference, and also poorer in a lower octave range. This is
consistent with the reduction in critical band size at the
frequencies of concern (i.e., below 500 Hz) [1].
The pitch ranking results with the AMO showed that
Std mapping was significantly poorer than either of the
Smt mappings for the tone pair D-D# (1-semitone interval)
in all three octave ranges. With 3-semitone intervals, Std
mapping was significantly poorer than Smt-LF mapping
atthelowestoctave(D3-F3)only.Withahigherpitched
reference (G#), these difficulties with the Std mapping were
not observed. This is consistent with the fact that Std
mapping compresses the representation of lower frequency
partials, thereby making it difficult to distinguish between
tones that are close to each another. Smt mapping in general
improves the representation of the partials. Pitch reversals
were seen with the Smt-MF mapping in octave 3 with the
D reference, and in octave 4 with the G# reference. A closer
examination of the power spectrum estimates for the AMO-
generated tones, for instance, G4# and D5 (with fundamental
frequencies of 392 Hz and 554 Hz, resp.), shows that the loss
of partials below 440 Hz filtered out by Smt-MF shifts the
lowest remaining partial of G4# to a frequency higher than
12 EURASIP Journal on Audio, Speech, and Music Processing
0
10
20
30
40
50
60
70
80
90
100
∗∗ ∗
∗
Trumpet Trombone Flute Clarinet Violine Cello Guitar Piano
Instrument recognition test with CI patients
STD
MF
LF
Figure 14: Instrument recognition scores with CI patients for different instruments using Std (white), Smt-MF (gray), and Smt-LF (black)
mappings. A significant enhancement was detected with the Smt-MF using the Clarinet instrument.
4096
2048
1024
512
256
128
64
32
16
4
2
0
8001
(Hz)
Clarinet instrument
(a)
4096
2048
1024
512
256
128
64
32
16
4
2
0
Cello instrument
8001
(Hz)
(b)
Figure 15: A polar representation of frequency components along an octave spacing binary spectrum for both Clarinet (a) and Cello (b)
instruments. It illustrates that angular distance or in other words semitone spacing between different components in the Clarinet is almost
equal and this may be one reason for significant instrument recognition of Clarinet with Smt-MF. Partials amplitudes were extracted from
logarithmic amplitude FFT with a threshold at
−90 dB and then were replaced with a constant value.
that of D5 (see Figure 18). Thus, the loss of lower frequency
partials due to the cutoff frequency of Smt-MF is a likely
cause of the observed pitch reversals.
These results cannot be related directly to CI recipients,
as the AMO only produces an approximation to the CI
perceptions [26]. However, the results did show that in
principle, Smt mapping has the potential to produce better
pitch ranking of complex tones that possess a harmonic
structure. Pitch reversals arising due to filtering out of
the lower frequency partials had a negative effect on the
identification scores. Smt-LF mapping filters out partials
below 130 Hz and above 1502 Hz, while Smt-MF mapping
filters out partials below 440 Hz and above 5009 Hz. For
the range of tones tested here, Smt-LF caused no loss of
lower frequency partials due to filtering. Smt-MF, on the
other hand, is more likely to result in the lower partials
of the lower pitched tones being affected by its band-pass
filter cutoff. Smt-MF mapping was designed to be as close
as possible to the characteristic tonotopic frequencies of
the electrode array according to the Greenwood function
[27], assuming an average cochlea length of 33 mm and an
insertion depth of 22 mm [2]. It is not possible to map
Smt-LF to characteristic tonotopical locations because the
lowest input frequency of 130 Hz is far too distant from the
characteristic frequency of the most apical electrode (whose
location should correspond to a characteristic frequency of
around 400 to 600 Hz) according to Greenwood. Instead,
Smt-LF mapping effectively transposes frequencies from 130
to 1502 Hz into a higher tonal range. This may simplify
pitch ranking of tones in the lower frequency octaves (e.g.,
octave3)butmaycausethemtobeperceivedasunnaturally
high pitched. The results nevertheless demonstrated that Smt
mapping may improve pitch ranking due to improving the
frequency representation.
The pitch-ranking results also showed that the test has
different sensitivity in different tonal ranges. With the G#
reference, it was not sensitive enough to detect differences
between the various mappings being investigated. Pitch
EURASIP Journal on Audio, Speech, and Music Processing 13
0
20
40
60
Score (%)
80
100
Individual instruments Instrument family
Instrument recognition test-with CI
∗∗
Chance
level
STD
SMTMF
SMTLF
Figure 16: Results of individual musical instruments and instru-
ment family recognition test with CI recipients using standard
(Std) (bricked) and Smt-MF (gray) and Smt-LF (black) mappings.
Dashed lines illustrate chance level. An asterisk between two
columns indicates that the corresponding scores are significantly
different (P
= .05) from one another.
0
10
20
30
40
50
60
70
80
Mean score (%)
90
100
Width of simulation
Oldenburg sentences test
1mm
3.3mm
10 mm
Figure 17: Average correct scores for the Oldenburg sentences test
performed with different widths of simulation (1, 3.3, and 10 mm)
for the AMO using two lists with 10 sentences each. Only native
German speaking subjects were tested.
ranking is possibly a too simple task, and further studies
should involve a more complex test that is sensitive enough
to show differences between mappings. Such a test will be
first assessed with NH subjects and then subsequently with
CI recipients.
Melody can be described as a group of tones that
are perceived as a single entity [7]. Different melody tests
exist, such as simple melody recognition with lyrics [29]
or a sequence of familiar notes [30–32], complex song
recognition, and complex song appraisal [29]. Although it
would have been more appropriate to perform a melody
test, the existing tests do not involve the perception of
melody alone but also involve other perceptual mechanisms
such as pattern recognition as well as memory (familiarity).
For instance, familiar melody recognition has been used to
directly asses CI listeners’ music perception abilities [18, 21,
33, 34], but general results showed that CI recipients are
performing much worse than NH subjects [4]. In addition,
−100
−80
−60
−40
−20
(dB)
0 500 1000 1500 2000 2500 3000
Frequency (Hz)
Power spectrum estimates-unprocessed signal
414 Hz
585 Hz
828 Hz
(a)
−100
−80
−60
−40
−20
(dB)
0 500 1000 1500 2000 2500 3000 3500
Frequency (Hz)
Power spectrum estimates-AMO output for Smt-MF
859 Hz
1070 Hz
Ref G4#
Probe D5
(b)
Figure 18: Power spectrum estimates for both the G4# reference
(black) and D5 probe (6-semitone interval) (gray) signals for the
unprocessed tones (a) and using Smt-MF mapping after AMO
processing (b). The fundamental frequency of the reference tone
(414 Hz) is filtered out because it is below 440 Hz (shaded area
in (a)), while that of the probe (585 Hz) is retained. After Smt-
MF processing with the AMO, comparisons of the unfiltered first
overtone’s peak above the theoretical noise floor of the power
spectral density (
−48.2 dB) which is double the theoretical noise
floor of FFT in dB [28] (shaded area in (b)) in the reference
(1070 Hz) with the fundamental of the probe (
∼859 Hz) would then
result in a pitch reversal.
Lynch et al. found that musical experience or education and
cultural background greatly influenced melody recognition
performance when notes within a melody were mistuned
[35]. The authors in [19] measured CI recipients’ melody
and rhythm discrimination using the primary measures of
musical audition (PMMA) test. Their results showed that CI
recipients were more sensitive to changes in rhythm than in
melody. Familiar melody identification may involve paying
attention to the pitch contour of the melody [36]. As such,
deviations from the expected intervals for a familiar melody
maystronglyaffect identification performance. CI recipients
may depend less on the exact intervals and more on the
general contour of changes in pitch, rhythm, and timbre.
Because CI recipients’ perception of these musical aspects
will be limited by the amount of information transmitted
by the devices, we chose to investigate the CI recipients’
ability to identify melody contours. Galvin et al. introduced
the MCI test which assesses the listener’s ability to detect
and identify interval changes between successive tones in a
short sequence [4]. Among the advantages of this test is that
confounding factors such as rhythm can be eliminated, and
14 EURASIP Journal on Audio, Speech, and Music Processing
the contour patterns do not need any previous familiarity for
the listener to perform the task.
The results of the MCI test with NH subjects showed
similarities with the results from the pitch ranking test in that
significant improvements over Std mapping were obtained
for Smt-LF mapping, particularly in octave 3 with 1 and 3
semitone intervals, as well as in octave 4 with 1-semitone
interval. However, the pitch ranking improvements were
found with the D reference but not the G# reference, whereas
the MCI patterns had a root note of A, and the tone intervals
were more similar to the pitch ranking intervals with the G#
reference. Thus, the pitch ranking and MCI results cannot be
directly inferred from one another. The MCI test is probably
amoredifficult task as the listener had to concentrate on the
contrasts between up to 5 tones, whereas the pitch ranking
task only involved a single contrast. A given tonal range
which was relatively easy for pitch ranking may thus be
expected to be more difficult when multiple contrasts are
involved. The observation that the MCI test results showed
the same trend at a higher “reference” or “root” tone suggests
that MCI is not merely a more complex form of pitch ranking
involving sequential tones but is also a more difficult form.
With Smt-MF, the poor MCI results in octave 3 with
1-semitone intervals was most probably caused by pitch
reversals in specific tones as a result of the lower partials
being filtered out. Note that pitch reversals in specific
tones are probably more crucial for contour patterns with
smaller intervals, which are inherently more difficult to
resolve. When larger intervals are involved, the subjects
may still be able to use the other segments of the contour
to perform the identification. With Smt-LF, there was a
significant decrease in contour identification at octave 5
with 1-semitone intervals most likely because of filtering out
high frequency partials, resulting thereby in some patterns
being identified as flat when they were not. The results
with these particular patterns were further analyzed, and
the inability or failure to resolve melody contours in this
manner was found to correspond to the observed reduction
in identification score. The inability to resolve partials also
accounts for the significantly higher number of errors with
the Std mapping at octave 3 with 1-semitone intervals, since
frequency components in the octave 3 range tend to be
mapped to a very small number of channels with the Std
mapping.
The number of patterns was reduced to 5 contours (rise,
rise-fall, flat, fall-rise, and fall) for testing with CI recipients.
Based on the results from the pitch ranking and MCI tests
with NH subjects, it was also decided to restrict the MCI
test to octaves 3 and 4, using the more difficult interval-size
conditions, namely with semitone intervals 1 to 3 in each
contour.
Incorporating virtual channels, thereby increasing the
number of available channels from 22 to 43, for testing
with CI recipients is expected to produce improvements in
performance. This study, however, was aimed primarily at
comparing Smt mapping against the Std mapping, and as the
CI subjects did not use virtual channels in their regular daily
routine, it was decided that the number of varying param-
eters should be minimized for the comparisons. With 22
channels, the resolution of the frequency to channel mapping
was also reduced by a factor of two, meaning that always two
semitones will be mapped to a single channel. The MCI test
was therefore carried out with both NH and CI subjects using
22 channel mode in order to be able to compare the results
directly. Patients did not have a short-term or long-term
adaptation to Smt mapping due to technical constrains. Since
Smt mapping uses slightly different processing technique
(Subbands and mapping matrices) which requires building
a new firmware and writing it to the implant processor
in order to provide patients a long-term adaptation and
this is not feasible except in manufacturer labs. However,
performance may gradually improve with short-term and
long-term adaptations with Smt mapping.
The MCI test results with CI recipients showed a general
improvement in identification scores with increasing interval
size. The enhancements found of Smt-LF and Smt-MF in the
average scores were not significant for a given octave and
interval size condition. The Smt-LF scores appeared to be
lowerfortheoctave4comparedtotheoctave3conditions,
most probably due to filtering out of higher partials resulting
in less cues to distinguish between the contour patterns.
Both Smt-MF and Smt-LF mappings were better than Std
mapping in terms of resolving contours, especially in lower
octaves (octave 3) with small (1-semitone) interval sizes,
where Smt-LF mapping was statistically significant and this
emphasizes that semitone mapping may be advantageous
to the Std mapping. Again, this is consistent with the
expectation that Std mapping is unable to resolve tones
well in these frequency ranges, and this is remedied by Smt
mapping.
In general, Smt mapping showed some improvements
over Std mapping with the MCI test. However, melody
contour is only one aspect of music perception. Timbre is
another aspect that is involved in characterizing different
instruments [8]. Timbre depends on the frequency spectrum
as well as the temporal fine structure of the perceived sounds.
To investigate whether music with semitone mapping would
be perceived as musical, a music IR test was carried out.
In this test, the timbre is coded more in the temporal
patterns rather than the frequency spectrum. Results with CI
recipients in the IR test showed that there was a statistically
significant enhancement of Smt-MF over the Std mapping
with Clarinet. However, in general there was a decrease
in average individual instrument and instrument family
recognition scores with semitone mappings. The decrease
was found to be significant with Smt-LF mapping. Semitone
mapping is based upon modifying the frequency allocation
compared to the Std mapping of the ACE strategy and
uses different number of points in the FFT frames and the
overlap [2]. Because there were no changes to the specific
coding of temporal information for all three mappings,
the Smt mappings effectively changed the spectral density
representations compared to the Std mapping. Thus, the
CI recipients may have been strongly relying on the power
spectral density of signals as suggested by [37] for identifying
the instruments. One reason may be the increased window
size (number of points) used in Smt-MF and Smt-LF
compared to Std (512 versus 128) and the additional subband
EURASIP Journal on Audio, Speech, and Music Processing 15
decomposition of Smt-LF improved the frequency resolution
with Smt mapping at the expense of decreasing the temporal
resolution. Furthermore, the Std mapping covers a range
from 188 to 7980Hz, while Smt-LF and Smt-MF cover the
frequency ranges from 130 to 1502 Hz and from 440 to
5009 Hz, respectively. Since the Std mapping has a wider
input frequency range than the Smt mappings, the average
encoded spectrum will be greater than with either Smt
mappings. Thus, the larger spectral representation as well
as the CI recipients’ familiarity with the Std mapping are
other likely reasons for its superior performance in the
IR test. This also highlights the importance of training as
well as the need to encode appropriate cues for specific
purposes (temporal fine structure in this case for timbre
perception). An additional reason may be the harmonic
relationship of frequency components in an instrument
sound, the more the harmonic structure it has, the better
recognition with semitone mapping especially Smt-MF is
expected to be. Instrument recognition may be dependent
on the energy per octave. Furthermore, the observation
that Smt-MF performed better than Smt-LF could has been
due to the effective transposition to a higher pitch range
that occurs with Smt-LF mapping. The resultant sounds
were commented by CI recipients as being unnaturally high
pitched and unpleasant, making it more difficult for them to
distinguish and identify the instruments.
6. Conclusion
Pitch ranking and melody contour identification [4]showed
that there was an improvement with semitone mapping
over Std mapping. The pitch ranking results support the
hypothesis that better preservation of the harmonic structure
through semitone mapping will improve the discriminability
of complex tones. Similarly, the hypothesis that this improve-
ment in discrimination can be applied to a more complex
task such as melody contour identification appears to be
also justified. However, the frequency limits of both Smt-LF
and Smt-MF can produce difficulties when not all partials
of complex tones are present. This is more likely to occur
when the tones have partials close to the frequency limits
of either semitone mappings. The improvement differed
between Smt-MF and Smt-LF. Although Smt-LF mapping
provided better pitch ranking and melody identification
results, the perceived sounds were much higher in pitch
and some CI recipients did not like it. Smt-MF maps the
tones closer to their natural characteristic frequencies and
probably sounded more natural than with Smt-LF for this
reason. The instrument recognition test showed a significant
enhancement with Clarinet using Smt-MF but in general
revealed a significant decrease in average scores with semi-
tone mapping. The results illustrate that semitone mapping
alone is not sufficient to improve instrument recognition of
allinstruments.Temporalfinestructureinformation,which
is also important to discriminate timbre (and hence identify
instruments), is not explicitly coded in semitone mapping,
and may need to be included in future developments of
coding strategies intended to present music. The benefits of
semitone mappings were significant in simulations but were
not significant in CI with MCI test. Long term familiarization
with the new mappings and use of VCs may be necessary
before significant benefits in CI users can be observed.
Acknowledgments
This project was supported by Swiss National Science Foun-
dation Grant no. 320000-110043. The authors are grateful to
Dr. Michael B
¨
uchler for his support in the earlier stages of
the experiments.
References
[1] J. Pierce, The Science of Musical Sound, Scientific American
Books, New York, NY, USA, 1983.
[2]S.Omran,W.Lai,M.Buechleretal.,“Semitonefrequency
maps to improve music representation for nucleus cochlear
implants,” Submitted.
[3] K. Kasturi and P. C. Loizou, “Effect of filter spacing on
melody recognition: acoustic and electric hearing,” Journal of
the Acoustical S ociety of America, vol. 122, no. 2, pp. EL29–
EL34, 2007.
[4] J. J. Galvin, Q. J. Fu, and G. Nogaki, “Melodic contour
identification by cochlear implant listeners,” Ear and Hearing,
vol. 28, no. 3, pp. 302–319, 2007.
[5] J. Laneau, M. Moonen, and J. Wouters, “Factors affecting
the use of noise-band vocoders as acoustic models for pitch
perception in cochlear implants,” Journal of the Acoustical
Society of America, vol. 119, no. 1, pp. 491–506, 2006.
[6] S. Sadie and G. Grove, The New Grove Dictionary of Music and
Musicians, Grove, London, UK, 1995.
[7] E. Terhardt, Akustische Kommunikation, Springer, Berlin,
1998.
[8] H. L. F. Helmholtz, On the Sensations of Tone as a Physiological
Basis for the Theory of Music, Dover, New York, NY, USA, 1954.
[9] B. Swanson, Pitch perception with cochlear implants,Ph.D.
thesis, Faculty of Medicine, Dentistry & Health Sciences,
Otolaryngology Eye and Ear Hospital, The university of
Melbourne, Melbourne, Australia, 2008.
[10] J. Laneau and J. Wouters, “Multichannel place pitch sensitivity
in cochlear implant recipients,” Journal of the Association for
Research in Otolaryngology, vol. 5, no. 3, pp. 285–294, 2004.
[11] P. A. Busby and K. L. Plant, “Dual electrode stimulation using
the nucleus CI24RE cochlear implant: electrode impedance
and pitch ranking studies,” Ear and Hearing,vol.26,no.5,pp.
504–511, 2005.
[12] W. Lai and N. Dillier, “MACarena: a flexible computer-
based speech testing environment,” in Proceedings of the 7th
International Cochlear Implant Conference,Manchester,UK,
2002.
[13] A. J. Oxenham, “Pitch perception and auditory stream segre-
gation: implications for hearing loss and cochlear implants,”
Trends in Amplification, vol. 12, no. 4, pp. 316–331, 2008.
[14] S. Handel, “Timbre perception and auditory object forma-
tion,” in Hearing, M. BC, Ed., pp. 425–461, Academic Press,
San Diego, Calif, USA, 1995.
[15] K. Gfeller, G. Woodworth, D. A. Robin, S. Witt, and J.
F. Knutson, “Perception of rhythmic and sequential pitch
patterns by normally hearing adults and adult cochlear
implant users,” Ear and Hearing, vol. 18, no. 3, pp. 252–260,
1997.
16 EURASIP Journal on Audio, Speech, and Music Processing
[16] M. Dorman, K. Basham, G. McCandles et al., “Speech under-
standing and music appreciation with the Ineraid cochlear
implant,” Hearing Journal, vol. 44, pp. 32–37, 1991.
[17]M.F.Dorman,L.Smith,G.McCandless,G.Dunnavant,
J. Parkin, and K. Dankowski, “Pitch scaling and speech
understanding by patients who use the Ineraid cochlear
implant,” Ear and Hearing, vol. 11, no. 4, pp. 310–315, 1990.
[18] S. Fujita and J. Ito, “Ability of nucleus cochlear implantees to
recognize music,” Annals of Otology, Rhinolog y and Laryngol-
ogy, vol. 108, no. 7, pp. 634–640, 1999.
[19] K. Gfeller and C. R. Lansing, “Melodic, rhythmic, and timbral
perception of adult cochlear implant users,” Journal of Speech
and Hearing Research, vol. 34, no. 4, pp. 916–920, 1991.
[20] S. Pijl, “Labeling of musical interval size by cochlear implant
patients and normally hearing subjects,” Ear and Hearing,vol.
18, no. 5, pp. 364–372, 1997.
[21] S.PijlandD.W.F.Schwarz,“Melodyrecognitionandmusical
interval perception by deaf subjects stimulated with electrical
pulse trains through single cochlear implant electrodes,”
JournaloftheAcousticalSocietyofAmerica,vol.98,no.2,pp.
886–895, 1995.
[22] K. Wagener, T. Brand, and B. Kollmeier, “Development and
evaluation of a German sentence test II: optimization of the
Oldenburg sentence test,” Audiologie, vol. 38, pp. 44–56, 1999.
[23] K. Wagener, T. Brand, and B. Kollmeier, “Development and
evaluation of a German sentence test III: evaluation of the
Oldenburg sentence test,” Audiologie, vol. 38, pp. 86–95, 1999.
[24] K. Wagener, V. K
¨
uhnel, and B. Kollmeier, “Development
and evaluation of a German sentence test I: design of the
Oldenburg sentence test,” Audiologie, vol. 38, pp. 4–15, 1999.
[25] J. M
¨
uller-Deile, “Sprachverst
¨
andlichkeitsuntersuchungen bei
Kochleaimplantatpatienten,” HNO, vol. 57, no. 6, pp. 580–592,
2009.
[26]M.F.Dorman,T.Spahr,R.Gifford et al., “An electric
frequency-to-place map for a cochlear implant patient with
hearing in the nonimplanted ear,” Journal of the Association for
Research in Otolaryngology, vol. 8, no. 2, pp. 234–240, 2007.
[27] D. D. Greenwood, “A cochlear frequency-position function for
several species—29 years later,” Journal of the Acoustical Society
of America, vol. 87, no. 6, pp. 2592–2605, 1990.
[28] W. Kester, Mixed Signal and DSP Design Techniques,Analog
Devices and Newnes, 2003.
[29] K. Gfeller, S. Witt, J. Stordahl et al., “The effect of training on
melody recognition and appraisal by adult cochlear implant
recipients,” Journal of the A cademy of Rehabilitative Audiology,
vol. 23, pp. 115–138, 2000.
[30] K. Gfeller, C. Turner, M. Mehr et al., “Recognition of familiar
melodies by adult cochlear implant recipients and normal-
hearing adults,” Cochlear Implants International,vol.3,no.1,
pp. 29–53, 2002.
[31] V. Looi, H. McDermott, C. McKay, and L. Hickson, “Music
perception of cochlear implant users compared with that of
hearing aid users,” Ear and Hearing, vol. 29, no. 3, pp. 421–
434, 2008.
[32] C. Olszewski, K. Gfeller, R. Froman, J. Stordahl, and B.
Tomblin, “Familiar melody recognition by children and
adults using cochlear implants and normal hearing children,”
Cochlear Implants International, vol. 6, no. 3, pp. 123–140,
2005.
[33] Y.Y.Kong,R.Cruz,J.A.Jones,andF.G.Zeng,“Musicpercep-
tion with temporal cues in acoustic and electric hearing,” Ear
and Hearing, vol. 25, no. 2, pp. 173–185, 2004.
[34] S.PijlandD.W.F.Schwarz,“Intonationofmusicalintervals
by musical intervals by deaf subjects stimulated with single
bipolar cochlear implant electrodes,” Hearing Research,vol.89,
no. 1-2, pp. 203–211, 1995.
[35] M. P. Lynch, R. E. Eilers, K. D. Oller, R. C. Urbano, and P.
Wilson, “Influences of acculturation and musical sophistica-
tion on perception of musical interval patterns,” Journal of
Experimental Psychology: Human Per ception and Performance,
vol. 17, no. 4, pp. 967–975, 1991.
[36] W. J. Dowling, Melodic Contour in Hearing and Remembering
Melodies, Oxford University Press, New York, NY, USA, 1994.
[37] W. R. Drennan and J. T. Rubinstein, “Music perception
in cochlear implant users and its relationship with psy-
chophysical capabilities,” Journal of Rehabilitation Research
and Development, vol. 45, no. 5, pp. 779–790, 2008.