Diary of a Professional Commodity Trader Lessons from 21 Weeks of Real Trading_4 pdf
Bạn đang xem bản rút gọn của tài liệu. Xem và tải ngay bản đầy đủ của tài liệu tại đây (850.28 KB, 24 trang )
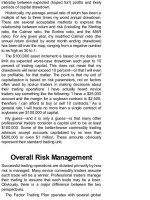
A Triangle and Running
Wedge in Sugar
FIGURE 4.21 Weekly Chart Symmetrical Triangle in
Sugar.
The sugar market generated the overwhelming proportion
of profits for the Factor Trading Plan in 2009. Figure 4.21
displays a 14-month symmetrical triangle on the weekly
chart at the precise point of completion on May 1. This
pattern launched the largest price thrust in sugar in 28
years. Figure 4.22 displays the daily chart of the actively
traded October 2009 contract. This chart had a
simultaneous breakout on May 1 of a six-month ascending
or running wedge.
Classical charting principles applied to the stock market
treat the rising wedge as a bearish pattern. However, many
substantial price advances in forex and commodities are
launched by an upward thrust from a rising wedge. I have
labeled this type of chart development as a running-wedge
pattern.
FIGURE 4.22 A Six-Month Running Wedge in October
Sugar.
An H&S Bottom in Apple
Computer
The only stock chart contained in this book, Figure 4.23
shows that Apple Computer completed a magnificent H&S
bottom on the daily chart on March 23. Notice that the
market retested the ice line on March 30, but the retest did
not violate the Last Day Rule.
FIGURE 4.23 A Perfect H&S Bottom in Apple Computer.
A Major Continuation H&S and
Symmetrical Triangle in Gold
This market is an excellent example of three patterns.
Figure 4.24 displays an 18-month inverted continuation
H&S pattern on the weekly chart. As a side note, the
minimum target of this pattern at 1340 or so has not been
reached as of this writing. There is no rule that stipulates
any target must be met. Chart patterns fail to deliver their
implied price moves all the time.
FIGURE 4.24 Weekly H&S Bottom in Gold.
There was quite a point of contention within the technical
community about this pattern. A well-known Elliott Wave
research firm, for which I have great respect, stated that
labeling the pattern as an inverted continuation H&S
patterns was a joke. Y Edwards and Magee in the “bible”
et
of classical chart principles, Technical Analysis of Stock
Trends, stated:
Occasionally prices will go through a series of
fluctuations which construct a sort of inverted Headand-Shoulders picture which in turn leads to
continuation of the previous trend. … One of these
patterns which develop in a rising market will take the
form of a Head-and-Shoulders Bottom.
Figure 4.25 shows that the right shoulder of the weekly
H&S pattern took the form of a massive six-month
symmetrical triangle on the daily graph. Also note that the
brief pause following the early September completion of the
triangle formed a five-week H&S failure pattern. These
types of small patterns are very useful in pyramiding a
position. This small pattern also allowed me to move the
protective stop from the initial Last Day Rule of the sixmonth triangle to the Last Day Rule of the five-week
continuation pattern.
FIGURE 4.25 A Large Symmetrical Triangle and Small
H&S Failure on the Daily Gold Graph.
FIGURE 4.26 A Bull Market in Copper Loaded with
Continuation Patterns.
A Series of Bullish Patterns in
Copper
Figure 4.26 shows a wonderful series of continuation
formations during the bull market in copper from March
through the end of December 2009. Notice that the Last
Day Rule of each pattern was never challenged, although
the stair-stepping nature of the advance was difficult on the
nerves. As a general rule, demand-driven bull markets
contain a lot of backing and filling, whereas bull moves
driven by severe supply shortages are much sharper. Most
bear markets are also quite sharp, retracing in half the time
the ground that was gained during the preceding bull trend.
A Failed Ascending Triangle in
the USD/CAD Crossrate
Right-angled triangles have the strong tendency to break
out through the horizontal boundary. In fact, a breakout of
the horizontal ice line can almost be expected. Y on
et,
occasion, a right-angled triangle can break out of the
diagonal boundary, usually grudgingly, as shown on the
weekly chart in Figure 4.27.
FIGURE 4.27 Weekly Chart Ascending Triangle in
USD/CAD.
The seven-month ascending triangle in the USD/CAD
had a bullish bias. As shown on the daily chart in Figure
4.28, the lower boundary of the ascending triangle was
called into question in mid April. However, even at that
time, my thinking was that the lower boundary was just
being redefined with a lower slope and that an upside
breakout was just being delayed. Nevertheless, I went with
a short sale on April 14 and was quickly stopped out above
the April 13 Last Day Rule.
FIGURE 4.28 A Tricky Breakout on the Daily USD/CAD
Chart.
The downward thrust on April 29 and 30 confirmed the
failure of the ascending triangle and called for a minimum
move to 1.09, a target reached in early June. This market is
a good example of how patterns initially biased in one
direction can provide a good signal for a move in the
opposite direction.
A 12-Week Rectangle in the
Dow Jones Transport Index
A 12-week rectangle was completed in late July. Note that
the Last Day Rule from July 23 was never challenged (see
Figure 4.29).
FIGURE 4.29 Continuation Rectangle in the Dow
Transports.
A Rare Horn in Brent Sea Oil
A horn bottom occurs with a sequence of a major low and
two higher lows intervened by two higher highs, as showed
i n Figure 4.30. The pattern takes the shape of a Viking
horn. A requirement of the pattern is that overlap exists
between the two upward thrusts within the pattern. Edwards
and Magee did not cover the horn pattern. However,
Schabacker identified the horn as a classical pattern. I
often refer to the horn bottom as a sloping bottom.
FIGURE 4.30 Sloping Bottom in Brent Sea Crude Oil.
The buy signal was triggered in early May when the April
high was penetrated. Note that the Last Day Rule was
never violated.
An H&S Bottom Launches the
2009 Bull Market in the S&Ps
I was emotionally committed to the bear case in stocks
coming off the March 2009 low. While I saw the massive
H&S bottom as shown in Figure 4.31, I did not believe it. I
dabbled on the long side of stocks from time to time during
the 2009 advance, but I was unwilling to accept the full
implications of the major H&S bottom. The target of this
H&S bottom at 1,252 was nearly met in April 2010.
FIGURE 4.31 H&S Bottom in S&Ps.
Summary
The preceding charts represent textbook examples of
classical charting principles. These patterns comprise a
category of chart pattern that I call the “Best Dressed
List”—those chart formations (or series of chart formations
making up a large trend) that best exemplify price chart
construction.
At the end of each year my net profitability is, in large
part, dependent on correctly identifying and trading a major
portion of those chart patterns that in hindsight become
members of the Best Dressed List. In fact, my largest
profits over the years have come from market situations
similar to and including those shown.
In reality, these types of grand chart formations are more
obvious after the fact than they are in real time. In my
dreams, I imagine a trading year in which all of my trades
are limited to these types of market situations. But dreams
are dreams, and real life is real life. And in real life, many of
the patterns I trade do not turn out the way these charts did.
Some authors may produce material on classical chart
patterns implying that these were the only situations they
traded. But I am first and foremost a trader, not an author,
and I need to admit that when I catch these ideal chart
patterns it makes up for a lot of the losses I ring up along
the way.
Points to Remember
It is important for a trader to have a clear
understanding what constitutes an ideal trade.
Excellent chart trades do not come around every
day but can take weeks and months to develop.
Developing the patience to wait, wait, and wait
some more for a market to declare itself is a
goal, not a destination. As a trader, I seek
improvement, not perfection.
While chartists often attempt to jump the gun on
a pattern (including me), markets usually make it
abundantly clear when it is time to climb aboard.
Chapter 5
How the Factor Trading Plan
Works
It is time to get into the nuts and bolts of the Factor Trading
Plan. Figure 5.1 shows the four main elements of the plan,
including trade identification, trade entry, trade risk
management, and trade order management. This chapter
will tackle each element individually and in detail.
FIGURE 5.1 The Necessary Elements of a Trading Plan.
Trade Identification
I knew I wanted to be a trader before I knew I would
become a chartist. Trading was the “what” of my career
equation. Being a chart trader was the “how.” When I
entered the commodity business, my goal was to make
money as a trader. In reality, I did not have a clue what that
meant.
Chart trading made an enormous amount of sense to me
at the point in my career when I began finding my way.
Chart trading offered me a unique combination of benefits
not available with the other approaches I had attempted or
considered, including:
A means to understand market trend
An indication of market direction
A mechanism for timing
A means to determine risk
A realistic target for taking profits
However, I quickly discovered that there was a huge
difference between seeing chart patterns and actually
trading them. Thankfully, the book Technical Analysis of
Stock Trends by Robert Edwards and John Magee offered
some suggestions to the practical challenges of being a
chart trader. Y one of my major challenges wasn’t
et,
addressed in the book; namely, when I began keeping
charts, I saw patterns everywhere I looked. I needed to
better define for myself exactly what I was looking for in a
pattern in order to take a trade. Were all classical chart
patterns created equal? Were some patterns a better fit to
my personality, risk tolerance, and level of capitalization?
The Practical Problem of the Time
Duration of Chart Patterns
With the benefit of hindsight, I now realize that the dilemma I
was struggling with could be defined as time framing.
There are two realities of classical charting principles that
all serious chartists must confront.
First, it is patently easy to see chart patterns in hindsight.
Promotional materials from various trading advisory
services are replete with charts showing how they would
have traded a certain market in hindsight. But I trade the
markets in real time, and patterns clearly visible in hindsight
might have not been so clear in real time. Chart structure
constantly evolves. A pattern that eventually provides a
profitable trend might be comprised of numerous smaller
patterns, many of them failing to deliver an implied move.
Further, a big move might be ushered in with several false
starts.
A second and related reality is that many patterns
seemingly clear at the moment of a trade fail to deliver and
become swept up into a much bigger chart structure.
The Story of the “Big” Soybean
Move
During my first year at the Chicago Board of Trade (CBOT), a
trader in the soybean pit befriended me. This man lived in a
mansion in Evanston, drove a luxury German car, and showed
every indication of success (which, in fact, he had achieved).
He told me one afternoon about how bullish he was in
soybeans, at the time trading around $5.40. He said he had a
giant position. So I watched the market for a few days. Prices
crept up to about $5.60. I jumped in with a contract, only to have
prices return to $5.40 the following week. Suffering from this
losing trade, and seeking words of encouragement, I sought
out my pit trader friend and asked him what he thought. His
statement floored me. “I made a small fortune. Wasn’t that a
great move?”
As it turned out, my friend was a scalper who seldom held a
position for more than 10 minutes. He normally did not take
positions home with him overnight. T him, a two- or three-cent
o
move was his goal. When he initially spoke to me, he had an
instinct that soybeans could rally 10 cents within a day or two,
and he was willing to hold a position overnight to realize that
gain. But he did not explain this to me until after the fact.
So, in the end, I learned a very good lesson. Being a “bull” or
“bear” means nothing without a time frame or price horizon
attached to the words.
Because the structure of a chart becomes redefined over
a period of time (especially in broad periods of
consolidation), it is crucial for a trader to understand the
time frame that determines candidate trades. If a trader
tells me he is bullish on a certain market, I ask him if he is
long, at what price, what is his target, what is his time
frame, and at what price does he admit he is wrong. The
concept of being bullish or bearish means nothing.
GBP/USD as an Example of Time
Framing
Four charts of the British pound/U.S. dollar (GBP/USD)
illustrate the importance and complications of time frame
considerations.
Figure 5.2 is a weekly chart of GBP/USD from January
2009 through March 2010. The dominant stages of price
behavior shown on this chart are the run-up in prices during
the first half of 2009, the formation of the double top from
late May 2009 through February 2010, and the bear trend
that developed from the double top. Two secondary
patterns can also be seen, a 19-week H&S top that was
completed in late September 2009, but failed, and a 17week continuation triangle that broke out in early February
2010 to launch the completion of the double top.
FIGURE 5.2 Double Top on the Weekly Chart of
GBP/USD, June 2009–March 2010.
Figure 5.3 displays the daily price bars of GBP/USD for
an 11-month period of time from April 2009 through March
2010. It is the daily bar chart companion version of the
weekly chart shown in Figure 5.2.
FIGURE 5.3 Double Top on the Daily Chart of GBP/USD,
June 2009–March 2010.
This daily graph identifies classical chart patterns of
eight weeks or more in duration to demonstrate how a
broader period of consolidation is comprised of numerous
small patterns—that at the time seemed to be important
indicators of expected market behavior. The chronology of
this chart was as follows:
A two-month ascending triangle (Pattern A) was
completed in late July. This pattern failed to propel prices
for more than three days. The brief rally out of the top of the
triangle led to what became the head of a 16-week H&S
top (Pattern B). This H&S top broke out in late September
and also quickly failed.
The advance from the early October low led to an eightweek complex H&S top (Pattern C). While the completion
of this pattern experienced some initial downward
momentum, prices stabilized at the December low and then
chopped sideways to higher for the next four weeks. In the
process, I was stopped out of the shorts I established
based on the eight-week H&S top.
All of these patterns combined to constitute the broad
eight-month double top completed in early February with a
target of 1.440 to 1.470.
From my perspective, all four of these patterns (A
through D) were worth trading—in fact, I traded them all.
Had any of the first three patterns worked, they could have
been considered as textbook examples of classical daily
chart patterns.
Figure 5.4 examines the period September 2009
through March 2010, or the last seven months of the period
covered in Figure 5.3, attempting to identify shorter-term
patterns. In fact, seven patterns (labeled A through G) could
have represented signals for the shorter-term classical
chart trader. Figure 5.4 further demonstrates how smaller
patterns become part of bigger patterns that become part
of even bigger patterns and so on.
FIGURE 5.4 Daily Chart of GBP/USD, October 2009–
March 2010.
Finally, Figure 5.5 is the daily GBP/USD chart from
January through March 2010, the final three months of the
original 15-month period of time from Figure 5.2. Here,
again, it is possible to see even shorter-term patterns that
made up part the chart landscape of this forex pair. A very
short-term chart trader might have considered taking trades
based on these mini-patterns.
FIGURE 5.5 Daily Chart of GBP/USD, January 2010–
March 2010.
In the example of the GBP/USD it would have been
possible to base a trading perspective on the quarterly,
monthly, weekly or daily charts or to drill down on the time
frame to four-hour charts, two-hour charts, 60-minute charts,
and so on.
I have used the example of the GBP/USD to make two
points. First, a trading signal in one time frame might mean
nothing in another time frame. Second, chart patterns of
shorter duration often fail, only to become redefined as part
of a larger chart formation.
Charts are a record of where prices have been, but
trading is an operation that needs to be done in real time
with an eye on the future. To be a successful chart trader, a
person must have a firm fix on the time frame that will
generate the trading signals.
Let me touch on one more point dealing with time
framing. I believe it is important for a trader to use similar
time frames to both enter and manage a trade. What sense
does it make to enter a trade based on a weekly chart, and
then manage the trade using an hourly chart? Or to enter a
trade using a daily chart pattern, but then manage the trade
using a monthly chart? I personally understand the
importance of keeping time frames consistent because
when I fall into the trap of not doing so it usually costs me
money.
From my understanding, the Elliott Wave Principle is also
sensitive to the issue of time frame by attempting to identify
cycles or waves of differing degrees. By the way, this is the
totality of my knowledge of the Elliott Wave Principle.
I have discussed this idea of time framing as a
necessary precursor to introducing the signals sought and
traded by the Factor Trading Plan.
The formula for the Factor Trading Plan in its most
digested form is very simple:
Identify clearly defined weekly chart patterns
(with corresponding or supporting patterns on
daily charts), seeking trades in what may
become the best 10 examples each year of
classical charting principles as defined in
Technical Analysis of Stock Trends.
Once a possible weekly chart pattern has been
identified, attempt to establish an anticipatory
position at a stage in the pattern when the final
completion could be imminent.
Increase the leverage of a trade at that point
when the pattern in question becomes complete
by way of a breakout.
Within the context of significant trends launched
from weekly chart patterns as cited above, seek
at least one opportunity to extend or pyramid the
leverage in the trade using continuation patterns
of shorter duration.
Identify the best two or three daily chart patterns
in each monitored market each year.
Enter trades in the daily patterns when the
boundary lines of the patterns are violated by a
breakout.
Seek a very selective number of additional
trades that history has shown to have a high
probability of success over a short time frame
(two or three days).
Use a logical spot to place protective stop
orders, risking no more than four-fifths of 1
percent of assets on each trade.
Allow for trades that show immediate profits
every opportunity to grow into bigger profits.
Sounds simple, right? Of course, the demons are in the
details. Y will hopefully be exposed to these demons as
ou
my five-month trading diary unfolds.
Four Categories of Trades
The Factor Trading Plan has evolved over the years to
identify and trade seven different types of trades fitting into
four different categories.
MAJOR PATTERNS
Weekly chart patterns at least 10 to 12 weeks in duration
with corresponding daily chart patterns of the same or
slightly different configuration. The major patterns include
three types of trades:
1. Anticipatory or exploratory position—an
attempt to pre-position at or near the final high or
low of the pattern
2. Pattern completion position—the point at
which the pattern boundary is violated
3. Pyramid position—using a continuation pattern
of much shorter duration than the launching
pattern (perhaps as short in length as a three- or
four-week flag or pennant)
MINOR PATTERNS
Minor patterns include two different types of trades:
1. Continuation patterns—daily chart patterns of at
least four to eight weeks in duration
2. Reversal patterns—daily charts patterns of at
least eight to ten weeks in duration
Minor patterns do not need confirmation by weekly
charts.
INSTINCT TRADES
Instinct trades are market situations that do not fit the major
or minor pattern categories, but for which I have a very
strong instinct. These are usually very short-term trades
from which I exit quickly with a small loss if wrong, or cover
for a profit within a day or so if correct.
Over the years of my trading, I have developed a sixth
sense on when a market is vulnerable to a sudden advance
or decline of two to three days. I try not to overdo these
types of trades for fear of becoming too short term in my
overall market analysis.
MISCELLANEOUS TRADES
Miscellaneous trades are largely driven by short-term
momentum within the framework of an existing trend.
As previously stated, chart formations are always more
readily apparent with the benefit of 20/20 hindsight. But in
real time, it is more difficult to both identify and trade the
types of chart formations specified by my trading approach.
There are many times when a particular pattern fails, only
to become part of a more extensive chart construction.
Other times a chart pattern may completely fail and propel
a trend in the opposite direction.
Y other times I am correct in identifying a chart
et
formation, but the initial breakout is premature. Finally,
there are times when I have become too short term in my
orientation and what I believe is a signal does not stand up
to scrutiny in hindsight. Chart trading is an imperfect
science.
It is tough to be perfect when trading imperfect markets. It
is impossible to be right on every interpretation and then be
right on every entry. The result is that many trades become
throwaways. Even when I am dead-on in interpreting a chart
formation, it may require more than one attempt to get
successfully positioned.
Table 5.1 is the idealized construct of the Factor Trading
Plan over the course of a typical year.
TABLE 5.1 Trading Events by Category and Type of
Trading Signal
Annual Goal
Number of Attempts to Reach the
Trade Signal (Number of
Annual Goal
Successful Trades)
Major patterns
— breakout 10
(weekly
charts)
Major patterns
— anticipatory 10
(daily charts)
10 (or one
Major patterns pyramiding
— pyramiding opportunity in each
(daily charts) of the successful
trends)
20 (or one clearly
Minor patterns defined daily pattern
(continuation that works in each of
20 markets
or reversal)
monitored for this
opportunity)
Instinct trades 20
Trading situations
that made absolutely
30 patterns with an average of 1.5
entry attempts each to catch the 10
that will be successful (45 trading
events)
1.5 attempts in 20 weekly chart
pattern situations that offer the
opportunity for an anticipatory
position (30 trading events); not all
major patterns will offer this
opportunity
Two pyramid attempts in 15
developing trends (30 trading
events—includes pyramids on
trends that end up failing);
not all major signals produce
trends where pyramid
opportunities even develop
With false or premature signals,
need to take three patterns in 20
markets monitored (60 trading
events)
40 trades to gain 20 winners
that made absolutely 30 trading events, of which five
Miscellaneous no sense
may be profitable through luck
whatsoever with the
benefit of hindsight
Summarizing Table 5.1 , to accomplish the goals of the
trading operations annually, an anticipated 235 trading
events will occur, or approximately 20 per month, or eight
trading events per market per year. At an average of one
contract per trading event per $100,000 of capital, a total of
235 contracts per $100,000 of capital will be traded each
year (or 2,350 contracts per $1 million).
Built into the volume of 235 trading events represented
b y Table 5.1 is the expectation that 75 trades (or 32
percent) will be profitable over the course of a typical year
(whatever typical is). Y over a shorter period of time and
et,
number of trading events, it is possible that only 15 or 20
percent of trades may be profitable.
Bottom Liners Defined
I use a concept I refer to as bottom line trades, or bottom
liners. Imagine for a minute that I would stack into a pile the
profit-and-loss (P&L) statements for every trade I have ever
made. The stack over 30 years would be quite high (my
guess is 20 to 30 reams of paper). Next, I know what my
total net bottom line has been as a trader through the years.
Now imagine if I would remove P&L statements one by
one starting with the largest single profit, the next largest
profit and so on, in descending order. The point at which
the cumulative total of the removed P&L statements match
my net performance is termed the net bottom line trades.
As a historical average, about 10 percent of trades
represent my net bottom line. Based on the framework of
annual trading presented in Table 5.1 , about 20 trades (or
less than two per month) will establish my bottom line
during any given year. The other 215 trades each year will
wash each other out—these trades will be throwaways.
When I conduct monthly, quarterly, and annual analyses
of my trading, some of the more important metrics I look at
are:
Proportion of trades falling into each category—
and the win/loss ratio within each
The proportion of total trades that are profitable
A measure of the net bottom liners
Average profit per profitable trade and average
loss per unprofitable trade
I have laid out the key elements of the Factor Trading
Plan. But a plan is just a plan until it is implemented. Next, I
will explore matters dealing with tactical implementation.
Trade Entry
Trade entry is such a vital component that Chapter 6 is
entirely devoted to the topic. I am briefly mentioning the
component here for the sake of flow only. Examples of
actual trade entry will be found in Chapter 6.
I enter nearly all trades using stop orders, meaning that I
buy strength and sell weakness. More precisely, once a
chart pattern meeting my specifications becomes clearly
identified, I place orders to take a position in the direction
of the pattern completion—in other words, to go with a
breakout.
I have developed a number of trading rules and
guidelines over the years based on my experience of how
chart patterns are supposed to behave. These rules are not
a magic potion, but represent “best practices” to impose
discipline on myself. Without such discipline I would likely
evolve into a loose cannon and degenerate into knee-jerk
emotional market maneuvering. I find the markets
compelling. It would be extremely easy for me to lose the
forest from the trees if I do not closely monitor my trading.
Losing the forest from the trees—becoming too focused on
shorter-term patterns and lacking patience to wait for really
big patterns to develop—is my single biggest challenge as
a trader.
Trade Risk Management
Trade risk management deals with how I manage a trading
event once I have entered the trade. There are several
elements to managing a trade.
Leverage
Leverage deals with how many contracts I enter per
$100,000 unit of capital. Keep in mind that I limit my risk
per trade to eight-tenths of 1 percent and often as little as
one-half of 1 percent of assets. The leverage is determined
by the price of entry and the price of the initial protective
stop. For example, assume I enter a trade in T-bonds and
my initial risk is more than a full point (let’s say my short
entry is at 121-00 and the initial protective stop is at 12208). This represents a risk per contract of $1,250. If I traded
one contract per $100,000, the risk would equal 1.25
percent of capital, in excess of my risk management
guidelines. My main option would be to trade one contract
per $200,000 (for a risk of six-tenths of 1 percent). An
alternative would be to use a money management stop
point representing about $700 per contract and trade one
contract per $100,000 unit of capital.
Trade risk management deals with the percentage of
assets I am willing to risk in any given trade, how I
determine leverage (the number of contracts per specified
unit of capital), and where I place an initial stop-loss
protective order. These determinations guide the maximum
risk taken on any given trade.
Setting the Initial Protective Stop Price
My preference is to use the Last Day Rule to determine the
protective stop placement. See Chapter 3 for an
explanation and examples of the Last Day Rule. There are
instances when I select an initial stop that is different than
the Last Day Rule. Fully explaining these instances is
beyond the scope of this book.
Moving the Protective Stop and Exiting
a Trade