Diary of a Professional Commodity Trader Lessons from 21 Weeks of Real Trading_6 ppt
Bạn đang xem bản rút gọn của tài liệu. Xem và tải ngay bản đầy đủ của tài liệu tại đây (597.21 KB, 24 trang )
sanity as a trader.
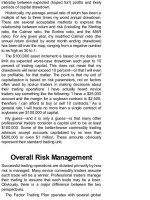
The advance on January 5 completed a two-month
symmetrical triangle. I chose to use the last full day within
the pattern, December 30, to determine the Last Day Rule.
I was stopped out on January 14 for a 67 tick loss.
FIGURE 6.17 Trades #1–3—Early Frustration in Sugar
Trading.
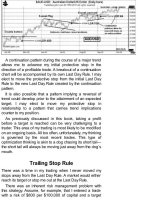
Buying New Highs
Bound and determined to be aboard a bull market, I kept
buying new highs. Normally, this is not my style. I prefer to
wait for recognizable patterns. I went long on January 26
(trade #2) and pyramided the trade when the market made
yet another new high on February 26 (trade #3). The
nosedive on March 2 took me out of both trades, costing a
total of 94 ticks. The stop on trade #2 had been moved
from the Last Day Rule of January 23 to a Retest Rule
below the low of February 19.
Waiting for a Substantial Pattern
After being burned by buying new highs, I decided to wait
for a recognizable pattern. And I got one in spades in late
April.
For decades I have been part of an e-mail network of a
dozen or so fellow chart traders. We share ideas and chart
analyses. Following is the e-mail I sent the group on April
30:
April 30, 2009
A sweet trading opportunity
The longer-term charts indicate that sugar could be
the trade for 2009. Several technical observations
are worthy of note.
The weekly chart displays a textbook perfect
symmetrical triangle dating back to March 2008. This
14-month triangle would be completed by a move
above 14.72 in the nearby July contract.
This weekly chart must be viewed in the historical
context of a possible base dating back to 1981. A
decisive close above the 2006 high at 19.75 would
establish a point and figure objective in the 60s.
The July contract today penetrated the upper ice line
of a nine-week rectangle. It is not uncommon for a
massive move to begin with the completion of a
relatively small chart pattern such as this. Daily
charts need to be combined with weekly charts,
monthly charts, and even quarterly charts to develop
a mosaic on market opportunities.
An e-mail update one day later, on May 1, 2009:
Today, the distant March 2010 contract strongly
moved above the upper boundary of a six-month
running wedge. This pattern is likely to serve as the
slingshot for the bull move in sugar. This chart
formation represents a very low-risk opportunity for a
relatively large position.
So during a two-day period all the contracts of Sugar
experienced a decisive break out (the July, October, March
and continuation charts). The daily continuation and
individual contract months provided slightly different
pictures. The July contract completed a two-month
rectangle, while the October contract completed a seven-
month running wedge (see Figures 6.18 and 6.19). October
sugar met its initial and most conservative target on June
24.
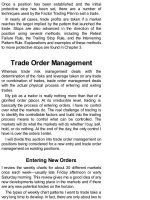
FIGURE 6.18 Trade #4—A Rectangle in July Sugar.
FIGURE 6.19 Trade #4—A Running Wedge in October
Sugar.
The weekly chart triangle is shown in Figure 6.20. It is
always a good sign when the weekly and daily charts
complete major patterns at about the same time.
FIGURE 6.20 Symmetrical Triangle Launches Bull Move in
Sugar.
Sugar was off to the races. Importantly, because sugar
was in the early stages of a bull trend, the risk was small.
The Last Day Rule risk in the July contract was 31 points,
and 38 points in the October contract. This allowed me to
assume larger leverage than is normal. The weekly chart
gave me extra courage. If there was any doubt, the large-
range upside breakout on May 1 was a Friday, a Weekend
Rule. Markets that complete a weekly pattern on a Friday
seldom fail.
The Market Pauses to Catch Its Breath
After its initial surge in May, the market drifted sideways for
about five weeks, as displayed in Figure 6.21. Then, on
June 23, the October contract generated a five-week
“fishhook” buy signal (trade #5), allowing me to pyramid my
position, again with relatively low risk to the Last Day Rule.
The target was reached on July 30.
FIGURE 6.21 Trades #5 and #6—Two Continuation
Patterns during the Bull Run.
Trade #6 is a classic pennant pattern. On July 24 the
market made a new high for the bull trend and penetrated a
three-week pennant, another opportunity to increase
leverage. Once again, the Last Day Rule was never
challenged. I had a tiger by the tail.
The weekly chart target of 21.22 was reached by the
October contract on August 10. I exited my position. I
cannot really articulate why I sometimes use daily chart
targets, sometimes weekly chart targets, sometimes swing
targets and sometimes the Trailing Stop Rule. There is no
formula for this decision. It is a matter of making a decision,
stepping up to the line and living with the consequences.
Entering a Choppy Period
By mid-August I had exited all the positions accumulated
since May 1. I was looking for an excuse to get back into
the market. I was becoming concerned that sugar was
headed for 60 cents without me aboard. The market did not
make me wait long.
But as trading would have it, I entered a four-month
period of trading frustration. It is not uncommon for markets
that have had a good run to enter a period of choppiness
and signal failure, as witnessed in Figure 6.22.
FIGURE 6.22 Trades #7 and #8—The Sugar Market
Begins a Large Consolidation.
The market completed a three-week flag on August 28
for trade #7 (see dashed boundary). My thinking at the time
was that the flag was a half-mast pattern and that the
market was headed straight to 30 cents. Prices spurted for
two days and then rolled over, stopping me out on
September 4 at the Last Day Rule. I was again out of sugar
and felt as though a good friend had died.
On September 28, the market completed what I
interpreted to be a six-week continuation diamond
formation. I returned the long side (trade #8). The Last Day
Rule stop was hit on October 7. I was once again flat.
Focused on Being Long Sugar
At this point, I became obsessed with being long sugar.
Overattention to a market most often leads to foolish
trades. Foolish trades lead to losses. Both trades #9 and
#10 were established without the benefit of completed
chart formations as shown in Figure 6.23. These trades
were driven by the fear of missing a move. Fear and greed
are two emotions that will cost a trader money.
FIGURE 6.23 Trades #9 and #10—Sugar Trades without
Clear Patterns.
Both trades were established on days sugar rallied, on
October 13 and October 30. Buying strength or selling
weakness within a trading range is not a very good idea.
Trade #9 was stopped out at the Last Day Rule on
November 27. Trade #10 was stopped out earlier, at its
Last Day Rule on November 10. Not only did I invent a
reason for these trades, I also got stubborn with my money
management, as highlighted by trade #9.
The Market Finishes the Year Strong
The sugar market finished the year well, getting back on
track on December 11. The advance on this day
penetrated the upper boundary of a 15-week channel and
completed a four-week H&S bottom, triggering trade #11
(see Figure 6.24).
FIGURE 6.24 Trade #11—A Significant Buy Signal in
Sugar.
As I have pointed out already in this book, smaller
patterns often simultaneously launch larger patterns. Once
again, the breakout was on a Friday, a significant fact. The
target was reached on December 28, although the Trailing
Stop Rule was not activated until January 11.
Table 6.2 summarizes the trading signals in the sugar
market during 2009.
TABLE 6.2 Sugar Signals and Trades in 2009
Lessons from Sugar in 2009
Unfortunately, I need to relearn some of the same lessons
year after year after year. Sugar in 2009 was a reminder
that market behavior tends to greatly lag a strong opinion I
may develop. Often, I see something big taking shape on
the charts well before a trend develops. Markets have no
obligation to immediately reward my opinion. My tendency
is to force an interpretation of the daily charts to comply
with an opinion I have developed with the weekly charts.
Two of the early trades (#2 and #3) were based on market
momentum absent recognizable chart patterns. Two of the
late trades (#9 and #10) were also based on momentum
without support from a pattern. Thus, four of the 11 trades
were questionable and should not have been entered. I
enter every New Year with a commitment to greatly
increase my patience. Perhaps some year I will achieve
that commitment.
Points to Remember
Some of the best trades are moves in the
opposite direction of a trader’s initial
expectations (such as the case in the Dow
Jones).
A trading plan must go through losing periods in
any given market to find the gems. Persistence
pays off.
Taking trades that anticipate a move can often
be frustrating. Attempting to get positioned within
a trading range can result in becoming gun shy
when the real move occurs.
Markets most often provide signals when the real
moves begin. Waiting for substantial patterns to
become complete is where the profits are to be
found.
Chapter 7
Characteristics of a Successful
Trader
Figure 7.1 is the roadmap for Chapter 7, providing a
graphic presentation of the content. In addition to the
mechanical and procedural aspects of a comprehensive
trading plan, there are also intangible components that are
indispensable to consistently successful trading operations.
I consider these components to be intangible because they
do not have direct daily connection to the physical process
of trading. While other professional traders might formulate
a different list or add to mine, I consider the intangibles to
include:
FIGURE 7.1 Characteristics of a Successful Trader.
Intimate knowledge of trading signals
Discipline and patience to execute trade signals
consistently and correctly
An information feedback loop to analyze trading
results and determine needed course
corrections
A leap of faith—the confidence to emotionally
and psychologically go “all in” on a trading plan
I have found that correctly developing these intangible
attributes and components is the largest single challenge I
face. It is a process that is never ending. It is in this area
where successful trading must overcome the pull of human
emotion. Once a trader has developed sound money
management principles for a trading plan, the war is then
fought on the playing field of the intangibles. Yet very few
authors on speculative market operations have adequately
addressed this subject area.
Intimate Knowledge of Trading
Signals
I cannot imagine what it would be like to look at a chart and
wonder if there was a trade setting up. What an awful
experience that would be! I have traded my approach long
enough that I need only a brief, five-second glance at a
chart to know if there is a trade pending for me.
In another 10 seconds with the same chart, I have a
specific idea of what would need to happen to trigger a
trading signal, what position size I would be likely to
assume, and how much risk I would take if I enter.
My experience is that other professional traders—both
those who use discretionary approaches and those who
use systematic approaches—have the same intimate
knowledge of their trading plans. They know what a signal
is for them. They know if they are following their rules
correctly because they know exactly what their rules are.
The longer I need to examine a chart, the less likely the
market in question is offering a trading opportunity. For me,
signals are patently obvious. Whether they will be profitable
is another matter.
I recommend that novice traders spend a year or two
paper-trading before they commit their first real dollar to
risk. It takes this long to come to an understanding of what
a trading signal is, how a market triggers a signal, and what
type of risk management should be used.
Trading plans evolve over time—sometimes in subtle
ways, other times in a more significant fashion. What might
be a major change in my trading plan in my mind could
appear insignificant to someone not intimately acquainted
with my plan. But the point is this—traders need to
understand why they make the trades they make, both entry
and exit trades.
Discipline and Patience
Discipline and patience are opposite sides of the same
coin. It is impossible to have trading discipline and
patience if a trader does not know exactly what does or
does not constitute a trading signal. Knowing what
constitutes a proper trading signal precedes the practices
of discipline and patience.
Whether a trade is profitable is not the measure of
whether a trade should have been made. I cannot allow
myself to be stressed out whether a certain trade was
profitable or not. Profit cannot be the direct focus of my
attention because I have no control over the outcome of any
given trade. Order entry is the only thing I can control.
I know exactly what a trade is or is not for me. My
challenge is to maintain the patience to wait for my pitch
and the discipline to swing when my pitch is offered.
Swinging at pitches outside of my sweet spot is the single
biggest source of trouble for me. Of course, swinging at a
pitch in my sweet spot is no guarantee that I will get a hit.
Inevitably, trades in which patience and discipline were not
key ingredients in the decision-making process have a far
greater propensity to be losers.
Analysis of Self and of the
Trading Plan
I am constantly studying and analyzing my trading
performance for two major reasons: to determine if my
trading plan is in sync with the markets and to determine if I
am in sync with my trading plan. The two concepts are very
different, and either can represent a real problem.
A major distinction must again be made between trading
correctly and trading profitably. It is possible to trade
correctly and not be profitable, just as it is possible to make
money during a period when the trading plan is poorly
implemented.
There have been times (weeks or months) when I have
traded very poorly, yet made money. There have also been
times when I have executed my trading plan flawlessly and
lost money. My goal is correct trading with the belief that by
trading correctly over a large number of weeks, months,
and trading events, I will experience net profitability with a
manageable amount of asset volatility. I analyze my trading
monthly, quarterly, and annually.
The first question I ask is whether my overall trading plan
was in sync with the markets. I have no interest in exploring
whether modified rules would have produced more profits. I
am not a big fan of this type of optimization. Optimization is
a fool’s game. Tweaking trading rules based on the period
of time just completed could come back to haunt a trader in
the next period of time.
I have been a private pilot since the 1980s and have
owned several aircraft over the years. Airplanes have an
instrument called the vertical speed indicator. This
instrument measures the rate of climb or descent the plane
has already experienced, and thus is a trailing indicator.
Flying according to the vertical speed indicator would
result in an airplane always being behind the curve. When I
think of optimization, I often think of the vertical speed
indicator on an airplane. The past is the past. What was
optimum in one quarter may not be optimum during the next
quarter.
Yet I am interested if the markets reveal any change of
behavior that could have permanence. No approach to
trading can be built and then left alone perpetually. All
successful trading approaches are the result of constant
evolution based on changing trading conditions.
Over the years, my trading plan has evolved to address
certain aspects of market behavior. For example, chart
patterns are less reliable today than they were 20 or 30
years ago. Pattern breakouts—even when valid—tend to
be sloppier than in distant years. The price objectives of
patterns are far less reliable today than when I started
trading the charts.
So I have made modifications to my trading approach
based on general trends dealing with market behavior. But I
have no interest in modifying my approach to optimize last
month’s or last quarter’s results.
The second and far more important question I ask is
whether my actual trading was in sync with my trading plan.
Or, as is always the case to some degree, whether I
cheated the trading plan. Traders who use a purely
mechanical system can answer this question very easily.
But I am a discretionary trader who adds complex layers of
judgment to my trading decisions. I have developed
measures—or rather a set of questions—to gauge whether
my actual trading was out of sync with my overall strategy.
These nine questions include:
1. How many trades did I make during the period?
If I make more than 16 to 18 trades in a month, I
know that I am reading too much into the charts
and accepting patterns that are too short in
duration. If I trade fewer than 10 to 12 times in a
month, I know that I am becoming gun shy and
need to adopt a less defensive posture.
2. How did the total number of trades distribute
over the categories of trade types?
3. Will all of the trades made, whether profitable or
not, stand the test of historical scrutiny? Will the
trades, both the entries and exits, stand out on a
chart a year from now as logical and reasonable?
4. Was each pattern I traded one of the four or five
best examples of classical charting principles in
the markets traded during the previous 12
months? Or did I accept a lesser chart pattern?
5. Did I enter any orders intrasession, or were the
vast majority of my trading decisions made and
orders entered during nontrading hours (late
afternoon)?
6. Was I too quick to move protective stop orders
with the goal of protecting open profits? I have
found that trading decisions should be ruled by
market behavior, not by equity fluctuations.
7. What percentage of my trades was profitable?
What proportion were “bottom liners?”
8. What was my average risk per trade? If the
average risk was outside of the band of six-tenths
of 1 percent on the low end and 1 percent on the
high end, what would have been my trade result if
the leverage of all trades had been normalized at
four-fifths of 1 percent?
9. Are there any broad money or trade
management rule rules that I need to watch in the
future for possible modification?
Every successful trader I know has developed criteria for
appraising trading performance. My own criteria cannot be
and should not be the criteria used by other traders. The
point I am making is that every successful trader must have
mechanisms in place for accountability and improvement.
I am a classical chartist. I have defined my trading
signals in fairly precise terms (length and nature of specific
pattern in question). I can easily look back in hindsight and
identify the actions I should have taken. The major question
for me is how closely my real-time trading was to what the
markets offered. I can never perfectly make this subjective
appraisal, but I have developed some metrics for analyzing
my trading on this basis.
I also study my trading on a quarterly and annual basis in
terms of how well I implemented my trading risk
management and trade management components. I
conduct some statistical analysis on these factors.
There is one more aspect to the self-appraisal of trading
that is worthy of a special note. Making foolish mistakes
can become a self-perpetuating cycle. One foolish trading
mistake can produce the next mistake, and on and on it can
go. A trader needs to learn the practice of self-forgiveness
for stupid market maneuvers. This is especially true for
discretionary traders as opposed to systematic traders
because a discretionary trading plan has more room for
emotional decision making. A time may come when a
discretionary trader feels like he is being pulled into a cycle
of poor judgment calls. When this happens (not if it
happens), a trader needs to take a hiatus from the markets.
Remember, there will be trades next month and next
quarter and next year.
It Takes a Leap of Faith
The final component is the most difficult for novice traders,
as well as for professional traders. This component deals
with the confidence to take a leap of faith and become
committed to predetermined trading operations.
I have heard many traders describe trading in the
language of war, expressing various trading concepts in
combative terms. My own experience is that trading is
much more analogous to professional sports. Professional
athletes speak openly and honestly about their need to
make a commitment to their endeavors. How often have
you heard an announcer make a statement such as, “The
athlete was in his or her zone,” “the athlete was playing with
confidence, or “the athlete was too timid on that pitch (that
jump, that race, etc.)”?
Perhaps you are a trader who has carefully thought
through all of the trading components and contingencies for
a trading plan, but have a sense of self-doubt or lack of
confidence that prevents you from making a full
commitment to your trading operations. Just as cancer and
heart disease are the two major killers in America (together
accounting for half of all deaths), doubt and second-
guessing are the two major killers of a sound trading plan.
This last component, the leap of faith, is perhaps the
component that is the biggest ongoing struggle for novice
and professional traders alike. I would be lying if I
suggested that I have it all together in this area. The leap of
faith has been defined by other traders as the upstream
swim against human nature. And indeed it is!
Every experienced trader knows when he or she
commits a trading sin. I know instinctively when I swing at a
pitch outside of my strike zone. Yet the ability to control
one’s emotions is the final hurdle a trader must clear.
Traders must daily endure the human emotions of fear,
second-guessing, greed, false hopes, self-doubt, etc. I
must focus and keep myself in a frame of mind where
implementing my game plan is all that really matters the
result—of the last trade or brief series of trades is
irrelevant. It is easy to trust a trading plan when the last 10
trades have been profitable. But being committed to a
trading plan when the past 10 trades were losses is a
horse of an entirely different color.
When I have been whipped around over a series of
trades, every fiber of my being wants to bypass the next
signal. When I have had a series of trades turn from a profit
to a loss, I have an overwhelming urge to subsequently find
an excuse for taking the first small profit the markets offer
up.
The emotional drive of fear and greed attempt to
constantly move me away from my “best practices.” If you
struggle with this aspect of your trading, you are not alone.
Points to Remember
The Factor Trading Plan consists of three major
components, each with important subcomponents:
Preliminary Components
A personality and temperament consistent with
speculative markets
Adequate capitalization
Overall risk management philosophy and
principles
Trading Components
A method to identify candidate trades
Guidelines and rules for entering trades
A framework for managing the risk in each trade
Procedures for determining how to take losses
or profits
Personal and Character Components
The intangibles of intimacy with the trading plan,
discipline and patience
An information feedback process for analyzing
results and making course corrections
The leap of faith
Part III
A Five-month Trading Diary: Let
the Journey Begin
Part III is a day-by-day, week-by-week, trade-by trade,
emotion-by-emotion, victory-by-victory, and loss-by-loss
account of my trading from December 2009 through April
2010. The time frame and dates are arbitrary and chosen
to represent a typical trading period. I begin the trading
period without having any idea whether I will be profitable.
Chapters 8 through 12 are the “month chapters”; each
represents a different month of trading. I comment on
trades in the order they are entered, on the fly, in real time.
And when I trade a specific market more than once, I
compare the entries and exits.
I attempt to explain why I enter trades, how I manage
trades, and what I think about trades after the fact. I skip
describing some trades if the comments and lessons for
the trades are redundant. However, a record of all signals
is shown in Appendix A.
I think by journaling. I have maintained a journal of my
trading endeavors since 1981. Writing helps my mind
become engaged in the trading process. I will add journal
entries, as they are interesting, revealing, or educational.
My journal entries may deal with trading techniques,
possible trades, challenges with my trading plan, the uphill
climb against my emotions, or other interesting tidbits. I
analyze my trading at the end of each month and quarter
and I will include excerpts from each analysis.
My major challenge as a trader is to translate the
components of the Factor Trading Plan into real-time
trading operations. I believe that every professional trader
knows exactly what it is that he must do to maximize
success. Doing it becomes the hurdle.
The criterion for a valid trading signal (as differentiated
from a profitable trade) is whether each entry and exit,
when plotted on a graph, can withstand scrutiny after the
fact. Recognizing chart configurations on completed charts
after the fact is a lot different than trading charts in real
time.
Bringing these two time dimensions—clearly seeing the
patterns after the fact and responding in the present—into
sync is the challenge. I cannot allow myself to read too
much into any given chart at any given time. I need to allow
charts time to fully mature.
My measure of success, or lack of the same, will be due
in large part to whether my trading rules and guidelines are
in sync with the markets. No trading approach is perfect,
and markets and trading approaches get out of sync. What
counts is whether I execute my trading rules and guidelines
correctly.
For each trade, I will cite the following items:
The market being traded
The category of trade (from Chapter )
Major pattern (breakout signal)
Major pattern (anticipatory signal or
early entry)
Major pattern (pyramid signal, a
continuation pattern in an ongoing
move)
Minor reversal or continuation signal—
patterns on daily charts without
confirmation from weekly graphs
Instinct trade
Miscellaneous trade (driven largely by
short-term momentum or other
factors). These trades largely respond
to what chart pattern might develop as
opposed to chart patterns that have
already been completed.
The pattern identified
The exit rule used (from Chapters and)
Last Day Rule (or Last Hour Rule)
Retest Failure Rule
Trailing Stop Rule
Target
Intervening pattern—one that resets
the Last Day Rule or indicates a
reversal of trend
Other
I will also include a chart or two of each completed trade
with notations as appropriate.
Do I have any expectations as I begin this process? Well,
yes! Remember, I am a conservative trader—the leverage I
use today is one-third the leverage I used during most of my
trading career. I am far more risk averse than I was in
decades past. The exact leverage I use on any given trade
will depend on the degree of confidence I have with a
specific signal and on the risk inherent in how the breakout
occurs.
Remember, the Factor Trading Plan is not designed to
turn $10,000 into a million. My goal is a consistent double-
digit annual rate of return with limited capital volatility.
During tough periods, I scale my leverage back even
further. I increase my leverage (or “gearing,” as some
foreign traders call it) when the markets start to click. I am
sure that experienced Las Vegas gamblers would tell me I
do it the wrong way around—that I should leverage up
through a string of bad trades and leverage down during a
profitable period.
The trading leverage used by the Factor Trading Plan is
very conservative. Many readers may be shocked at the
limited leverage I employ. As a trader, I think in terms of
units of $100,000. I refer to each unit of $100,000
throughout the journal as a trading unit. Leverage, or
number of contracts, is expressed in relationship to the
$100,000 trading unit.
For example, I may state that I bought or sold one-half of
a contract per trading unit. This would equate to one
contract for each $200,000. In the forex markets, the
reference will be to the leverage taken in the trade. If I state
that I shorted 35,000 GBP/USD per trading unit, this means
that I went short 35,000 pounds per $100,000 of trading
capital.
I will be in hog heaven if I achieve a rate of return of 10 to
15 percent during the next five months. If the markets do not
cooperate, or if I poorly implement my game plan, then
keeping my capital intact may be the best I can expect.
A significant concern as I start this real-time trading diary
experience is that I trade best when I remain detached from
the markets. I have the tendency to overread the charts if I
am too close to intraday price behavior.
Writing this book may force me into much closer contact
with the markets than I would prefer. I wonder how this could
affect my ability to exercise my craft, but it will give me an
opportunity to share my emotional journey as well as my
trading experiences.
With a plan in place and my worries laid bare, let the
games begin!
Chapter 8
Month One
December 2009
Ientered December 2009 quite frustrated by my trading
performance during the previous two months. October and
especially November were beastly months for me. There
are just certain times during a year when I cannot buy a
good trade.
Consider this awful fact: Of a series of 27 trades during
October and November, 24 were liquidated at a loss and
only three at a profit. (However, I did carry a number of
profitable open trades into December.) Being profitable on
only 9 percent of trading events is well beyond a statistical
aberration. Yet, being wrong on 90 percent of my closed
trades resulted in a trading loss of only a few percent of my
capital. Over the history of my trading, I have been
profitable in approximately one-third of trading events.
If you are unacquainted with futures trading, you may be
shocked that I expect to be right only one-third of the time.
After all, shouldn’t a trade have at least a 50/50 chance of
making money? Remember, I use relatively tight protective
stops. I generally enter trades that offer $3 for every $1 risk.
With a $3 to $1 risk/reward ratio, the 50/50 probability
does not apply.
Additionally, over any smaller series of trading events, I
could be profitable in as few as 10 to 20 percent of trades.
A statistical formula dealing with a random distribution of
sequential profits or losses for a trading approach with a
33/66 percent long-term win/loss ratio can determine the
odds of encountering an extended losing or winning streak.
The probability data can be plotted on a bell curve or
distribution table.