Diary of a Professional Commodity Trader Lessons from 21 Weeks of Real Trading_10 pot
Bạn đang xem bản rút gọn của tài liệu. Xem và tải ngay bản đầy đủ của tài liệu tại đây (874.43 KB, 24 trang )
significant. The upside completion of the channel on
February 25 also climbed back above the
support/resistance line. The pattern target of the channel
was 9002, quickly reached on March 1.
Summary
February was a nonevent. Sixteen signals were entered
during the month in 11 different markets. Of the 16 trades
entered, seven were closed at a profit and 10 at a loss
(although not all in February)—a profit ratio of 43 percent.
The distribution of trades by category was close to the
amended benchmarks. The trades entered in February
were closed at a gain of 0.9 percent. On a marked-to-the-
market Value Added Monthly Index (VAMI) basis, February
experienced an actual loss of 1.23 percent. The difference
reflects the fact that the VAMI calculation marks all
positions to the market at the end of a month whether the
trades were carried in from previous months or not closed
until later months. Table 10.1 shows the distribution of
trades entered in February by signal category.
TABLE 10.1 February Trading Signals by Category
Amended February Trade Entries
Signal Category Benchmarks (# and % of total)
Major patterns
Completions 4.0 (29%) 4.0 (25%)
Anticipatory 1.5 (11%) 2.0 (13%)
Pyramid 1.5 (11%) 0 (0%)
Minor patterns 4.0 (28%) 6.0 (38%)
Instinct trades 2.0 (14%) 1.0 (6%)
Miscellaneous trades 1.0 (7%) 3.0 (19%)
Total 14.0 (100%) 16.0 (100%)
February and several previous months lacked the
“bottom liners” discussed in Chapter 5. About 10 percent of
my trades historically have produced my net bottom line.
These are the really profitable trades, each returning at
least 2 percent return on capital. The remaining 90 percent
of trades historically have been washes. Without the bottom
liners my trading is reduced to just trades that wash each
other out. Each month, the Factor Trading Plan needs a
couple of really profitable trades, properly leveraged, to
produce the desired results.
Chapter 11
Month Four
March 2010
The market is a great teacher! It also delivers chastisement
in large doses. I have always known that there were flaws in
the Factor Trading Plan; trading is a process of uncovering
flaws and attempting to fix them . . . only to find more flaws.
The Factor Trading Plan is no different than any other
approach. Every consistently successful trader spends time
diagnosing and applying fixes to flaws. Two steps forward,
one step back! On and on it goes!
The interesting thing about the markets is that the flaws
are never visible during the good months and good years.
Good times provide cover for the deficiencies of a trading
plan.
During tough times (i.e., drawdown periods), markets
have a way of exploiting flaws in a trading plan. I know
many traders who become very introspective during the
drawdown periods as they attempt to figure out ways to
improve their approach. The first step to improve an
approach is to identify the flaws.
The challenge is to find the fundamental flaws, not just to
make changes that would have optimized trading during the
drawdown phase. Simulation and optimization of
combinations of technical indicators is something anybody
can perform with any number of trading and analysis
platforms. I contend that this type of optimization produces
very little lasting fruit. Trade identification, at the end of the
day, is less important than risk management and the human
element.
I am in a drawdown period at this point in my trading
journal. Not severe, but definitely a hindrance. I don’t like
losing. I also don’t like not winning. My trading plan has
always emerged from prolonged periods of treading water
with changes, sometimes subtle, sometimes more
significant. Almost always the changes have dealt with
trade and risk management, not with trade identification.
I am on the scent of some fundamental flaws in my
trading approach, which will be discussed in more detail in
the concluding chapters of this book.
Trading Record
I entered 16 trading events in 12 different markets during
March. Three of these trades were discussed in previous
chapters (two gold trades in Chapter 9 and a GBP/USD
trade in Chapter 10). These trades discussed earlier will
not be covered in Chapter 11.
USD/CAD: Remaining Persistent with a
Pattern
Signal Types: Major Anticipatory Signal,
Major Breakout Signal, Major Breakout Signal
(Secondary Completion)
I entered three trades in March in the U.S.
dollar/Canadian dollar (USD/ CAD). While each trade had
its own specific rules and risk management strategy, I
considered all three to be part of the same trading
campaign.
Figure 11.1 displays what I saw as the dominant chart
development in the forex pair, a five-month descending
triangle. This pattern is a prime candidate for the 2010
Best Dressed List.
FIGURE 11.1 Five-Month Descending Triangle on the
Weekly USD/CAD Graph.
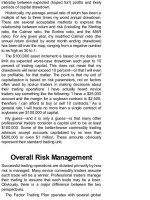
Figure 11.2 shows the trades in this market on a daily
chart. I shorted the market on March 3 based on what I
perceived to be a triangle dating to the January low. This
was a major anticipatory signal. I sold 50,000 USD/CAD
per trading unit.
FIGURE 11.2 Descending Triangle on the Daily USD/CAD
Chart.
The decline on March 12 penetrated the lower boundary
of the dominant five-month descending triangle. I shorted
another 50,000 USD/CAD, increasing my total position to
short 100,000 USD/CAD per trading unit. I used the Last
Day Rule from March 11 to set a protective stop and
subsequently lowered the stop on March 22 to 1.0256. On
March 24, the market rallied back into the descending
triangle, stopping me out of half of my position. I moved the
protective stop on my remaining position based on the
Retest Failure Rule. I was stopped out on March 26.
I have a provision in my trading rules for reentering a
position in markets that display a significant weekly chart
pattern. The reentry guidelines dictate that one of two things
must occur to reestablish a position:
1. The market must recomplete the pattern and
penetrate the price extreme high or low
established during the initial breakout. Under this
criterion, the USD/CAD needed to trade below
the March 19 low at 1.0062.
2. Under the second criterion, the market must
recomplete the pattern on a closing price basis.
On March 29, the market closed back below the lower
boundary of the dominant descending triangle. I
reestablished a short position of 30,000 USD/CAD with a
risk of one-half of 1 percent. The March 29 high at 1.0273
became the new Last Day Rule. (This position remained
open on April 20 when the diary for this book closed.)
May Soybeans: Small Patterns Continue
to Haunt Me
Signal Type: Miscellaneous Trade
On March 4, I shorted soybeans based on the completion
of a three-week continuation H&S pattern. This trade fit into
the miscellaneous category. I quickly exited the trade (on
March 8), taking a loss of three-tenths of 1 percent (see
Figure 11.3). (I am embarrassed to admit to trades such as
this, but I want this book to provide full disclosure—warts
and all.)
FIGURE 11.3 Three-Week H&S top in May Soybeans
Quickly Fails.
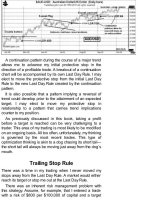
May Mini Crude Oil: Rising Wedge
Illustrates Difficulty with Diagonal
Patterns
Signal Type: Major Anticipatory Signal
I have already discussed my overall bearish perspective
for crude oil. The decline on March 12 completed a major
pattern anticipatory sell signal in the way of a six-week
rising wedge. This trade was made on a Friday, and I went
home feeling like I had a real winner. On Monday, the
market followed through. More confidence (see Figure
11.4)!
FIGURE 11.4 Six-Week Rising Wedge on Crude Oil Chart.
The textbook understanding of the rising wedge calls for
a swift and uninterrupted price decline. Yet on March 16,
the market reversed strongly to the upside. I jammed my
stop because such a strong rally is uncharacteristic of the
rising wedge pattern. I was stopped out on March 17.
AUD/CAD: A Triangle Causes Multiple
Losses
Signal Types: Instinct Trade, Major
Anticipatory Signal, Major Breakout Signal,
Minor Breakout Signal.
These were trades spanning two months, presented in
this chapter to provide a context for repeated attempts to
exploit a chart development.
The Australian dollar/Canadian dollar (AUD/CAD) is a
textbook example of the comedy of errors that can occur
when a symmetrical triangle works its way too far toward
the apex. Because prices had traveled beyond two-thirds to
three-fourths of the way to the apex, I should have ignored
this pattern. Instead, I got whiplashed by a series of signals.
This market spun me like a top.
As shown in Figure 11.5, the dominant pattern was a
possible three-month symmetrical triangle. The upper
boundary, when extended back in time, connected with the
November high.
FIGURE 11.5 Sloppy Breakouts Occur with Three-Month
Triangle in AUD/CAD.
Within the larger three-month triangle, a three-week
triangle formed in mid-March (see Figure 11.6). I used this
smaller three-week triangle to get a head start on the trade
and shorted the breakout on March 19. This was an instinct
trade. This thrust was short lived and the market quickly
reversed, stopping me out for a day-trade loss of 0.007
percent.
FIGURE 11.6 Daily Chart of AUD/CAD Displays
Treacherous Trading Conditions.
The market then rallied, and on March 30 actually
penetrated the upper boundary of the triangle. I viewed this
as a possible bull trap. I shorted the market on March 31
when prices traded below the March 30 low. My hope was
that I was getting short near the upper boundary. This was a
major breakout anticipatory signal.
On April 5, the market surged through the lower boundary
of the triangle, closing below the March low. This was a
major completion signal. I added to the position and
thought I had a great trade pending. However, the market
reversed the next day and stopped me out of my entire
short position on April 7.
Then, on April 9, the market rallied through the upper
boundary of the triangle and penetrated the March 30 high. I
thought that this was a classic “end-around” minor
completion buy signal. I went long. The market reversed the
very next day, April 12, and once again I was whiplashed by
this forex pair. Four frustrating trades based on the same
chart construction!
Looking Back
The major lesson to be learned is that triangles are not valid
when prices work too far toward the apex. This does not mean
that I should not attempt the first breakout, but that if the first
breakout fails I need to cross the market off my pending trade
list.
EUR/USD: A Classic H&S Failure Pattern
Signal Type: Minor Pattern Continuation
The EUR/USD experienced a substantial bear trend from
the November high into the February low as shown in
Figure 11.7.
FIGURE 11.7 A Small H&S Bottom Failure Is Triggered in
EUR/USD.
Figure 11.8 is a blow up of Figure 11.7. From February 5
to mid–March, the market appeared to forming a complex
H&S bottom or rounding pattern. On March 12, the market
nicked a 15-week trend line. I suspected a bull trap.
FIGURE 11.8 Bull Trap Precedes H&S Failure in
EUR/USD.
I shorted the market on March 19 when the H&S failure
was confirmed. I could have taken the short a day earlier on
March 18. The target of the pattern was 1.3223. The market
failed to reach its target and turned up on March 26, closing
above the March 25 low. This was a setup for the Trailing
Stop Rule. This rule was triggered on the open of March 29.
I exited the short trade for a small profit.
June T-Bonds: Yet Another H&S Failure
Signal Type: Major Anticipatory Signal
As cited in previous chapters, I was looking for an
opportunity to short this market at the late stage of the right
shoulder of a possible 12-month H&S top (see Figure
9.3A-C in Chapter 8). I was interpreting the weekly chart
from a bearish perspective.
Note in Figure 11.9, the daily June T-bond chart was
forming a possible nine-week inverted H&S bottom
formation. The market attempted to climb above the ice line
on March 18, but could not hold the rally. Suspecting a H&S
failure in the making, I entered a sell stop below the March
19 low and was stopped into a short position on March 24
at 117.02. My position was short one-half a contract per
trading unit.
FIGURE 11.9 T-Bonds Turn Down at the Neckline.
I was stopped out of the trade on April 12 based on the
Trailing Stop Rule.
May Wheat: A Sustained Decline in
Wheat Continues to Frustrate Me
Signal Type: Minor Continuation Signal
The H&S top completed in mid-January had an unmet
target of 426. After chopping sideways from early February
through mid-March, the market thrust into new lows on
March 25, as seen in Figure 11.10. I went short at 470.50
with a Last Day Rule of 478.25 and a target of 426. I
established an underleveraged position of 0.5 contracts
per trading unit. I was stopped out on April 7 based on the
Last Day Rule.
FIGURE 11.10 New Lows in Wheat.
Is There a Best Time of Day to
Establish a Trade?
The answer to this question is “yes!” Intraday trading is very
deceptive. A trader can be misled by price leaps and dives
during the trading session. It is quite easy to believe a chart
pattern is destined to be completed based on intraday action,
only to be disappointed by the end of the day. Just as I cannot
predict the next short-, intermediate-, or long-term price trend in
a market, I especially cannot predict how a market will close
based on its intraday price behavior.
The single most important price of the day is the closing price,
posted midafternoon each day. This is the price at which
position traders, as opposed to day traders, are willing to hold
a position overnight. Even though I often enter and exit a
position intraday, the closing price is the only one that really
matters. Everything else is noise.
May Corn: A Stair-Stepping Decline
Signal Type: Minor Continuation Signal
The May corn trade mirrors the May wheat trade. The
daily chart had a target of 344 from the three-month triangle
completed on January 13. After drifting sideways through
most of February and March, the market made a new low
on March 25, as shown in Figure 11.11. This new low
completed a descending triangle dating back to the early
March high.
FIGURE 11.11 Corn Fails to Follow Through After New
Lows.
I established a short position. The pattern target from the
three-month triangle was met on March 31. However, I
elected to go with a swing target, assuming that the drop
from the March 1 high would equal the January decline.
This swing target was also in the area of the September
2009 low.
The market experienced a retest rally on April 7. I was
stopped out of the trade on April 14 based on the Retest
Failure Rule.
November Soybeans: A Bear Trap
Signal Type: Minor Continuation Signal
The decline (in the first 15 minutes of pit trading) on
March 31 penetrated the lower boundary of an eight-week
continuation symmetrical triangle. This breakout proved
quickly to be a one-day-out-of-line movement. I recognized
it as such and exited the trade quickly (see Figure 11.12).
FIGURE 11.12 Symmetrical Triangle in November
Soybeans.
This pattern highlights the fundamental problem with
diagonal patterns, to which symmetrical triangles belong. It
is possible for prices to penetrate a diagonal boundary line
without clearing the previous high or low within the pattern.
This is part of the reason I prefer to trade breakouts from
horizontal boundary lines.
May Copper: An Easy Trade I Missed
Signal Type: Missed Trade
I keep a record of patterns that I miss. There are usually
two such patterns per month. I usually miss them because I
am biased in the other direction, not because I do not see
them. Sometimes I miss a trade only to see it a day or two
later. In late March, I had a bias toward the short side of
copper. I thought the February to March rally was a test of
the January high. I also saw a possible four-week
descending triangle forming. Right-angle triangles are
usually resolved by a breakout through the horizontal
boundary.
As shown in Figure 11.13, a small nine-day symmetrical
triangle formed at the end of the descending triangle. The
advance on March 26 completed the symmetrical triangle
and set up the violation of the descending triangle on March
29. I could have established a long position on either March
26 or March 29. This was a nice four-week continuation
pattern.
FIGURE 11.13 Triangle Propels Copper Prices Higher.
Looking Back
Missed trades bring forth a very important point. Patterns that
are fully mature and ready to launch a trend more often than not
provide an opportunity for breakout traders to go in either
direction. In fact, a condition of a mature pattern is that logical
breakout stops are self-evident on both sides of the pattern. To
take this a step further, unless a market can be “bracketed”
with breakout orders to go either long or short, then one might
with breakout orders to go either long or short, then one might
question the legitimacy of either order.
May Orange Juice: An “End-Around”
Triangle Failure
Signal Type: Minor Continuation
Finally, I will point out a trade I took for my proprietary
account but not for the pool because of the extreme
illiquidity of the market. The decisive breakout on March 1
completed an eight-week symmetrical triangle. This pattern
should have propelled the market to at least 170. Note that
prices moved to the apex of the triangle before breaking
out. Symmetrical triangles that move three-quarters or more
toward the apex cannot be trusted. As shown in Figure
11.14, this triangle did not even reach the January high
before performing an end-around.
FIGURE 11.14 A Classic End-Around in Orange Juice.
Summary
March was the toughest month since November with a
negative performance of 3.7 percent, marked-to-market
Value Added Monthly Index (VAMI) method. Of the 16
trades entered in the month, only four, or 25 percent, were
profitable, for a net loss (closed trade basis) of 2.5 percent.
One trade (USD/CAD) remained open. None of the closed
profits was in the “bottom liners” category.
Table 11.1 lists the category of entry signals for March.
TABLE 11.1 March Entry Signals by Category
Amended March Trade Entries
Signal Category Benchmarks (# and % of total)
Major patterns
Completions 4.0 (29%) 2.0 (12%)
Anticipatory 1.5 (11%) 4.0 (29%)
Pyramid 1.5 (11%) 1.0 (6%)
Minor patterns 4.0 (28%) 7.0 (41%)
Instinct trades 2.0 (14%) 1.0 (6%)
Miscellaneous trades 1.0 (7%) 1.0 (6%)
Total 14.0 (100%) 16.0 (100%)
Chapter 12
Month Five
April 2010
This is the final diary chapter in Part III of Diary of a
Professional Commodity Trader. The performance during
the first 18 weeks was not as stout as I would have liked,
but that is part of trading. There are losing trades, losing
weeks, losing months, and even losing years.
Of the top 20 professional trading firms during the past
five years (based on my analysis of risk-adjusted
performance), there were a total of 17 losing years among
them, or 17 percent of the total combined years (20 trading
firms times 5 years equals 100 years of trading). This
means that nearly one in five years was a net loser for the
group. Even though the average losing year was small (a
few percentage points), a losing year is a losing year.
In the opening paragraphs of Part III of this book, I stated
that, “I will be in hog heaven if I achieve an actual rate of
return of 10 to 15 percent during the next five months.”
Entering April, my performance since December 7, 2009
(the start of the diary) was a gain of 5 percent-plus (closed
trades only). This equated to 12 percent-plus annualized.
With one month to go, my original goal was beyond reach
unless early April offered some great surprises. But I was
not shocked by the performance since December, since I
had but a small handful of “bottom liners.” These trades are
an absolute necessity to reach profit my goals.
Some novice traders who fall behind their expectations
adopt the attitude of “doubling up to catch up.” I am not
tempted to do this. There are ups and downs in the net
asset value of all trading operations. Taking additional risk
is the way to ruin, not recovery.
Had this book been written in any other five-month period
of time, the results could have been drastically different—
perhaps better, perhaps worse. There is no magic crystal
ball in commodity and forex trading. The best a trader can
do is to develop trading principles and guidelines that
provide a slight edge—and then attempt to exploit this
edge over time. This concept of “edge” cannot be
overemphasized.
Most Las Vegas gaming facilities pay around 95 to 97
cents on the dollar in their slot machine operations. This
means that the “house” has a very slight edge on any given
pull of the slot machine arm. It is just as likely for a gambler
to win as to lose in a single-pull slot machine event. The
“house” is betting that the slight edge, employed over
thousands and thousands of pulls, will produce a net profit.
But for any given pull, the edge is almost meaningless.
Trading operates on the same principle. I have
developed a method of selecting trades, entering trades,
and managing trades—all within an overall risk
management construct—that I believe provides me an
edge. It is this edge that I attempt to exploit. Over any given
trading event or small series of trading events, and during
any given week or month, the edge may not provide a net
profitable result.
It has been a tough 12- to 15-month period for the wider
community of commodity and forex trading operations.
Using some of the most widely followed Commodity
Trading Advisor indices (Stark, MAR, Barclays, Lyxor) as
proxies, trading operations have lost money net in the past
year. In fact, according to the Barclays CTA Index, 2009
was the first losing year for commodity and forex trading
operations in the past 10 years, and only the fourth losing
year since 1980.
In light of the historical gains in the global stock markets
in 2009, commodity and forex investments seem quite
unattractive. Yet go back to the book’s introduction and
look at the chart in Figure I.4 to gain a historical
perspective on commodities/forex as an asset class
compared to the U.S. stock market.
As a trader who understands speculative endeavors, I
would place my own personal assets with a solid
commodity manager over a stock mutual fund manager any
day of the week. On a risk-adjusted basis, my saddle will
go on the commodity horse.
Relying on Classical Charting
Principles
Chart patterns of any time duration (yearly, quarterly,
monthly, weekly, daily, hourly) are comprised of numerous
patterns of shorter duration that fail to generate the implied
move. For example, a four-month weekly chart pattern will
consist of numerous daily patterns that appeared to be
legitimate at the time of their formation but failed to deliver.
In turn, the daily formations are comprised of numerous
hourly chart formations, some of which produced a move to
their implied targets, many more of which failed.
Patterns that produce significant trends are easy to see
after the fact. Similar patterns that fail and blend into longer
patterns are much more difficult to isolate after the fact.
Classical charting principles are fluid. Patterns are
constantly evolving and becoming redefined.
Chart traders are faced with two options:
1. Develop an uncanny sense for when a chart
formation will mature and become fruitful—and
attempt to postpone trading activity until a pattern
is ready to work, somehow eliminating or greatly
reducing trading activity on the patterns that will
fail. This challenge is primarily one of
extraordinary patience.
2. Trade all clearly defined patterns, using sound
money management, knowing that the vast
majority of these patterns will fail and become
components of a larger chart structure or become
part of a chart that cannot be defined by classical
charting principles.
Some technicians believe that they can use their
technical techniques to continually get a handle on the
markets. I think this is foolish thinking that serves better as
promotional sound bites than as the basis for real-time
trading operations.
I want to remind chartists that many price charts cannot
be understood based on classical principles or other
technical tools. Many substantial trends occur without being
launched by chart patterns that are definable.
Obviously, the first option—that of trading only markets
that are ready to trend immediately—would be the most
profitable and least frustrating. The question is whether the
option is realistic for all chart traders. For some traders with
an extreme ability for patience, the first option may be
partially achievable. For most chartists, the second option
is probably the most realistic.
Trading Record
June Gold: Several Months of
Confusion Are Resolved with an H&S
Bottom
Signal Type: Major Anticipatory Signal, Major
Breakout Signal
I last covered gold in Chapter 9, where I leapt ahead to
track my gold trades covering several months. I discussed
in that chapter the frustrations when a chart goes through a
period of redefinition.
The advance in early October 2009 completed an 18-
month inverted continuation H&S bottom pattern. See the
weekly gold graph in Figure 12.1. There were several ways
to draw the neckline on this chart. I always prefer to draw a
horizontal boundary that best fits the highs or lows in
question. This pattern has an unmet target of 1350. My bias
is to trade a market in the direction of an unmet target on
the weekly and monthly charts. But, remember, targets are
not sacred. I have seen some chart traders become wiped
out waiting for a target to be reached.
FIGURE 12.1 Another Look at the Inverted H&S on the
Weekly Gold Graph.
Last month (March), the dominant pattern in gold was the
possible four-month inverted H&S pattern on the daily June
gold contract, as shown in Figure 12.2. This same chart
was also featured as Figure 9.25 in Chapter 9. The
advance on April 1 penetrated the upper boundary of a
channel that constituted the right shoulder of this daily H&S
formation. I went long one mini contract per trading unit at
this breakout.
FIGURE 12.2 Four-Month H&S Bottom on the Daily Gold
Chart.
The advance on April 7 completed the four-month H&S
bottom. This pattern had an initial target of a retest of the
December 2009 high at 1230. My thinking was that this
H&S pattern could propel the market to the 1350 target
initially set by the weekly H&S pattern completed as shown
in Figure 12.1. I increased my leverage. I really thought I
had a good trade on the books.
The market retested the neckline on April 13. Then, on
April 16, gold prices cascaded, stopping me out of my
position with the Last Day Rule. While as of this writing I am
flat, I believe the H&S bottom will propel prices much
higher.
EUR/GBP: A Questionable Buy
Signal Type: Miscellaneous Trade
This and the following trade in euro/Japanese yen
(EUR/JPY) represent opposite sides of the same coin.
Both trades deal with the concept of pattern retests and
how signals are generated relative to such retests.
On April 5, the euro/British pound (EUR/GBP) declined
to a price that had been serving alternatively as a support
and resistance zone (Figure 12.3). I discussed this support
and resistance line in Chapter 10; see Figure 10.18. As an
instinct trade, I established a long position. I felt that the
trade was extremely low risk, that I could use the low of
April 5 as a protective stop based on the Retest Failure
Rule. I was stopped out the next day.
FIGURE 12.3 Alternating Support and Resistance Line in
EUR/GBP.
Looking Back
Trades such as this remind me of catching a falling knife. This
was not a breakout trade. The market had been in a free fall
prior to my purchase. In fact, in hindsight I can see that a
bearish horn (or sloping) top was completed on the same day
of my long entry. At a minimum, I should have waited for at
least a one-day reversal before attempting a long-side trade.
EUR/JPY: Market Becomes Tricky
around Important Ice Line
Signal Type: Major Breakout Signal—
Recompletion
Just as I bought the EUR/GBP at the retest of a support
zone, I shorted the EUR/JPY relative to its line of
support/resistance. As shown in Figure 12.4, the rally in
early April retested a major rounding top on the weekly
graph. I viewed this as a shorting opportunity.
FIGURE 12.4 Retest of Rounding Top on the Weekly
EUR/JPY Chart.
The daily chart (Figure 12.5) shows that the retest
actually climbed above the ice line of the weekly chart top
for three days in early April. Then, on April 6, the market
experienced a sharp decline below the ice line. This
represented a sell signal because the original pattern was
recompleted on a closing basis. I should have shorted the
close on April 6, but I did not have an order in place.
FIGURE 12.5 Retest of Top on the Daily EUR/JPY Graph.