The Fast Forward MBA in Finance_3 doc
Bạn đang xem bản rút gọn của tài liệu. Xem và tải ngay bản đầy đủ của tài liệu tại đây (288.07 KB, 23 trang )
would be caused by the issue of additional common stock
shares under terms of management stock option plans and
convertible securities (plus any other commitments a business
has entered into that requires it to issue additional stock
shares in the future). Both basic EPS and diluted EPS (if appli-
cable) are reported in the income statements of publicly
owned business corporations. The diluted EPS is a more con-
servative figure on which to base market value.
MARKET VALUE RATIOS
The capital stock shares of more than 10,000 business corpo-
rations are traded on public markets—the New York Stock
Exchange, Nasdaq, and other stock exchanges. The day-to-
day market price changes of these shares receive a great deal
of attention, to say the least. More than any other factor, the
market value of capital stock shares depends on the earnings
per share performance of a business—its past performance
and its future profit potential. It’s difficult to prove whether
basic EPS or diluted EPS is the driver of market value. In
many cases the two are very close and the gap is not signifi-
cant. In some cases, however, the spread between the two
EPS figures is fairly large.
In addition to earnings per share (EPS) investors in stock
shares of publicly owned companies closely follow two other
ratios: (1) the dividend yield ratio and (2) the price/earnings
ratio (P/E). The dividend yield and P/E ratios are reported in
the stock trading tables published in the Wall Street Journal,
which demonstrates the importance of these two market value
ratios for stock shares.
Dividend Yield Ratio
The dividend yield ratio equals the amount of cash dividends
per share during the most recent, or trailing, 12 months
divided by the current market price of a stock share. The divi-
dend yield ratio is the measure of cash income from a share of
stock based on its current market price. The annual return on
an investment in stock shares includes both the cash divi-
dends received during the period and the gain or loss in mar-
ket value of the stock shares over the period. The calculation
53
INTERPRETING FINANCIAL STATEMENTS
of the historical rate of return for a stock investment over two
or more years and for a stock index such as the Dow Jones 30
Industrial or the Standard & Poor’s 500 assumes that cash
dividends have been reinvested in additional shares of stock.
Of course, individual investors may decide not to reinvest
their dividends. They may spend their dividend income or put
the cash flow into other investments.
Price/Earnings Ratio
The market price of stock shares of a public business is
divided by its most recent annual EPS to determine the
price/earnings ratio:
= price/earning ratio, or P/E
Suppose a company’s stock shares are trading at $60.00
per share and its EPS for the most recent year (called the
trailing 12 months) is $3.00. Thus, its P/E ratio is 20. By the
way, the Wall Street Journal uses diluted EPS to report P/E
ratios in its stock trading tables. Like the other ratios dis-
cussed in this chapter, the P/E ratio is compared with indus-
trywide and marketwide averages to judge whether it’s too
high or too low. I remember when a P/E ratio of 8 was typical.
Today P/E ratios of 20 or higher are common.
The stock shares of a privately owned business are not
actively traded, and thus the market value of its shares is diffi-
cult to ascertain. When shares do change hands occasionally,
the price is usually kept private between the seller and buyer.
Nevertheless, stockholders in these businesses are interested
in what their shares are worth. To estimate the value of their
stock shares, a P/E multiple can be used. In the example, the
company’s EPS is $3.75 for the most recent year (see Figure
4.1). Suppose you own some of the capital stock shares and
someone offers to buy your shares. You could establish an
offer price at, say, 12 times basic EPS, which is $45 per share.
The potential buyer may not be willing to pay this price, of
course. Or he or she might be willing to pay 15 or even 18
times EPS.
Current market price of stock share
ᎏᎏᎏᎏᎏᎏ
Earnings per share (either basic or diluted EPS)
FINANCIAL REPORTING
54
TEAMFLY
Team-Fly
®
DEBT-PAYING-ABILITY RATIOS
If a business cannot pay its liabilities on time, bad things can
happen. Solvency refers to the ability of a business to pay its
liabilities when they come due. Maintaining solvency (debt-
paying ability) is essential for every business. If a business
defaults on its debt obligations it becomes vulnerable to legal
proceedings by its lenders that could stop the company in its
tracks, or at least seriously interfere with its normal opera-
tions.
Therefore, investors and lenders are very interested in the
general solvency and debt-paying ability of a business.
Bankers and other lenders, when deciding whether to make
and renew loans to a business, direct their attention to certain
solvency ratios. These ratios provide a useful profile of the
business for assessing its creditworthiness and for judging the
ability of the business to pay its loans and interest on time.
Short-Term Solvency Test: The Current Ratio
The current ratio is used to test the short-term liability-paying
ability of a business. The current ratio is calculated by divid-
ing total current assets by total current liabilities. From the
data in the company’s balance sheet (Figure 4.2), its current
ratio is computed as follows:
= 2.08 current ratio
The current ratio is hardly ever expressed as a percent
(which would be 208 percent in this case). The current ratio is
stated as 2.08 to 1.00 for this company, or more simply just as
2.08. The general expectation is that the current ratio for a
business should be 2 to 1 or higher. Most businesses find that
their creditors expect them to maintain this minimum current
ratio. In other words, short-term creditors generally prefer
that a business limit its current liabilities to one-half or less of
its current assets.
Why do short-term creditors put this limit on a business?
The main reason is to provide a safety cushion for payment of
its short-term liabilities. A current ratio of 2 to 1 means there
is $2 of cash and assets that should be converted into cash
during the near future to pay each $1 of current liabilities that
$12,742,329 current assets
ᎏᎏᎏᎏ
$6,126,096 current liabilities
55
INTERPRETING FINANCIAL STATEMENTS
come due in roughly the same time period. Each dollar of
short-term liabilities is backed up with two dollars of cash on
hand plus near-term cash inflows. The extra dollar of current
assets provides a margin of safety.
In summary, short-term sources of credit generally demand
that a company’s current assets be double its current liabili-
ties. After all, creditors are not owners—they don’t share in
the profit success of the business. The income on their loans is
limited to the interest they charge. As creditors, they quite
properly minimize their loan risks; they are not compensated
to take on much risk.
Acid Test Ratio, or Quick Ratio
Inventory is many weeks away from conversion into cash.
Products usually are held two, three, or four months before
being sold. If sales are made on credit, which is normal when
one business sells to another business, there’s a second wait-
ing period before accounts receivables are collected. In short,
inventory is not nearly as liquid as accounts receivable; it
takes a lot longer to convert inventory into cash. Furthermore,
there’s no guarantee that all the products in inventory will be
sold, or sold above cost.
A more severe test of the short-term liability-paying ability
of a business is the acid test ratio, which excludes inventory
(and prepaid expenses also). Only cash, marketable securities
investments (if the business has any), and accounts receivable
are counted as sources available to pay the current liabilities
of the business. This ratio is also called the quick ratio because
only cash and assets quickly convertible into cash are included
in the amount available for paying current liabilities.
The example company’s acid test ratio is calculated as
follows (the business has no investments in marketable
securities):
= 1.01 acid test ratio
The general expectation is that a company’s acid test ratio
should be 1:1 or better, although you find many more excep-
tions to this rule than to the 2:1 current ratio standard.
$2,345,675 cash + $3,813,582 accounts receivable
ᎏᎏᎏᎏᎏᎏ
$6,126,096 total current liabilities
FINANCIAL REPORTING
56
Debt-to-Equity Ratio
Some debt is good, but too much is dangerous. The debt-to-
equity ratio is an indicator of whether a company is using
debt prudently or is overburdened with debt that could cause
problems. The example company’s debt-to-equity ratio is cal-
culated as follows (see Figure 4.2 for data):
= 1.03 debt-to-equity ratio
This ratio reveals that the company is using $1.03 of liabilities
for each $1.00 of stockholders’ equity. Notice that all liabilities
(non-interest-bearing as well as interest-bearing, and both
short-term and long-term) are included in this ratio. Most
industrial businesses stay below a 1 to 1 debt-to-equity ratio.
They don’t want to take on too much debt, or they cannot con-
vince lenders to put up more than one-half of their assets. On
the other hand, some businesses are much more aggressive
and operate with large ratios of debt to equity. Public utilities
and financial institutions have much higher debt-to-equity
ratios than 1 to 1.
Times Interest Earned
To pay interest on its debt a business needs sufficient earnings
before interest and income tax (EBIT). To test the ability to pay
interest, the times-interest-earned ratio is calculated. For the
example, annual earnings before interest and income tax is
divided by interest expense as follows (see Figure 4.1 for data):
= 4.07 times interest earned
There is no standard guideline for this particular ratio, al-
though obviously the ratio should be higher than 1 to 1. In
this example the company’s earnings before interest and
income tax is more than four times its annual interest
expense, which is comforting from the lender’s point of view.
Lenders would be very alarmed if a business barely covered
its annual interest expense. The company’s management
should be equally alarmed, of course.
$3,234,365 earnings before interest and income tax
ᎏᎏᎏᎏᎏᎏ
$795,000 interest expense
$13,626,096 total liabilities
ᎏᎏᎏᎏᎏ
$13,188,483 total stockholders’ equity
57
INTERPRETING FINANCIAL STATEMENTS
ASSET TURNOVER RATIOS
A business has to keep its assets busy, both to remain solvent
and to be efficient in making profit. Inactive assets are an
albatross around the neck of the business. Slow-moving assets
can cause serious trouble. Investors and lenders use certain
turnover ratios as indicators of how well a business is using
its assets and to test whether some assets are sluggish and
might pose a serious problem.
Accounts Receivable Turnover Ratio
Accounts receivable should be collected on time and not
allowed to accumulate beyond the normal credit term offered
to customers. To get a sense of how well the business is con-
trolling its accounts receivable, the accounts receivable turn-
over ratio is calculated as follows (see Figures 4.1 and 4.2 for
data):
= 10.4 times
The accounts receivable turnover ratio is one of the ratios
published by business financial information services such as
Dun & Bradstreet, Standard & Poor’s, and Moody’s. In this
example, the business “turns” its customers’ receivables a lit-
tle more than 10 times a year, which indicates that it waits
about a tenth of a year on average to collect its receivables
from credit sales. This appears reasonable, assuming that
the business extends one-month credit to its customers. (A
turnover of 12 would be even better.)
Inventory Turnover Ratio
In the business example, the company sells products. Virtually
every company that sells products carries an inventory, or
stockpile of products, for a period of time before the products
are sold and delivered to customers. The holding period
depends on the nature of business. Supermarkets have short
holding periods; retail furniture stores have fairly long inven-
tory holding periods. Products should not be held in inventory
longer than necessary. Holding inventory is subject to several
risks and accrues several costs. Products may become obsolete,
may be stolen, may be damaged, or may even be misplaced.
$39,661,250 annual sales revenue
ᎏᎏᎏᎏ
$3,813,582 accounts receivable
FINANCIAL REPORTING
58
Products have to be stored, usually have to be insured, and
may have to be guarded. And the capital invested in inventory
has a cost, of course.
To get a feel for how long the business holds its inventory
before sale, investors and lenders calculate the inventory
turnover ratio as follows (see Figures 4.1 and 4.2 for data):
= 4.3 times
The inventory turnover ratio is another of the ratios pub-
lished by business information service organizations. The
company’s 4.3 inventory turnover ratio indicates that it holds
products about one-fourth of a year before selling them. The
inventory turnover ratio is compared with the averages for the
industry and with previous years of the business.
Asset Turnover Ratio
The asset turnover ratio is a test of how well a business is
using its assets overall. This ratio is computed by dividing
annual sales revenue by total assets (see Figures 4.1 and 4.2
for data):
= 1.5 times
This ratio reveals that the business made $1.50 in sales for
every $1.00 of total assets. Conversely, the business needed
$1.00 of assets to make $1.50 of sales during the year. The
ratio tells us that business is relatively asset heavy. The asset
turnover ratio is compared with the averages for the industry
and with previous years of the business.
s
END POINT
Individual investors, investment managers, stock analysts,
lenders, and credit rating services commonly use the financial
statement and market value ratios explained in this chapter.
Business managers use the ratios to keep watch on how their
business is doing and whether there might be some trouble
spots that need attention. Nevertheless, the ratios are not a
panacea.
A financial statement ratio is like your body temperature. A
$39,661,250 annual sales revenue
ᎏᎏᎏᎏ
$26,814,579 total assets
$24,960,750 cost-of-goods sold expense
ᎏᎏᎏᎏᎏ
$5,760,173 inventories
59
INTERPRETING FINANCIAL STATEMENTS
normal temperature is good and means that probably nothing
serious is wrong, though not necessarily. A very high or low
temperature means something probably is wrong, but it takes
an additional diagnosis to discover the problem. Financial
statement ratios are like measures of vital signs such as your
pulse rate, blood pressure, cholesterol level, body fat, and so
on. Financial ratios are the vital signs of a business.
There’s no end to the number of ratios than can be calcu-
lated from financial statements. The trick is to focus on a rea-
sonable number of ratios that have the most interpretive
value. Calculating the ratios takes time. Many investors and
lenders do not actually calculate the ratios. They do “eyeball
tests” instead of computing ratios. They visually compare the
two numbers in the ratio and do rough arithmetic in their
heads to see if anything appears to be out of whack. For
example, they observe that current assets are more than twice
current liabilities. They do not bother to calculate the exact
measure of the current ratio. This is a practical and time-
saving technique as opposed to calculating ratios. Many
investors and lenders use the financial statement ratios pub-
lished by information service providers who compile data and
information on thousands of businesses.
FINANCIAL REPORTING
60
Assets and
Sources of
Capital
2
2
PART
5
CHAPTER
Building a
Balance Sheet
T
5
This chapter identifies and explains the various assets and lia-
bilities used by a business in making profit. A business invests
in a portfolio of operating assets and takes on certain operat-
ing liabilities in the process of making sales and incurring
expenses. The main theme of the chapter is that the profit-
making activities of a business (revenue and expenses) drive
the assets and liabilities that make up its balance sheet.
SIZING UP TOTAL ASSETS
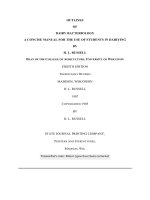
Figure 5.1 presents an abbreviated income statement for a
business’s most recent year. Previous chapters explain that
income statements include more information about expenses
and do not stop at the earnings before interest and income tax
(EBIT) line of profit. Interest and income tax expenses are
deducted to arrive at bottom-line net income. However, the
condensed and truncated income statement shown in Figure
5.1 is just fine for the purpose at hand.
This business example, like the examples in earlier chapters,
is a hypothetical but realistic composite based on a variety of
financial reports over the years. Any particular business you
look at will differ in one or more respects from the example.
Some businesses are smaller or larger than the one in the
example; their annual sales revenue may be lower or higher.
63
The business in the example sells products, and therefore it
has cost-of-goods sold expense. Many businesses sell services
instead of products, and they don’t have this expense. But the
example serves as a good general-purpose template that has
broad applicability across many lines of businesses.
A final comment about the example: I selected annual sales
of $52 million as a convenient figure to work with (i.e., $1
million sales per week). This simplifies the computations in
the following discussion and avoids diverting attention from
the main points and spending too much time on number
crunching.
Two Key Questions
Block by block this chapter builds the foundation of assets the
business used to make sales of $52 million and to squeeze out
$3.9 million profit (EBIT) from its sales revenue. Let me
immediately put a question to you: What amount of total
assets would you estimate that the business used in making
annual sales of $52 million? Annual sales divided by total
assets is called the asset turnover ratio (see Chapter 4). Indi-
rectly, what I’m asking you is this: What do you think the
asset turnover ratio might be for the business?
The asset turnover ratios of businesses that manufacture and
sell products tend to cluster in the range between 1.5 and 2.0.
In other words, their annual sales revenue equals 1.5 to 2
times total assets for these kinds of businesses. To keep the
arithmetic easy to follow in the discussion, assume that the
ASSETS AND SOURCES OF CAPITAL
64
Note: Amounts are in in millions of dollars.
Sales revenue $52.0
Cost-of-goods-sold expense $31.2
Gross margin $20.8
Operating expenses $16.9
Earnings before interest and income tax (EBIT) $ 3.9
FIGURE 5.1 Abbreviated income statement.
TEAMFLY
Team-Fly
®
total assets of the business in the example are $26 million. So
its asset turnover ratio is 2.0: ($52 million annual sales rev-
enue ÷ $26 million total assets = 2.0). An asset turnover ratio
of 2.0 is on the high side, but I’ll stick with it in the first part
of the chapter.
The second question is this: Where did the business
get the $26 million invested in its assets? The money
for investing in assets comes from two different sources—
liabilities and owners’ equity. This point is summarized in the
well-known accounting equation:
Assets = liabilities + owners’ equity
The accounting equation is the basis for double-entry book-
keeping. The balance sheet takes its name from the balance
between assets on one side of the equation and liabilities plus
owners’ equity on the other. The balance sheet is the financial
statement that reports a business’s assets, liabilities, and own-
ers’ equity accounts.
Return on Assets
The business used $26 million total assets to earn $3.9 million
before interest and income tax, or EBIT. Dividing EBIT by total
assets gives the rate of return on assets (ROA) earned by the
business. In the example, the business earned a 15.0 percent
ROA for the year ($3.9 million EBIT ÷ $26 million total assets =
15.0%). Is this ROA merely adequate, fairly good, or very
good? Well, relative to what benchmark or point of reference?
The business has borrowed money for part of the total $26
million total capital invested in its assets. The average annual
interest rate on its debt is 8.0 percent. Relative to this annual
interest rate the company’s 15.0 percent ROA is more than
adequate. Indeed, the favorable spread between these two
rates works to the advantage of the business owners. The
business borrows money at 8.0 percent and manages to earn
15.0 percent on the money. Chapter 6 explores the very
important issue regarding debt versus owners’ equity as
sources of capital to finance the assets of a business and dis-
cusses the advantages and risks of using debt capital.
65
BUILDING A BALANCE SHEET
This chapter deals mainly with the types and the
amounts of assets needed to make profit. The non-
interest-bearing operating liabilities of businesses are also
included in the discussion. These short-term payables occur
spontaneously when a business buys inventory on credit,
receives money in advance for future delivery of products or
services to customers, and delays paying for expenses.
Payables arising from these sources are called spontaneous
liabilities. In contrast, borrowing money from lenders and
raising money from shareholders are anything but sponta-
neous. Persuading lenders to loan money to the business is a
protracted process, as is getting people to invest money in the
business as shareowners.
ASSETS AND SOURCES OF CAPITAL FOR ASSETS
Continuing the example introduced previously, the business
has several different assets that at year-end add up to $26
million. One of its assets is inventories, which are products
being held by the business for sale to customers. These prod-
ucts haven’t been sold yet, so the cost of the products is held
in the asset account and will not be charged to expense until
the products are sold. The cost of its inventories at year-end is
$7.2 million. Of this amount, $2.4 million hadn’t been paid for
by the end of the year. The business has an excellent credit
rating. Its suppliers give the business a month to pay for pur-
chases from them.
In addition to the amounts it owes for inventory purchases,
the business also has short-term liabilities of $2.6 million for
unpaid operating expenses at year-end. Of its $16.9 operating
expenses for the year (see Figure 5.1), $2.6 million had not
been paid by the end of the year. Both types of liabilities—
payables for purchases of inventory on credit and for unpaid
operating expenses—are short-term, non-interest-bearing obli-
gations of the business. These are called operating liabilities,
or spontaneous liabilities (as mentioned). The total of these two
short-term operating liabilities is $5 million in the example.
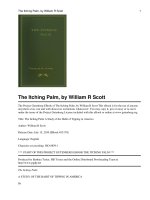
To summarize, the company’s total assets, operating liabili-
ties, and sources of capital for investing in its assets are
shown in Figure 5.2.
In Figure 5.2 note that the $5 million of operating liabilities
ASSETS AND SOURCES OF CAPITAL
66
is deducted from total assets to determine the $21 million
amount, which is the total capital needed for investing in its
assets. I favor this layout for management analysis purposes
because it deducts the amount of spontaneous liabilities from
the total assets of the business. Recall that the normal operat-
ing liabilities from buying things on credit and delaying pay-
ment of expenses are called spontaneous because they arise
in the normal process of carrying on the operations of the
business, not from borrowing money at interest.
Operating liabilities do not bear interest (unless the busi-
ness delays too long in paying these liabilities). If the business
had paid all its operating liabilities by year-end, then its cash
balance would have been $5 million lower and its total assets
would have been $21 million. (I should mention that the busi-
ness probably would not have had enough cash to pay all its
operating liabilities before the end of the year.) A company’s
cash balance benefits from the float, which is the time period
that goes by until the company pays its short-term operating
liabilities. It’s as if the business gets a $5 million interest-free
loan from its creditors.
Debt versus Equity as Sources of Capital
The $21 million of its assets ($26 million total assets
minus the $5.0 million of its operating liabilities) is
the amount of money that the business had to obtain from
three general sources: (1) The business borrowed money; (2)
the business raised money from shareowners; and (3) the
business retained a good part of its annual earnings instead
of distributing all of its annual profits to shareowners. These
three sources of capital have provided the $21 million
67
BUILDING A BALANCE SHEET
Note: Amounts are in millions of dollars.
Total assets $26.0 Short-term and long-term debt $ 7.5
Less operating liabilities $
5.0 Owners’ equity $13.5
Capital needed for assets $21.0 Capital from debt and owners’ equity $21.0
FIGURE 5.2 Summary of assets, operating liabilities, and sources of capi-
tal.
invested in its assets. Of this total capital, $7.5 million is from
short-term and longer-term debt sources. The rest of the com-
pany’s total capital is from owners’ equity, which consists of
the amounts invested by shareowners over the years plus the
accumulated retained earnings of the business. Figure 5.2
does not differentiate between the cumulative amounts
invested by shareowners and the retained earnings of the
business—only the total $13.5 million for owners’ equity is
shown in Figure 5.2.
Interest is the cost of using debt capital, of course. In con-
trast, a business does not make a contractual promise to pay
shareowners a predetermined amount or a percent of distri-
bution from profit each year. Rather, the cost of equity capital
is an imputed cost, equal to a sought-after amount of net
income that the business should earn annually relative to the
owners’ equity employed in the business. The owners’ equity
is $13.5 million of the company’s $21 million total capital.
Shareowners expect the business to earn annual net income
on owners’ equity that is higher than the interest rate on its
debt. Shareowners take more risk than lenders. Assume,
therefore, that the business’s objective is to earn a 15.0 per-
cent or higher annual net income on owners’ equity. In the
example, therefore, net income should be at least $2,025,000
($13.5 million owners’ equity × 15.0% = $2,025,000 net
income benchmark).
A company’s actual earnings before interest and income tax
(EBIT) for a year may not be enough to pay interest on its
debt capital, pay income tax, and achieve its after-tax net
income objective relative to owners’ equity. What about this
example, for instance? The business made $3.9 million EBIT,
as reported in Figure 5.1. The annual interest rate on its debt
was 8.0 percent, as mentioned earlier. So, its annual interest
expense was $600,000 ($7.5 million total debt × 8.0% annual
interest rate = $600,000).
So the business made $3.3 million earnings after interest
and before income tax. Its income tax rate is 34 percent of
this amount. Thus, its income tax is $1,122,000 and its net
income, or earnings after interest and income tax, is
$2,178,000. The business achieved its goal of earning 15.0
percent or better of net income on owners’ equity ($2,178,000
net income ÷ $13,500,000 owners’ equity = 16.1%). The
shareowners may be satisfied with this 16.1 percent return on
ASSETS AND SOURCES OF CAPITAL
68
their capital, or they may insist that the business should do
better.
Chapter 6 explores the strategy of using debt to enhance
net income performance (as well as the risks of using debt
capital, which a business may or may not be willing to take).
The rest of this chapter focuses on the assets and operating
liabilities that are driven by the profit-making activities of a
business. A large chunk of a company’s balance sheet (state-
ment of financial condition) consists of these assets and oper-
ating liabilities.
CONNECTING SALES REVENUE AND
EXPENSES WITH OPERATING ASSETS
AND LIABILITIES
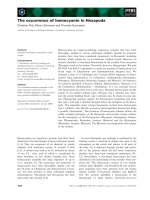
Figure 5.3 shows the lines of connection from sales revenue
and expenses to the company’s respective assets and operat-
ing liabilities. (The foregoing business example is continued in
this section.) The assets and operating liabilities shown in Fig-
ure 5.3 are explained briefly as follows:
•
Making sales on credit causes a business to record
accounts receivable.
69
BUILDING A BALANCE SHEET
Note: Amounts are in millions of dollars.
Income Statement
Assets
Sales revenue $52.0 Accounts receivable
Cost-of-goods-sold expense $31.2
Inventories
Gross margin $20.8 Prepaid expenses
Operating expenses $16.9
Property, plant, and equipment
Earnings before interest and
income tax (EBIT) $ 3.9 Operating Liabilities
Accounts payable
Accrued expenses payable
FIGURE 5.3 Operating assets and liabilities driven by sales revenue and
expenses.
•
Acquiring and holding products before they are sold to cus-
tomers causes a business to record inventories.
•
The costs of some operating expenses are paid before the
cost is recorded as an expense, which causes a business to
record prepaid expenses.
•
Investments in long-term operating resources, called prop-
erty, plant, and equipment (or, more informally, fixed
assets), cause a business to record depreciation expense
that is included in operating expenses.
•
Inventory purchases on credit cause a business to record
accounts payable.
•
Many expenses are recorded before they are paid, which
causes a business to record its unpaid expense amounts in
either an accounts payable account or an accrued expenses
payable account. These two payables are called operating
liabilities.
Accounts Receivable
No dollar amounts (also called balances) are shown for the
assets and operating liabilities in Figure 5.3. The amounts
depend on the policies and practices of the business. The
amount of the accounts receivable asset depends on the credit
terms offered to the company’s customers, whether most of
the customers pay their bills on time, and how many cus-
tomers are delinquent. For example, assume the business
offers its customers one-month credit, which most take, but
the company’s actual collection experience is closer to five
weeks, on average, because some customers pay late. In this
situation the balance of its accounts receivable would be about
five weeks of annual sales revenue, or approximately $5 mil-
lion at the end of the year ($52 million annual sales revenue ×
5/52 = approximately $5 million accounts receivable).
Inventories
The amount of the company’s inventories asset depends on
the company’s holding period—the time from acquisition of
products until the products are sold and delivered to cus-
tomers. Suppose that, on average, across all products sold, the
business holds products in inventory about 12 weeks. In this
ASSETS AND SOURCES OF CAPITAL
70
situation the company’s year-end inventory would be about
$7.2 million ($31.2 annual cost-of-goods-sold expense ×
12/52 = approximately $7.2 million). At the end of the year,
recent acquisitions of inventory had not been paid for because
the company buys on credit from the sources of products.
See the line of connection in Figure 5.3 from the invento-
ries asset to accounts payable. Assume, for instance, that
about one-third of its ending inventories had not been paid
for. As a result, the year-end accounts payable would be about
$2.4 million from inventory purchases on credit. The total
amount of accounts payable also includes the amount of
unpaid expenses of the business at the end of the year for
which the business has been billed by its vendors.
Operating Liabilities
For most businesses, a sizable amount of operating expenses
recorded during the latter part of a year are not paid by the
end of the year. At the end of the year the business has unpaid
bills from its utility company for gas and electricity, from its
lawyers for work done during recent weeks, from the tele-
phone company, from maintenance and repair vendors, and
so on. A business records the amounts it has been billed for
(received an invoice for) in the accounts payable operating lia-
bility account. A business also has a second and equally
important type of operating liability. A business has many
expenses that accumulate, or accrue over time, for which it
does not receive bills, and to record these “creeping” expenses
a business uses a second type of operating liability account
that is discussed next.
In my experience, business managers and investors do not
appreciate the rather large size of accruals for various operat-
ing expenses. Many operating expenses are not on a pay-as-
you-go basis. For example, accumulated vacation and sick
leave benefits are not paid until the employees actually take
their vacations and sick days. At year-end, the company calcu-
lates profit-sharing bonuses and other profit-sharing amounts,
which are recorded as expense in the period just ended, even
though they will not be paid until some time later. Product
warranty and guarantee costs should be accrued and charged
to expense so that these follow-up costs are recognized in the
71
BUILDING A BALANCE SHEET
same year that sales revenue is recorded—to get a correct
matching of sales revenue and expenses to measure profit. In
summary, a surprising number of expense accruals are
recorded.
Expense accruals are recorded in a separate account,
labeled accrued expenses payable in Figure 5.3, because they
are quite different than accounts payable. For one thing, an
account payable is based on an actual invoice received by the
vendor, whereas accruals have no such hard copy that serves
as evidence of the liability. Accruals depend much more on
good faith estimates of the accountants and others making
these calculations. Suppose the business in the example
knows from experience that the balance of this operating lia-
bility tends to be about five weeks of its annual total operating
expenses.
This ratio of accrued expenses payable to annual operating
expenses is based on the types of accruals that the company
records, such as accrued vacation and sick pay for employees,
accrued property taxes, accrued warranty and guarantee
costs on products, and so on. The five weeks reflects the aver-
age time between when these expenses are recorded and
when they are actually paid, which can be quite a long time
for some items but rather short for others. Thus, the year-end
balance of the company’s accrued expenses payable liability
account is about $1.6 million ($16.9 million annual operating
expenses × 5/52 = approximately $1.6 million).
Prepaid Expenses, Fixed Assets,
and Depreciation Expense
Chapter 2 explains the accrual basis of profit accounting and
cash flow from profit. One key point to keep in mind in com-
paring profit and cash flow is that a business has to prepay
some of its operating expenses. I won’t repeat that discussion
here; I’ll simply piggyback on the discussion and point out
that a business has an asset account called prepaid expenses,
which holds the prepaid cost amounts that have not been
charged off to expense by the end of the year. Usually, the
amount of the prepaid expenses asset account is relatively
small—although, if the ending balance were large compared
with a company’s annual operating expenses, this strange
ASSETS AND SOURCES OF CAPITAL
72
state of affairs definitely should be investigated. A business
manager should notice an unusually large balance in the pre-
paid expenses and demand an explanation.
One of the operating expenses of a business is depreciation.
This is a very unique expense, especially from the cash flow
point of view (as Chapter 2 discusses at some length). I do not
separate depreciation expense in Figure 5.3, although I do
show a line of connection from the company’s fixed assets
account (property, plant, and equipment) to operating
expenses. As I explain in Chapter 2, the original cost of fixed
assets is spread over the years of their use according to an
allocation method.
What about Cash?
A business has one other asset not shown in Figure 5.3 or
mentioned so far—cash. Every business needs a working cash
balance. Recall that in the example the company’s annual
sales revenue is $52 million, or $1 million per week on aver-
age. But the actual cash collections in a given week could be
considerably less or much more than the $1 million average.
A business can’t live hand to mouth and wait for actual cash
collections to arrive before it writes checks. Employees have
to be paid on time, of course, and a business can’t ask its
creditors to wait for payment until it collects enough money
from its customers.
In short, a business maintains a minimum cash balance as
a safety buffer. Many businesses keep rather large cash bal-
ances, part of which usually is invested in safe, short-term
marketable debt securities on which the business earns inter-
est income. The average cash balance of a business relative to
its annual sales revenue may be very low or fairly high. Cash
balance policies vary widely from business to business. If I
had to guess the cash balance of the business in the example,
I would put it at around two or three weeks of annual sales
revenue, or about $2 to $3 million. But I wouldn’t be sur-
prised if its cash balance were outside this range.
There’s no doubt that every business needs to keep enough
cash in its checking account (or on hand in currency and coin
for cash-based businesses such as grocery stores and gambling
casinos). But precisely how much? Every business manager
73
BUILDING A BALANCE SHEET
would worry if cash were too low to meet the next payroll.
Some liabilities can be put off for days or even weeks, but
employees have to be paid on time. Beyond a minimum, rock-
bottom cash balance amount to meet the payroll and to pro-
vide at least a bare-bones margin of safety, it is not clear how
much additional cash balance a business should carry, just as
some people may have only $5 or $10 in walking-around
money and others could reach in their wallet and pull out
$500.
Unnecessary excess cash balances should be avoided. Excess
cash is an unproductive asset that doesn’t pay its way toward
meeting the company’s cost of capital (i.e., the interest on debt
capital and the net income that should be earned on equity
capital). For another thing, excess cash balances can cause
managers to become lax in controlling expenses. Money in the
bank, waiting only for a check to be written, is often an incen-
tive to make unnecessary expenditures, not scrutinizing them
as closely as needed. Also, excess cash balances can lead to
greater opportunities for fraud and embezzlement.
Yet having a large cash balance is a tremendous advantage
in some situations. The business may be able to drive a hard
bargain with a major vendor by paying cash up front rather
than asking for the normal credit terms. There are many
such reasons for holding a cash balance over and above
what’s really needed to meet payroll and to provide for a
safety buffer for the normal lags and leads in the cash
receipts and cash disbursements of the company. Frankly, if
this were my business I would want at least a three weeks’
cash balance.
An executive of a leading company said he kept the com-
pany’s cash balance “lean and mean” to keep its managers on
their toes. There’s probably a lot of truth in this. But if too
much time and effort goes into managing day-to-day cash
flow, then the more important strategic factors may not be
managed well.
Figure 5.3 does not present a complete picture of the com-
pany’s financial condition. Cash is missing, as just discussed,
and the sources of the company’s capital are not shown. It’s
time to fill in the remaining pieces of the statement of finan-
cial condition of the business, otherwise known as the balance
sheet.
ASSETS AND SOURCES OF CAPITAL
74
TEAMFLY
Team-Fly
®
BALANCE SHEET TETHERED WITH INCOME
STATEMENT
Figure 5.4 presents the income statement and balance sheet
(statement of financial condition) for the business example.
The income statement includes interest expense, income tax
expense, and net income (which are discussed earlier in the
chapter). The balance sheet includes the sources of capital
that the business has tapped to invest in its assets—interest-
bearing debt and owners’ equity. The balance sheet is pre-
sented according to the discussion earlier in the chapter. In
particular, note that the total amount of operating liabilities
(the sum of accounts payable and accrued expenses payable)
is deducted from total assets to determine the capital invested
in assets.
75
BUILDING A BALANCE SHEET
Note: Amounts are in millions of dollars.
Income Statement Balance Sheet
Assets
Cash $ 3.0
Accounts receivable $ 5.0
Inventories $ 7.2
Prepaid expenses $ 1.0
Property, plant, and
equipment $17.5
Accumulated depreciation ($
7.7) $ 9.8
Total assets $26.0
Operating Liabilities
Accounts payable $ 3.4
Accrued expenses payable $ 1.6 $ 5.0
Capital invested in assets $21.0
Sources of Capital
Interest-bearing debt $ 7.5
Owners’ equity $13.5
Total sources of capital $21.0
FIGURE 5.4 Balance sheet and income statement.
Sales revenue $52.0
Cost-of-goods-sold expense $31.2
Gross margin $20.8
Operating expenses $16.9
Earnings before interest
and income tax $ 3.9
Interest expense $
0.6
Earnings before income tax $ 3.3
Income tax expense $
1.1
Net income $ 2.2