Trading Strategies for the Global Stock, Bond, Commodity, and Currency Markets_8 pot
Bạn đang xem bản rút gọn của tài liệu. Xem và tải ngay bản đầy đủ của tài liệu tại đây (414.71 KB, 11 trang )
262 APPENDIX
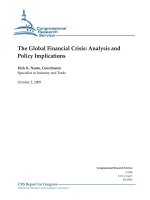
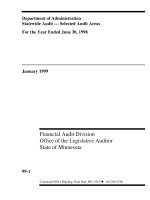
FIGURE A.3
STOCKS
VERSUS
BONDS FROM
LATE
1989
THROUGH
SEPTEMBER
1990.
AFTER
FALLING
THROUGH THE EARLY PORTION OF 1990, THE BOND TROUGH IN EARLY MAY HELPED
SUPPORT
THE
STOCK
RALLY.
BONDS
FAILED
TO
CONFIRM
THE
DOW'S
MOVE
TO NEW
HIGHS
DURING THE SUMMER. BOTH MARKETS THEN TUMBLED TOGETHER.
Dow Industrials-One Year
APPENDIX 263
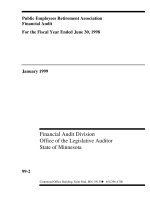
FIGURE A.4
A COMPARISON OF THE DOW INDUSTRIALS, DOW UTILITIES, AND TREASURY BONDS
FROM AUTUMN OF 1989 THROUGH THE THIRD QUARTER OF 1990. RELATIVE WEAKNESS
IN THE DOW UTILITIES FROM THE BEGINNING OF 1990 PROVIDED AN EARLY BEARISH
WARNING FOR THE DOW INDUSTRIALS. NOTICE THE CLOSE CORRELATION BETWEEN THE
DOW UTILITIES AND TREASURY BONDS.
Dow Industrials Treasury Bonds
Dow Utilities
264 APPENDIX
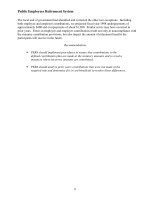
FIGURE A.5
A COMPARISON OF THE CRB INDEX TO THE U.S. DOLLAR FROM LATE 1989 TO SEPTEMBER
1990. THE FALLING DOLLAR, WHICH IS INFLATIONARY, HELPED COMMODITY PRICES
ADVANCE DURING 1990. A BOUNCE IN THE DOLLAR DURING MAY CONTRIBUTED TO THE
CRB
PEAK
THAT
MONTH.
COMMODITIES
FIRMED
AGAIN
DURING
THE
SUMMER
AS THE
DOLLAR PROPPED TO NEW LOWS.
CRB Index
APPENDIX 265
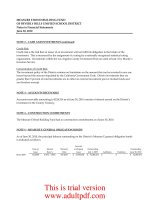
FIGURE A.6
THE
U.S. DOLLAR
VERSUS
GOLD
FROM
LATE
1989
THROUGH
SEPTEMBER
1990.
THE
DECLINING DOLLAR DURING MOST OF 1990 WASN'T ENOUGH TO TURN THE GOLD TREND
HIGHER. HOWEVER, THE INVERSE RELATIONSHIP CAN STILL BE SEEN, ESPECIALLY DURING
THE DOLLAR SELLOFFS IN LATE 1989 AND JUNE 1990, WHEN GOLD RALLIED. THE INTERIM
BOTTOM IN THE DOLLAR IN FEBRUARY 1990 WAS ENOUGH TO PUSH GOLD PRICES LOWER.
U.S. Dollar Index
Dollar Index Gold
266 APPENDIX
FIGURE A.7
GOLD VERSUS THE DOW INDUSTRIALS FROM THE SUMMER OF 1989 TO THE AUTUMN OF
1990.
THE
GOLD
RALLY
IN THE
FALL
OF
1989
COINCIDED
WITH
STOCK MARKET WEAKNESS.
THE FEBRUARY 1990 PEAK IN GOLD COINCIDED WITH A RALLY IN STOCKS. GOLD ROSE
DURING THE SUMMER OF 1990 AS STOCKS WEAKENED. THROUGHOUT THE PERIOD SHOWN,
GOLD DID BEST WHEN THE STOCK MARKET FALTERED.
Dow Industrials
APPENDIX 267
FIGURE A.8
A
COMPARISON
OF
AMERICAN, BRITISH,
AND
JAPANESE
STOCK MARKETS
IN THE
18-MONTH
PERIOD ENDING IN THE THIRD QUARTER OF 1990. ALL THREE MARKETS DROPPED SHARPLY
AT THE BEGINNING OF 1990 AND THEN RALLIED IN THE SPRING. NEITHER OF THE FOREIGN
MARKETS CONFIRMED THE AMERICAN RALLY TO NEW HIGHS DURING THE SUMMER OF 1990.
THE "TRIPLE TOP" IN BRITAIN AND THE COLLAPSE IN JAPAN HELD BEARISH IMPLICATIONS
FOR AMERICAN EQUITIES. GLOBAL MARKETS THEN COLLAPSED TOGETHER.
Dow lndustrials-75 Weeks FT-100
Cold
Nikkei
225
268 APPENDIX
FIGURE A.9
AMERICAN VERSUS JAPANESE STOCK MARKETS FROM SEPTEMBER 1989 TO SEPTEMBER
1990. BOTH MARKETS TURNED DOWN IN JANUARY. ALTHOUGH THE AMERICAN MARKET
APPEARED
TO
SHRUG
OFF THE
JAPANESE
COLLAPSE
DURING
THE
FIRST
QUARTER
OF
1990,
THE
SECOND
FALL
IN
JAPAN
DURING
THE
SUMMER
TOOK
ITS
TOLL
ON ALL
GLOBAL
MARKETS.
THE
JAPANESE
RALLY
FROM
MAY
INTO
JULY
HELPED
STABILIZE
THE
AMERICAN
MARKET. HOWEVER, THE AMERICAN RALLY TO NEW HIGHS WASN'T CONFIRMED BY THE
JAPANESE
MARKET,
WHICH
BARELY
RETRACED
HALF
OF ITS
PREVIOUS
LOSSES.
American versus Japanese Stocks
APPENDIX 269
FIGURE A.10
A COMPARISON OF THE AMERICAN, BRITISH, GERMAN, AND JAPANESE BOND MARKETS
DURING THE SUMMER OF 1990. GLOBAL BOND MARKETS TUMBLED AS OIL PRICES SURGED
FOLLOWING
IRAQ'S
INVASION
OF
KUWAIT
ON
AUGUST
2,1990.
JAPANESE
BONDS TURNED
IN THE
WORST PERFORMANCE
(OWING
TO
JAPAN'S
GREATER
DEPENDENCE
ON
OIL),
NOT
ONLY LEADING GLOBAL BOND PRICES LOWER BUT ALSO ACCOUNTING FOR THE COLLAPSE
OF JAPANESE EQUITIES.
270
APPENDIX
FIGURE A.11
DOW INDUSTRIALS VERSUS CRUDE OIL DURING THE SUMMER OF 1990. THE INFLATIONARY
IMPACT OF SURGING OIL PRICES DURING THE SUMMER OF 1990 TOOK A BEARISH TOLL ON
EQUITY PRICES EVERYWHERE ON THE GLOBE. OIL BECAME THE DOMINANT COMMODITY
DURING 1990 AND DEMONSTRATED HOW SENSITIVE BOND AND STOCK MARKETS ARE TO
ACTION IN THE COMMODITY SECTOR.
Stocks versus Oil
APPENDIX 271
FIGURE A.12
CRUDE OIL VERSUS OIL STOCKS DURING 1990. OIL STOCKS HAD SPENT THE FIRST HALF
OF 1990 IN A HOLDING PATTERN WHILE OIL PRICES WEAKENED. OIL STOCKS EXPLODED TO
NEW HIGHS IN EARLY JULY WHEN OIL BOTTOMED. AS THE THIRD QUARTER OF 1990 ENDED,
HOWEVER, FALLING OIL SHARES HAVE SET UP A "NEGATIVE DIVERGENCE" WITH THE PRICE
OF OIL, WHICH IS TESTING ITS ALL-TIME HIGH AT $40.
Crude Oil versus Oil Stocks
GLOSSARY
Advance/Decline Line: One of the most widely-
used indicators to measure the breadth of a stock
market advance or decline. Each day (or week) the
number of advancing issues is compared to the num-
ber of declining issues. If advances outnumber de-
clines, the net total is added to the previous cu-
mulative total. If declines outnumber advances, the
net difference is subtracted from the previous cu-
mulative total. The advance/decline line is usually
compared to a popular stock average such as the
Dow Jones Industrial Average. They should trend
in the same direction. When the advance/decline
line begins to diverge from the stock average, an early
indication is given of a possible trend reversal.
Arms Index: Also called Trin, this contrary indi-
cator is the average volume of declining stocks di-
vided by the average volume of advancing stocks. A
reading below 1.0 indicates more volume in rising
stocks. A reading above 1.0 reflects more volume in
declining issues. However, an extreme high reading
suggests an oversold market and an extreme low
reading, an overbought market.
Ascending Triangle: A sideways price pattern be-
tween two converging trendlines, in which the
lower line is rising while the upper line is flat.
This is generally a bullish pattern.
Bar Chart: The most common type of price chart
used by market technicians. On a daily bar chart,
each bar represents one day's activity. The verti-
cal bar is drawn from the day's highest price to the
day's lowest price (the range). A tic to the left of the
bar marks the opening price, whereas a tic to the
right of the bar marks the closing price. Bar charts
can be constructed for any time period, including
monthly, weekly, hourly, and selected minute pe-
riods.
Breakaway Gap: A price gap that forms on the
completion of an important price pattern. A break-
away gap usually signals the beginning of an im-
portant price move.
Bullish Consensus: Weekly numbers based on a
poll of newsletter writers published by Hadady
Publications in Pasadena, California. When 80 per-
cent of newsletter writers are bullish on a market,
that market is considered to be overbought and vul-
nerable to a price decline. Readings below 30 per-
cent are indicative of an oversold market and are
considered bullish.
Channel Line: Straight lines drawn parallel to the
basic trendline. In an uptrend, the channel line
slants up to the right and is drawn above rally
peaks: in a downtrend, the channel line is drawn
down to the right below price troughs. Prices will
often meet resistance at rising channel lines and
support at falling channel lines.
Confirmation: Having as many technical factors
as possible agreeing with one another. For exam-
ple, if prices and volume are rising together, vol-
ume is confirming the price action. The opposite
of confirmation is divergence.
Continuation Patterns: Price formations that im-
ply a pause or consolidation in the prevailing
trend, after which the prior trend is resumed. The
most common types are triangles, flags, and pen-
nants.
Descending Triangle: A sideways price pattern
between two converging trendlines, in which the
upper line is declining while the lower line is flat.
This is generally a bearish pattern.
Divergence: A situation where two indicators are
not confirming each other. For example, in oscilla-
tor analysis, prices trend higher while an oscillator
starts to drop. Divergence usually warns of a trend
reversal.
Double Top: This price pattern displays two
prominent peaks. The reversal is complete when
the middle trough is broken. The double bottom is
a mirror image of the top.
Down Trendline: A straight line drawn down and
to the right above successive rally peaks in a down-
trend. A violation of the down trendline usually
signals a change in the trend.
Dow Theory: One of the oldest and most highly
regarded of technical theories. A Dow Theory buy
signal is given when the Dow Industrial and Dow
Transportation Averages close above a prior rally
peak. A sell signal is given when both averages
close below a prior reaction low.
Elliott Wave Analysis: An approach to market
analysis that is based on repetitive wave patterns
and the Fibonacci number sequence. An ideal El-
liott Wave pattern shows a five-wave advance fol-
lowed by a three-wave decline. The Fibonacci num-
ber sequence (1, 2, 3, 5, 8, 13, 21, 34, 55, 89, 144
) is constructed by adding the first two num-
bers to arrive at the third. The ratio of any number
to the next larger number is 62 percent, which is
a popular Fibonacci retracement number. The in-
verse of 62 percent, which is 38 percent, is also
used as a Fibonacci retracement number. The ra-
tio of any number to the next smaller number is
1.62 percent, which is used to arrive at Fibonacci
price targets. Elliott Wave Analysis incorporates
274
the three elements of pattern (wave identification),
ratio (Fibonacci ratios and projections), and time.
Fibonacci time targets are arrived at by counting Fi-
bonacci days, weeks, months, or years from promi-
nent peaks and troughs.
Exhaustion Gap: A price gap that occurs at the
end of an important trend and signals that the trend
is ending.
Exponential Smoothing: A moving average that
uses all data points, but gives greater weight to
more recent price data.
Flag: A continuation price pattern, generally last-
ing less than three weeks, which resembles a par-
allelogram that slopes against the prevailing trend.
The flag represents a minor pause in a dynamic
price trend.
Fundamental Analysis: The opposite of technical
analysis. Fundamental analysis relies on economic
supply/demand information as opposed to market
activity.
Gaps: Gaps are spaces left on the bar chart where
no trading has taken place. An up gap is formed
when the lowest price on a trading day is higher
than the highest high of the previous day. A down
gap is formed when the highest price on a day is
lower than the lowest price of the prior day. An up
gap is usually a sign of market strength, whereas
a down gap is a sign of market weakness. Three
types of gaps are breakaway, runaway (also called
measuring), and exhaustion gaps.
Head and Shoulders: The best known of the re-
versal price patterns. At a market top, three promi-
nent peaks are formed with the middle peak (or
head) slightly higher than the two other peaks
shoulders). When the trendline (neckline) con-
necting the two intervening troughs is broken, the
pattern is complete. A bottom pattern is a mirror
image of a top and is called an inverse head and
shoulders.
Intermarket Analysis: An additional aspect of
technical analysis that takes into consideration the
price action of related market sectors. The four
sectors are currencies, commodities, bonds, and
stocks. International markets are also included.
This approach is based on the premise that all mar-
kets are interrelated and impact on one another.
Island Reversal: A combination of an exhaustion
gap in one direction and a breakaway gap in the
other direction within a few days. Toward the end
of an uptrend, for example, prices gap upward and
then downward within a few days. The result is
usually two or three trading days standing alone
with gaps on either side. The island reversal usu-
ally signals a trend reversal.
Key Reversal Day: In an uptrend, this one-day
pattern occurs when prices open in new highs and
GLOSSARY
resembles a small symmetrical triangle. Like the
flag, the pennant usually lasts from one to three
weeks and is typically followed by a resumption
of the prior trend.
% Investment Advisors Bullish: This measure
of stock market bullish sentiment is published
weekly by Investor's Intelligence in New Rochelle,
New York. When only 35 percent of profession-
als are bullish, the market is considered oversold.
A reading of 55 percent is considered to be over-
bought.
Price Patterns: Patterns that appear on price
charts that have predictive value. Patterns are di-
vided into reversal patterns and continuation pat-
terns.
Put/Call Ratio: The ratio of volume in put options
divided by the volume of call options is used as a
contrary indicator. When put buying gets too high
relative to call buying (a high put/call ratio), the
market is oversold. A low put/call ratio represents
an overbought market condition.
Rate of Change: A technique used to construct an
overbought/oversold oscillator. Rate of change em-
ploys a price ratio over a selected span of time. To
construct a ten-day Rate of Change oscillator, the
last closing price is divided by the close price ten
days earlier. The resulting value is plotted above
or below a value of 100.
Ratio Analysis: The use of a ratio to compare the
relative strength between two entities. An individ-
ual stock or industry group divided by the S&P 500
index can determine whether that stock or indus-
try group is outperforming or underperforming the
stock market as a whole. Ratio analysis can be used
to compare any two entities. A rising ratio indicates
that the numerator in the ratio is outperforming
the denominator. Ratio analysis can also be used
to compare market sectors such as the bond mar-
ket to the stock market or commodities to bonds.
Technical analysis can be applied to the ratio line
itself to determine important turning points.
Relative-Strength Index (RSI): A popular oscilla-
tor developed by Welles Wilder, Jr., and described
in his 1978 book, New Concepts in Technical Trad-
ing Systems. RSI is plotted on a vertical scale from
0 to 100. Values above 75 are considered to be over-
bought and values below 25, oversold. When prices
are over 75 or below 25 and diverge from price ac-
tion, a warning is given of a possible trend reversal.
RSI usually employs time spans of 9 or 14 days.
Resistance: The opposite of support. Resistance
is marked by a previous price peak and provides
enough of a barrier above the market to halt a price
advance.
Retracements: Prices normally retrace the prior
trend by a percentage amount before resuming the
original trend. The best known example is the 50
GLOSSARY
then close below the previous day's closing price.
In a downtrend, prices open lower and then close
higher. The wider the price range on the key rever-
sal day and the heavier the volume, the greater the
odds that a reversal is taking place.
Line Charts: Price charts that connect the closing
prices of a given market over a span of time. The
result is a curving line on the chart. This type of
chart is most useful with overlay or comparison
charts that are commonly employed in intermarket
analysis.
Momentum: A technique used to construct an
overbought/oversold oscillator. Momentum mea-
sures price differences over a selected span of time.
To construct a 10-day momentum line, the closing
price 10 days earlier is subtracted from the latest
price. The resulting positive or negative value is
plotted above or below a zero line.
Moving Average: A trend-following indicator that
works best in a trending environment. Moving av-
erages smooth out price action but operate with
a time lag. A simple 10-day moving average of a
stock, for example, adds up the last 10 days' clos-
ing prices and divides the total by 10. This pro-
cedure is repeated each day. Any number of mov-
ing averages can be employed, with different time
spans, to generate buy and sell signals. When only
one average is employed, a buy signal is given
when the price closes above the average. When two
averages are employed, a buy signal is given when
the shorter average crosses above the longer aver-
age. Technicians use three types: simple, weighted,
and exponentially smoothed averages.
Open Interest: The number of options or futures
contracts that are still unliquidated at the end of a
trading day. A rise or fall in open interest shows
that money is flowing into or out of a futures
contract or option, respectively. Open interest also
measures liquidity.
Oscillators: Technical indicators that are utilized
to determine when a market is in an overbought
and oversold condition. Oscillators are plotted at
the bottom of a price chart. When the oscilla-
tor reaches an upper extreme, the market is over-
bought. When the oscillator line reaches a lower
extreme, the market is oversold. Two types of os-
cillators use momentum and rates of change.
Overbought: A term usually used in reference to
an oscillator. When an oscillator reaches an upper
extreme, it is believed that a market has risen too
far and is vulnerable to a selloff.
Oversold: A term usually used in reference to an
oscillator. When an oscillator reaches a lower ex-
treme, it is believed that market has dropped too
far and is due for a bounce.
Pennant: This continuation price pattern is sim-
ilar to the flag, except that it is more horizontal and
275
percent retracement. Minimum and maximum re-
tracements are normally one-third and two-thirds,
respectively. Elliott Wave Theory uses Fibonacci
retracements of 38 percent and 62 percent.
Reversal Patterns: Price patterns on a price chart
that usually indicate that a trend reversal is taking
place. The best known of the reversal patterns are
the head and shoulders and double and triple tops
and bottoms.
Runaway Gap: A price gap that usually occurs
around the midpoint of an important market trend.
For this reason, it is also called a measuring gap.
Saucer: A price reversal pattern that represents a
very slow and gradual shift in trend direction.
Sentiment Indicators: Psychological indicators
that attempt to measure the degree of bullishness
or bearishness in the stock market or in individ-
ual markets. These are contrary indicators and are
used in much the same fashion as overbought or
oversold oscillators. Their greatest value is when
they reach upper or lower extremes.
Simple Average: A moving average that gives
equal weight to each day's price data.
Stochastics: An overbought/oversold oscillator
that is based on the principle that as prices ad-
vance, the closing price moves to the upper end of
its range. In a downtrend, closing prices usually ap-
pear near the bottom of their recent range. Time pe-
riods of 9 and 14 days are usually employed in its
construction. Stochastics uses two lines—%K and
its 3-day moving average, %D. These two lines fluc-
tuate in a vertical range between 0 and 100. Read-
ings above 80 are overbought, while readings below
20 are oversold. When the faster %K line crosses
above the slower %D line and the lines are below
20, a buy signal is given. When the %K crosses be-
low the %D line and the lines are over 80, a sell
signal is given. There are two stochastics versions:
fast stochastics and slow stochastics. Most traders
use the slower version because of its smoother
look and more reliable signals. The formula for fasf
stochastics is:
In the formula, n usually refers to the number of
days, but can also mean months, weeks, or hours.
The formula for stow stochastics is:
slow %K = fast %D
slow %D = 3 day average of fast %D.
Support: A price, or price zone, beneath the cur-
rent market price, where buying power is sufficient
276
to halt a price decline. A previous reaction low
usually forms a support level.
Symmetrical Triangle: A sideways price pattern
between two converging trendlines in which the
upper trendline is declining and lower trendline
is rising. This pattern represents an even balance
between buyers and sellers, although the prior
trend is usually resumed. The breakout through
either trendline signals the direction of the price
trend.
Technical Analysis: The study of market action,
usually with price charts, which also includes vol-
ume and open interest patterns.
Trend: Refers to the direction of prices. Ris-
ing peaks and troughs constitute an uptrend;
falling peaks and troughs constitute a downtrend.
A trading range is characterized by horizontal
peaks and troughs. Trends are generally classified
into major (longer than six months), intermedi-
ate (one to six months), or minor (less than a
month).
Trendlines: Straight lines drawn on a chart below
reaction lows in an uptrend, or above rally peaks
in a downtrend, that determine the steepness of the
GLOSSARY
current trend. The breaking of a trendline usually
signals a trend change.
Triangles: Sideways price patterns in which
prices fluctuate within converging trendlines. The
three types of triangles are the symmetrical, the as-
cending, and the descending.
Triple Top: A price pattern with three prominent
peaks, similar to the head and shoulders top, ex-
cept that all three peaks occur at about the same
level. The triple bottom is a mirror image of the
top.
Up Trendline: A straight line drawn upward and
to the right below reaction lows in an uptrend. The
longer the up trendline has been in effect and the
more times it has been tested, the more significant
it becomes. Violation of the trendline usually sig-
nals that the uptrend may be changing direction.
Volume: The level of trading activity in a stock,
option, or futures contract. Expanding volume in
the direction of the current price trend confirms
the price trend.
Weighted Average: A moving average that uses a
selected time span but gives greater weight to more
recent price data.
Index
Advance/decline line, 3, 273
Aluminum shares, 171, 172
Angell, Wayne, 116, 117, 146
Arms Index, 273
Ascending triangle, 273, 276
Asset allocation, 11, 226
role of commodities in, 206, 207,
220-221, 223-224
role of futures in, 216-217
Asset Allocation Review, 226, 228, 234
Baker, James, 116
Bank stocks, 149, 164
Bar chart, 41, 42, 273
Bond(s):
and commodities, 9, 10, 13, 24, 28
and the CRB Index, 24-30
and the dollar, 54, 58, 59
in economic forecasting, 229-230
global, 141-143
as a leading indicator of stocks, 43-51
prices vs. yields, 21, 24, 139
vs. savings and loan stocks, 165-168
vs. stocks, 9, 15, 40-55, 262
and utilities, 178-181
Bond market(s):
bottom of 1981, 41-43
collapse of, 13, 14-17, 24
comparison of, 140, 273
short-term interest rates and, 52
Bond-stock link:
financial markets on the defensive, 40-41
long lead times, 51
role of business cycle in, 54
Breakaway gap, 273, 274
Bullish consensus, 273
Business Conditions Digest, 231
Business cycle, 11, 19, 225-239
bonds and, 54, 229-230
chronological sequences of bonds, stocks,
and
commodities
in,
226—227
commodities in, 228
long- and short-leading indexes, 230-231
six stages of, 228-229
stocks and commodities as leading
indicators of, 232-235
Canada, 142
Center for International Business Cycle
Research (CIBCR), 99, 230
Channel line, 273
Chernobyl accident, 14
Chicago Mercantile Exchange, 7
Closing prices, 274
Commodities:
basket approach to, 220, 222, 224
bonds and, 9, 10, 13
and the dollar, 9, 56-57, 75
and Federal Reserve policy, 116-117
and interest rates, 13, 22, 38
as the missing link in intermarket
analysis, 255-256
ranking individual, 200-203
vs. stocks, 90-91
Commodity-bond link:
and the dollar, 75
economic background of, 22
how technical analysts use, 30-34, 229
importance of T-bill action, 36-38
inflation as the key to, 20-21
277
278
market history in the 1980s, 22-24
relative-strength analysis in, 35, 200-203,
205
since 1987, 24-30
role of short-term rates, 35-36
vs. stocks, 90-91
technical analysis of, 34-35
Commodity futures, as an asset class, 11,
220-221, 223, 224
Commodity groups, 9, 97-98, 188-191
Commodity indexes, 95-121
energy vs. metals markets, 113-114
grains, metals, and oils, 98
industrials
vs.
foodstuffs,
99,
100-101,
102
interest rates vs., 106-108
intermarket roles of gold and oil, 114—115
metals and energy futures vs. interest
rates,
115-116
visual comparisons of, 100
Commodity markets, 8
Commodity prices, 12, 24, 27, 56-57, 96
compared to bond prices, 207
as a key to inflation, 3, 20-21, 57-59, 60
Commodity Research Bureau, 22, 95
Commodity Research Bureau (CRB) Futures
Group Indexes, 95, 109-110, 188
Commodity Research Bureau (CRB) Futures
Price Index, 4-5, 7, 8, 12, 20, 95
applications of, 186, 220, 226
a balanced picture of, 108-109
and the bond market, 5, 9, 13, 24-30,
216
vs. bonds and utilities, 181-184
construction of, 22, 96-97
vs. the CRB spot index, 98-99, 103, 121
descending triangle in, 33, 34
dollar and, 59-62, 70-72, 264
and the Dow Jones Industrial Average,
233
gold and, 68-70, 71, 265
vs. grains, metals, and energy groups, 9,
110-113
group correlation studies of, 97-98
and interest rates, 120
vs. the Journal of Commerce (JOC) Index,
104-106, 121
vs. the Producer Price Index and
Consumer Price Index, 117-120
vs. savings and loans, 168-169
vs. stocks, 5, 211-216, 217
and Treasury bills, 35, 36-38
and Treasury bonds, 10, 13, 21, 22-30,
31, 32, 34, 35, 36, 38-39, 107, 109, 150,
207-211, 261
INDEX
Commodity Research Bureau {CRB} Spot
Index, 95, 98-99, 234
Computerization, 53, 256-257
Confirmation, 31, 43, 147, 161, 186, 204,
273
Consumer Price Index (CPI), 9, 20, 35, 96,
117-120, 121, 222
Consumer Price Index for Urban Wage
Earners and Clerical Workers (CPI-W),
117
Continuation patterns, 14, 273, 275
Contraction, 10, 225, 226, 229
Copper, 171, 172, 226
as an economic indicator, 235—237
and the stock market, 237-238, 239
CRB Index, see Commodity Research Bureau
Futures Price Index
CRB Index Futures Reference Guide, 39,
97
CRB Index White Paper, 38, 118
Cullity, John P., 232
Depression, 48, 225
Descending triangle, 33, 34, 273, 276
Deutsche mark, 66, 69, 70, 71, 217
Discount rate, 52
Disinflation, 21, 23
Divergence, 15, 32, 43, 45, 51, 67, 69, 147,
161,
164,
167, 180, 186,
204,
273
Diversification, 215, 222
Dollar, U.S.: .
and commodity prices, 56-57, 75
vs. the CRB Index, 59-62, 70-72, 264
foreign currencies and, 66
gold market and, 60, 63-65, 73, 256, 265
and inflation, 40, 54, 56, 72-73
and interest rates, 9, 19, 74, 75-79, 94
in intermarket analysis, 54
lead time and, 63, 70, 90
sequence of in market turns, 90
vs. the stock ma!rket, 54, 86-89
and the stock market crash of 1987,
17-18, 19, 88, 243
vs. Treasury bill futures, 83-86
and Treasury bonds, 57-59, 77, 78, 79,
82-83
Double bottom, 65, 67, 69, 71, 129, 133,
152, 273,
275
Double top, 43, 45, 62, 89, 160, 161, 162,
165, 172,
175, 177,
181,
182, 212, 273,
275
Dow Jones Industrial Average, 17, 18, 22,
41, 42, 43,
86,«
87,
129, 152, 165, 173,
266,
273
INDEX
bonds, utilities, and, 184-185, 263
vs. crude oil, 270
Dow Jones Transportation Average, 173, 273
Dow Jones 20 Bond Average, 180, 230
Dow Jones Utility Average, 10, 19, 172, 180,
185
vs. the Dow Jones Industrial Average,
173-177
Down gap, 274
Downtrend, 23, 184, 215, 227, 276
Down trendline, 273
Dow Theory, 14, 173, 185, 273
Drought, market effects of, 24, 25, 38, 98,
212
Economic forces, 3
Economic forecasting, 229-230
Economist Commodity Price Index, 144,
145-146, 147
Efficient frontier, 222-223
Elliott wave analysis, 6, 273-274, 275
Energy markets, 8, 9, 95, 98, 110, 112,
113-114, 116, 147, 149. See also Oil
markets
group analysis, 188, 192-194
Eurodollars, 35, 36, 38, 52
Exchange rate, 93, 256
Exhaustion gap, 274
Expansion, 10, 22, 54, 225, 226, 229
Exponential smoothing, 274
Fast stochastics, 275
Federal Reserve Board, 9, 35, 47, 48, 52, 75,
76, 79, 87, 146
commodities and policy of, 96, 116-117
Fibonacci number, 273
Financial Times Stock Exchange (FTSE) 100
share index, 129, 138
Flags, 273, 274, 275
Flight to quality, 152
Flight to safety, 24, 47, 76, 87, 153
Foreign currency markets, 60, 66—68
Franc, Swiss, 66
France, 142
Fundamental analysis, 7, 274
Futures markets, 7-8, 53, 95, 216-217, 255
Gaps, 274
Globalization, 11, 53, 256-257
Gold, 53
and the dollar, 60, 63-65, 70-72, 73, 265
vs. the Dow Jones Industrials, 232, 266
279
foreign currencies and, 66-68
vs. gold mining shares, 150-157, 158
as a key to vital intermarket links, 38, 93
as a leading indicator of the CRB Index,
68-70, 227, 233
as a leading indicator of inflation, 91-92,
93, 94, 98, 150
and oil, 114-115, 200
and the stock market, 91-92, 152
Gold mining shares, 93, 147, 149, 195, 198
vs. gold, 9, 150-157, 158
vs. money center stocks, 170-171
Gold mutual funds, 152, 153
Gold/silver ratio, 199
Grain markets, 8, 38, 98, 110, 111, 188 :
Great Britain, 2, 7, 10, 66, 124, 125, 126,
127, 128-132, 145, 267
Group analysis, 110-113, 187, 188
Head and shoulders, 13, 106, 165, 166, 174,
274,275
Hedging, 206, 213, 220, 222
Heller, Robert, 116
Index arbitrage, 242
Individual rankings, 187, 200-202
Inflation, 13, 40, 56, 72-73, 86, 96
commodity price trends as a key to,
3, 20-21, 57-59, 60
global, 141-143
gold and, 91-92, 93, 94, 98, 150
Interest-rate differentials, 93
Interest rates:
bonds and, 3
and commodities, 13, 22, 106-108
vs. the
CRB, PPI,
and
CPI,
120
and the dollar, 9, 19, 74, 75-79, 86, 94
global,
139-141
and inflation, 20, 86
long-term, 12, 75, 79-82
metals
and
energy futures
vs.,
115-116
Short-term, 35-36, 52, 75-82
and the stock market crash, 16, 17
and stocks, 40, 52-53
Interest-sensitive stocks, 147, 150, 164-165,
172,
229
Intermarket analysis:
as background information, 5, 6
basic principles and relationships in, 5,
255
and the business cycle, 225-239
commodities as the missing link in,
255-256
280
computerization and globalization,
256-257
defined, 1, 274
futures market and, 5, 7-8, 255
on a global scale, 144-145, 147
historical perspective on, 53-54
implications for technical analysis, 2-3,
5, 254
key market relationships, 9
need for, 2, 34-35
new directions in, 257
outward focus of, 5, 6-7, 253-254
related markets, 151
role of commodity markets in, 8
starting point for, 19, 74
of stock groups, 150
updates on, 259-271
Intermarket indexes, global, 144-145, 147
International markets, see Overseas
markets
Inverse head and shoulders, 274
Inverted yield curve, 52
Island reversal, 274
Isolation, 1, 2, 5, 253
Italy, 142
Japari, 2, 10, 122, 124, 125, 126, 127,
132-139, 142, 145, 242-243, 251,
267,
268
Johnson, Manuel, 116, 146
Journal of Commerce (JOC) Index, 9,
99-100, 108, 121, 226, 235, 239
vs. the CRB Futures Index, 104-106
Key reversal day, 274
Leading Indicators of the 1990s, 230, 232
Left shoulder, 13, 14, 168
Line charts, 274
Lintner, John, 219
Long-leading index, 230-231
Long-term interest rates, 12, 75, 79-82
McGinley, Jr., John G., 174
Managed futures accounts, 219, 224
Managed Account Reports, 220
Market analysis, 5
Market sectors, 3, 4-5, 7, 9, 12, 74, 94, 122,
134, 138, 217, 218-219, 250, 252, 256,
260
INDEX
Measuring gap, 274, 275
Momentum, 274
Money center banks, 149, 165, 170-171
vs. the NYSE Composite Index, 169-170
Money market prices, 144-145
Moore, Geoffrey, 230-231
Moving average, 6, 8, 145, 274
Negative divergence, 15, 32, 51, 167, 180
Negative yield curve, 79
New York Futures Exchange, 117
New York Stock Exchange (NYSE)
Composite Index, 39, 169-170
Nikkei 225 Stock Average, 132, 133, 134,
136
Oil market, 14, 38, 98
crude prices, 14, 118, 134, 138-139, 159,
160, 179,
270
and gold, 114-115, 200
vs. Oil stocks, 158-161, 162-164, 271
price regulation, 53
Open interest, 274
Oscillators, 6, 8, 15, 31, 32, 42, 274
Overbought condition, 34, 274
Overseas markets, 3, 7, 8, 9, 10, 19, 53, 68,
93
world stock markets, 122-124
Oversold condition, 34, 205, 274
Pennants, 273, 274-275
% Investment Advisors Bullish, 275
Platinum stocks, 195, 196, 198
Portfolio insurance, 12
Positive divergence, 43, 67, 69
Positive yield curve, 52
Pound sterling, British, 66
Precious metals markets, 8, 9, 22, 95, 98,
110, 113-114, 115
group analysis, 188, 194-198
Price differences, 274
Price patterns, 8, 275
Pring, Martin, 226, 228, 234
Producer Price Index (PPI), 9, 20, 35, 96,
117-120, 121, 138, 222
Program trading, 5, 11, 12, 124
causes of, 241-242
as an effect, 241
an example from one day's trading,
242-244
media treatment of, 241-242
INDEX
as a scapegoat, 242-243
a visual look at the morning's trading,
244-251
Rate(s) of change, 274, 275
Ratio analysis, 10, 35, 187, 206, 223
defined, 275
of the CRB Index vs. bonds, 207-211
Recession, 22, 47, 48, 54, 172, 225, 227,
236,
237
Relative ratio, 187, 204, 207
Relative strength, 39, 152, 275
analysis, 10, 35, 186-187, 202, 206, 213
ratios, 187-188
Relative-Strength Index, 187, 275
Resistance, 8, 33-34, 275
Retracements, 275
Reversal patterns, 19, 43, 44, 129, 275
Right shoulder, 165, 168, 174, 176
Ripple effect, 5, 86, 180, 242, 243
Rising bottom, 67, 69
Risk, 219, 221-222, 223
Runaway gap, 275
Salomon Brothers Long-Term High-Grade
Corporate Bond Index, 220-221
Saucer, 275
Savings and loan stocks, 149, 174
vs. bonds, 165-168
vs. CRB Index, 168-169
Sentiment indicators, 275
Short-leading index, 231
Short-term interest rates, 35-36, 52, 75-82
Silver mining stocks, 164, 171, 194, 197,
199
Simple average, 275
Slow stochastics, 275
Spot Foodstuffs Index, 96, 99, 100-101,
102, 108,
234
Spot prices, 95, 98
Spot Raw Industrials Index, 9, 96, 99,
100-101,
102, 226, 234,
235
Standard & Poor's (S&P) 500 stock index,
164, 186, 220, 241, 245, 246, 250,
275
Standard & Poor's (S&P) Savings and Loan
Group Index, 165
vs. the CRB Index, 168-169
vs. the Dow Jones Industrial Average, 165
Standard deviation, 221-222
Stochastics, 31, 32, 42, 275
Stock groups, 9, 149-172
and related commodities, 149-150
281
Stock market:
bottom of 1982, 42-43
British and U.S. compared, 2, 124, 125,
126, 127, 128-132, 267
on a global scale, 148, 254
gold and, 91-92, 152
Japanese and U.S. compared, 2, 124, 125,
126, 127,
132-139,
142, 267,
268
Stock market crash of 1987, 76, 152. See
also Program trading
bond market collapse as a precursor of, 9,
14-17, 43, 47
environment prior to, 12-14, 58
global impact of, 1, 2, 12, 124-127, 242
interest rates and, 16, 17
reasons for, 12, 242
role of the dollar in, 17-18, 19, 88, 243
Stock market mini-crash of 1989, 127, 153,
157
Stocks:
vs. bonds, 9, 15, 40-55, 262
and commodities, 90-91
compared to Treasury bonds, 44
CRB Index vs., 211-216
and the dollar, 54, 86-89
and futures activity, 10
interest rates and, 52-53
Support, 275-276
Symmetrical triangle, 13, 14, 160, 275, 276
Technical analysis, 2-3, 5, 6, 8, 34-35, 254,
257,
276
Three-steps-and-a-stumble rule, 52-53, 135
Trading range, 276
Treasury bills, 36-38, 52, 75-79, 83-86
Treasury bonds, 10, 13, 21, 22-30, 32, 35,
36, 37, 44, 261
Trend, 276
Trendlines, 6, 8, 14, 32, 169, 207, 208,
276
Triangles, 273, 276
Trin, 273
Triple bottoms, 275, 276
Triple tops, 275, 276
US. Dollar, see Dollar, U.S.
U.S. Dollar Index, 7, 62, 71, 216, 218
Up
gap,
274
Uptrend, 32, 46, 152, 276
Up trendline, 276
Utilities, 172,
178-181,
185.
See
also
Dow
Jones Utilities Average
282
Volume, 6, 276
Wave identification, 274
Weighted average, 276
West Germany, 142, 244, 257
Wilder, Jr., Welles, 275
INDEX
World Short Rates, 144
World Stock Index, 144
Yen, Japanese, 66, 135, 242-243, 251
Yield curve, 52, 79, 82, 117
Zarnowitz, Victor, 232