Báo cáo hóa học: " Hydrothermal Synthesis, Microstructure and Photoluminescence of Eu3+-Doped Mixed Rare Earth Nano-Orthophosphates" pot
Bạn đang xem bản rút gọn của tài liệu. Xem và tải ngay bản đầy đủ của tài liệu tại đây (679.82 KB, 8 trang )
NANO EXPRESS
Hydrothermal Synthesis, Microstructure and Photoluminescence
of Eu
3+
-Doped Mixed Rare Earth Nano-Orthophosphates
Bing Yan
•
Xiuzhen Xiao
Received: 19 April 2010 / Accepted: 5 August 2010 / Published online: 18 August 2010
Ó The Author(s) 2010. This article is published with open access at Springerlink.com
Abstract Eu
3?
-doped mixed rare earth orthophosphates
(rare earth = La, Y, Gd) have been prepared by hydro-
thermal technology, whose crystal phase and microstructure
both vary with the molar ratio of the mixed rare earth ions.
For La
x
Y
1–x
PO
4
:Eu
3?
, the ion radius distinction between
the La
3?
and Y
3?
is so large that only La
0.9
Y
0.1
PO
4
:Eu
3?
shows the pure monoclinic phase. For La
x
Gd
1–x
PO
4
:Eu
3?
system, with the increase in the La content, the crystal phase
structure of the product changes from the hexagonal phase to
the monoclinic phase and the microstructure of them chan-
ges from the nanorods to nanowires. Similarly, Y
x
Gd
1–x
PO
4
:
Eu
3?
,Y
0.1
Gd
0.9
PO
4
:Eu
3?
and Y
0.5
Gd
0.5
PO
4
:Eu
3?
samples
present the pure hexagonal phase and nanorods micro-
structure, while Y
0.9
Gd
0.1
PO
4
:Eu
3?
exhibits the tetragonal
phase and nanocubic micromorphology. The photolumi-
nescence behaviors of Eu
3?
in these hosts are strongly
related to the nature of the host (composition, crystal phase
and microstructure).
Keywords Mixed rare earth orthophosphate Á
Nanophosphors Á Europium ion Á Hydrothermal synthesis Á
Microstructure Á Photoluminescence
Introduction
Nanostructure materials with controlled chemical composi-
tion, crystal phase structure, morphology and particle size
have been extensively investigated during the past few
decades because of their high surface/volume ratio and the
special quantum confinement effect [1, 2]. Nanomaterials
can show remarkable tunable properties and play an impor-
tant role as active components in the preparation of nano-
scale electronic, optical, optoelectronic, electrochemical and
electromechanical devices [3–7]. Herein, the fabrication of
nanomaterials with well-controlled dimensionality, mor-
phologies, phase purity, chemical composition and desired
properties remains one of the most challenging issues [8].
One simple solution to control the particle size and mor-
phology is soft chemistry routes and in particular the
hydrothermal process, which is extensively employed in the
synthesis of rare earth ions activated inorganic compounds,
such as yttrium vanadate, lanthanum fluoride, lanthanum
phosphate and yttrium oxide [9–11].
Because of their excellent luminescent properties, rare
earth orthophosphates have been extensively applied as
phosphors, laser hosts, heat resistant materials and moisture
sensors, whose crystal structure and synthesis technology
have been studied long time ago [12, 13]. For example,
LaPO
4
: Ce, Tb phosphors have been used as green emis-
sion component of tri-chromatic luminescent lamp [14,
15]. Presently, it is important to synthesize rare earth
orthophosphate phosphors with regular morphology, com-
position and size. Ever since Meyssamy et al. has fabri-
cated LaPO
4
: Eu and LaPO
4
: Tb nanocrystals by a simple
hydrothermal method, lots of works have been focused on
the study of rare earth phosphate nanocrystals [16–27]. The
crystal structure of pure LnPO
4
compounds can be changed
with the decrease in Ln ionic radius: i.e., the orthophos-
phates structure from Ho to Lu as well as Y only exist in
the tetragonal zircon (xenotime) structure, while the lan-
thanide orthophosphates structure (Ln = La* Dy) exist in
the hexagonal structure under hydrothermal treatment [28].
Mixed orthophosphates composed of two rare earth ele-
ments have also been investigated, indicating that these
B. Yan (&) Á X. Xiao
Department of Chemistry, Tongji University,
200092 Shanghai, China
e-mail:
123
Nanoscale Res Lett (2010) 5:1962–1969
DOI 10.1007/s11671-010-9733-8
phosphates can be used as host lattices for spectroscopic
investigations [29–35].
For REPO
4
phosphor of light RE
3?
with larger ion
radius, the monoclinic crystal phase structure is preferred.
For REPO
4
phosphor of middle RE
3?
with intermediate
radius, a partly hydrated hexagonal structure is favorable.
For REPO
4
phosphor of heavy RE
3?
with smaller radius, a
tetragonal crystal phase is adopted. Therefore, it is very
interesting that what will happen when rare earth ions with
different radii are introduced into one REPO
4
systems with
PO
4
3-
. In this text, we have investigated the crystal phase
structures, microstructure (morphology and particle size) of
the mixed orthophosphates REPO
4
(RE = La, Gd, Y) pre-
pared by a facile hydrothermal technology. Because of the
difference in ion radii between these rare earth ions, the
crystal phase and microstructure of the products show
obvious differences. At the same time, Eu
3?
ions have been
doped in the mixed rare earth phosphates in order to
examine the influence of the hosts on the luminescence of
Eu
3?
, whose photoluminescent behaviors are studied in
detail.
Experimental Section
Synthesis of the Mixed Orthophosphates
The starting materials La
2
O
3
,Y
2
O
3
,Gd
2
O
3
and Eu
2
O
3
are
firstly dissolved into concentrated nitric acid, and the
appropriate volume of deionized water was added to form
the 0.2 mol l
-1
RE(NO
3
)
3
(RE = Y, La; La, Gd; Y, Gd)
and 0.02 mol l
-1
Eu(NO
3
)
3
, respectively. Then, the mixed
orthophosphates doped with Eu
3?
nanophosphors are syn-
thesized by the hydrothermal process, which are described
in the following: the different volume of Y(NO
3
)
3
,
La(NO
3
)
3
(Gd(NO
3
)
3
, La(NO
3
)
3
; Y(NO
3
)
3
, Gd(NO
3
)
3
) and
Eu(NO
3
)
3
(1:0.05 in molar ratio) solutions are mixed with
appropriate amounts of NH
4
H
2
PO
4
to form the emulsion.
The final pH value is adjusted to 3.0 with HNO
3
solution
(1 M). After being stirred, the milky colloid precursor is
obtained, suggesting that the nanoscale particle formation
already occurred. In order to make the products to crystal-
lize well, the milky colloid precursor is poured into closed
Teflon-lined autoclaves to be treated by hydrothermal pro-
cess (pressure 2.8 MPaG, 0Cr18Ni9Ti stainless steel out-
door shell, 25 mL, safe temperature 200°C, Peking
University Qingniao Company, China) at 160°C for 3 days.
The resulting product is filtered, washed with deionized
water and absolute alcohol to remove ions possibly
remaining in the final products Y
x
La
1–x
PO
4
:5%Eu
3?
,
La
x
Gd
1-x
PO
4
:5%Eu
3?
,Y
x
Gd
1–x
PO
4
:5%Eu
3?
, respec-
tively, (x = 0.1, 0.5, 0.9) and finally dried at 60°C in air for
further characterization.
Physical Characterization
The X-rays powder diffraction (XRD) patterns of all
samples are performed on a Bruke/D8-Advance with CuKa
radiation (k = 1.540 A
˚
), whose operation voltage and
current are maintained at 40 kV and 40 mA, respectively.
Transmission electron microscopic (TEM) images are
obtained on a JEOL 2010 microscope with an accelerating
voltage of 200 kV. The excitation and emission spectra are
recorded with RF-5301 spectrophotometer (resolution used
in the excitation and emission spectra measurement is
1 nm). All spectra are normalized to a constant intensity at
the maximum. Luminescence lifetime measurements are
carried out on an Edinburgh FLS920 phosphorimeter using
a 450 W xenon lamp as excitation source. A Netzsch
thermoanalyzer, STA 409, is used for simultaneous thermal
analysis combining the thermogravimetry (TG) and dif-
ferential scanning calorimetry (DSC) with a heating rate of
10°C min
-1
.
Results and Discussion
Crystal Phase and Microstructure of Mixed Rare Earth
Phosphates
Li et al. have studied the crystal phase structure of the mixed
rare earth phosphates, indicating that pure LaPO
4
and YPO
4
crystallize in monoclinic phase and tetragonal phase,
respectively, while the mixed phosphate of La
0.5
Y
0.5
PO
4
belongs to the hexagonal phase [36]. However, the crystal
phase structure of the mixed orthophosphates Y
x
La
1–x
PO
4
(x = 0.1, 0.5, 0.9) can be changed with different molar ratio
of Y
3?
to La
3?
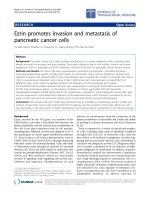
, whose XRD pattern of mixed orthophos-
phates is shown in Fig. 1a. The change of the XRD pattern
for Y
x
La
1–x
PO4 (Fig. 1a) depending on the Y:La molar ratio
is well known as analyzed as typical solid solution. With the
decrease in yttrium ion content, the tetragonal phase cannot
be observed and the monoclinic phase appears. With La
3?
to
Y
3?
of 9:1 M ratio, the product shows the pure monoclinic
phase, just like the pure LaPO
4
. The final product
La
0.1
Y
0.9
PO
4
:Eu
3?
presents the mixture of hexagonal
LaPO
4
and tetragonal YPO
4
for they cannot form the solid
solution. As for La
x
Gd
1–x
PO
4
(x = 0.1, 0.5, 0.9), the mixed
rare earth phosphates La
x
Gd
1–x
PO
4
(x = 0.1, 0.5) have the
similar pure hexagonal phase, while La
0.9
Gd
0.1
PO
4
belongs
to the pure monoclinic phase (Fig. 1b). The XRD patterns of
the mixed Y
x
Gd
1–x
PO
4
(x = 0.1, 0.5, 0.9) are shown in
Fig. 1c. The mixed rare earth phosphates Y
x
Gd
1–x
PO
4
(x = 0.1 and 0.5) show the hexagonal phase with the dif-
ferent peak intensities. On the base of the literatures, the
GdPO
4
powders in most cases have been reported to have the
pure hexagonal phase. Besides, the ion radii of Y
3?
and
Nanoscale Res Lett (2010) 5:1962–1969 1963
123
Gd
3?
are 88 pm and 93.8 pm, respectively, so the replace-
ment of Gd
3?
by Y
3?
cannot have an influence on the final
crystal phase structure of the product until the content of Y
3?
reaches 0.9 mol. With the 1:9 M ratio of Gd
3?
and Y
3?
,
Y
0.9
Gd
0.1
PO
4
present to the pure tetragonal phase. In one
word, because the ion radii of Y
3?
,Gd
3?
and La
3?
are 88,
93.8 and 106.1 pm, respectively, the radii difference
between rare earth ions strongly affects the crystal phase and
microstructure the mixed rare earth phosphates. The dif-
ference in radius between Y
3?
and La
3?
is so large that it is
not easy to form the product of the single phase. Addition-
ally, the difference in radius between La
3?
and Gd
3?
(Gd
3?
and Y
3?
) is smaller than that of Y
3?
and La
3?
, so the product
can present the pure phase with the different content ratio of
the rare earth ions. Besides, the calculated grain sizes of
these samples are in the range of 12–40 nm using Scherrer’s
equation, which delegates the dimension in the normal
direction of (111) plane.
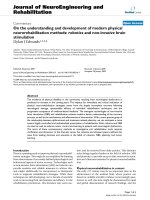
As for the selected TG curves of the hexagonal mixed
rare earth orthophosphates (Fig. 2), there exists the weight
loss, which occurs in the range of 150–250°C. This indi-
cates a rapid loss of water molecules from the crystal lat-
tice. Thus, it further proves that the mixed rare earth
orthophosphates are hexagonal phase with the hydrated
powders. Besides, only a significant weight loss of 6.4 wt%
occurred at 165°C and finished at 225°C, approximately
corresponding to around 1 mol of H
2
O, whose weight loss
phenomenon is similar to the report in ref. [35]. Certainly,
the existence of water molecule is necessary to stabilize the
hexagonal phase [25].
Furthermore, we also have examined the microstructure
(particle size and morphology) of the mixed rare earth
orthophosphates with the different molar ratio. As shown in
Fig. 3,La
0.1
Y
0.9
PO
4
product (Fig. 3c) is composed with
x = 0.1
x = 0.5
x = 0.9
La
x
Y
1-x
PO
4
: 5 % Eu
3+
Relative Intensities / a.u.
2θ /
ο
x = 0.1
x = 0.5
x = 0.9
La
x
Gd
1-x
PO
4
: Eu
3+
Relative Intensities / a.u.
2θ /
ο
10 20 30 40 50 60 70
x = 0.9
x = 0.5
x = 0.1
Y
x
Gd
1-x
PO
4
: 5 % Eu
3+
Relative Intensities / a.u.
2θ /
ο
10 20 30 40 50 60 70
10 20 30 40 50 60 70
(A)
(B)
(C)
Fig. 1 The XRD patterns of Y
x
La
1-x
PO
4
: 5 mol% Eu
3?
(a),
La
x
Gd
1-x
PO
4
: 5 mol% Eu
3?
(b) and Y
x
Gd
1-x
PO
4
: 5 mol% Eu
3?
(c)(x = 0.1, 0.5, 0.9)
100 200 300 400
-10
-8
-6
-4
-2
0
Temperature /
o
C
DSC / (mW/mg)
96
98
100
TG/%
Fig. 2 Selected TG and DSC curves of Y
0.5
Gd
0.5
PO
4
: 5 mol% Eu
3?
1964 Nanoscale Res Lett (2010) 5:1962–1969
123
the mixed morphologies of the nanoparticles and nanorods
(conglomeration of nanowires), which is consistent with
the coexistence of the mixed hexagonal and tetragonal
phases. Rare earth orthophosphate with hexagonal phase
shows a highly anisotropic structure and is favorable for
the crystal growth along a certain direction and form the
nanorods or nanowires, while it is contrary to the rare earth
phosphate with tetragonal structure to form nanoparticles
[37, 38]. The actual particle size of these nanophosphors
can be estimated to be around 20–80 nm from the mea-
surement of TEM. On the other hand, Y
x
La
1–x
PO
4
samples
with hexagonal phase and monoclinic phase are composed
of nanowires. Figure 4 shows the TEM images of the
mixed orthophosphates La
x
Gd
1–x
PO
4
(x = 0.1, 0.5, 0.9),
which presents nanowires or nanorods. With the increase in
the La
3?
content, the ratio of the length to width for the
particle is changed. When the molar ratio of Gd
3?
is higher
than 0.5, nanorods is dominated. On the contrary, the
nanowires are preferred. However, it needs to be referred
that the products present more uniform morphology of
nanorods at the molar ratio of Gd
3?
:La
3?
of 1:1 than at
other molar ratios. The actual particle size of these nano-
phosphors can be estimated to be around 20–50 nm from
the measurement of TEM. Figure 5 shows the micro-
structure of the mixed orthophosphates Y
x
Gd
1–x
PO
4
(x = 0.1, 0.5, 0.9). Both Y
0.1
Gd
0.9
PO
4
and Y
0.5
Gd
0.5
PO
4
show nanorod morphology. The actual particle size of them
can be estimated to be around 50–200 nm from the mea-
surement of TEM. Generally, only tetragonal nanocube can
be obtained for YPO
4
under such identical conditions,
Fig. 3 The TEM pictures of Y
0.1
La
0.9
PO
4
: 5 mol% Eu
3?
(a),
Y
0.5
La
0.5
PO
4
: 5 mol% Eu
3?
(b), and Y
0.9
La
0.1
PO
4
: 5 mol% Eu
3?
(c)
Fig. 4 The TEM pictures of La
0.1
Gd
0.9
PO
4
: 5 mol% Eu
3?
(a),
La
0.5
Gd
0.5
PO
4
: 5 mol% Eu
3?
(b), and La
0.9
Gd
0.1
PO
4
: 5 mol% Eu
3?
(c)
Nanoscale Res Lett (2010) 5:1962–1969 1965
123
which cannot be observed in the TEM images of
Y
0.1
Gd
0.9
PO
4
and Y
0.5
Gd
0.5
PO
4
products. This is the evi-
dence that we have synthesized Y
x
Gd
1–x
PO
4
instead of the
mixture of YPO
4
and GdPO
4
. Besides this, tetragonal
Y
0.9
Gd
0.1
PO
4
presents pure nanocube particle. These phe-
nomena are strongly related to the different ratio of the rare
earth ions that have the different ion radii.
Generally speaking, the inherent crystal structure
determines the crystal growth habitual behavior and final
morphology. The hexagonal phase crystal of Y
x
La
1–x
PO
4
commonly appears the anisotropic growth, in which exists
apparent layer-like structure along C axle while not along
other axles. So it prefers to grow along c axle to release
more energy and form the more stable system than other
two directions [18, 37, 38]. Finally, Y
x
La
1–x
PO
4
with
hexagonal phase will grow to form nanowire or nanorod
along [001] direction. On the other hand, the tetragonal
phase of mixed orthophosphate does not possess apparent
layer-like structure and cannot show the dominated growth
direction, resulting in the irregular nanoparticles. For pure
monoclinic La
0.1
Y
0.9
PO
4
:Eu
3?
, crystal structure consists
of isolated PO
4
tetrahedron and REO
9
-PO
4
chain parallel
with c axle. So the crystal still prefers to grow along the
[001] direction to make crystal system more stable in spite
of that the existence of the chain is not so apparent as layer-
like structure of hexagonal phase [18, 37, 38].
Photoluminescent Spectra of Mixed Rare Earth
Phosphates
The luminescence of rare earth ions mainly originates from
the electron transitions within the 4f shell. However, tri-
valent Y, La and Lu ions have the empty or completely
filled 4f shells, which cannot produce the f–f transitions.
Similarly, trivalent Gd
3?
has a half-filled 4f shell, and the
transition energy for f–f transitions of Gd
3?
is much higher
than for other Ln
3?
with partially filled 4f shells, which is
not easy to emit the luminescence too [36]. As a result, the
phosphates of these ions are used as host lattice for Eu
3?
.
Herein, we have synthesized the Eu
3?
activated mixed rare
earth phosphates and investigated the luminescence of
Eu
3?
in these hosts. Both excitation and emission spectra
of La
x
Gd
1–x
PO
4
(x = 0.1, 0.5, 0.9) are shown in Fig. 6.
The excitation spectra consist of a broad band in the short
wavelength region and several sharp lines in the long
wavelength region. The broad band can be ascribed to the
oxygen-to-europium charge transfer band (CTB), whereas
the sharp lines correspond to direct excitation of the ground
state into higher excited states of the 4f electrons for Eu
3?
.
The position of the CTB of Eu
3?
in the lattice of hexagonal
Fig. 5 The TEM pictures of Y
0.1
Gd
0.9
PO
4
: 5 mol% Eu
3?
(a),
Y
0.5
Gd
0.5
PO
4
: 5 mol% Eu
3?
(b), and Y
0.9
Gd
0.1
PO
4
: 5 mol% Eu
3?
(c)
300 400 500 600 700
5
D
0
7
F
1, 2, 3, 4
8
S
7/2
6
I
J
CTB
5
G
J
7
F
0,1
5
D
4
7
F
0,1
5
L
7, 6
La
x
Gd
1-x
PO
4
: 5 % Eu
3+
Relative Intensities / a.u.
Wavelength / nm
x = 0.5
x = 0.1
x = 0.9
Ex
Em
Fig. 6 The excitation (a) and emission (b) spectra of La
x
Gd
1-x
PO
4
:
5 mol% Eu
3?
(x = 0.1, 0.5, 0.9)
1966 Nanoscale Res Lett (2010) 5:1962–1969
123
phosphates shifts slightly toward shorter wavelength com-
pared with that in monoclinic La
0.9
Gd
0.1
PO
4
:Eu
3?
((
CTB
=
268 nm), being centered at 255 nm for La
01
Gd
0.9
PO
4
:Eu
3?
and 263 nm for La
0.5
Gd
0.5
PO
4
:Eu
3?
. This result can be
explained by the differences in the Eu–O bond lengths. In
the monoclinic rare earth phosphate, RE
3?
ion is nine-
coordinated, while in the hexagonal rare earth phosphate, it is
eight-coordinated. This indicates that the average RE–O
bond lengths in La
0.1
Gd
0.9
PO
4
:Eu
3?
and La
0.5
Gd
0.5
PO
4
:
Eu
3?
are shorter than that in monoclinic La
0.9
Gd
0.1
PO
4
:
Eu
3?
. Furthermore, it is observed a new absorption band for
La
0.1
Gd
0.9
PO
4
:Eu
3?
, which peaks at 273 nm. This band is
attributed to the
8
S
7/2
–
6
I
J
transitions within Gd
3?
ions,
indicating the occurrence of the energy transfer process from
gadolinium ions to europium ones. The emission spectra of
La
x
Gd
1-X
PO
4
:Eu
3?
(x = 0.1, 0.5, 0.9) under 393 nm
excitation are composed of the characteristic emission lines
of Eu
3?
:
5
D
0
–
7
F
1
,
5
D
0
–
7
F
2
,
5
D
0
–
7
F
3
and
5
D
0
–
7
F
4
, respec-
tively. The transitions are found to be split into components
depending upon the host matrix composition. These phos-
phors exhibit orange-red color due to the emission transitions
5
D
0
–
7
F
1
(magnetic dipole line) and
5
D
0
–
7
F
2
(electric dipole
line), respectively. Furthermore, the intensity of the transi-
tion
5
D
0
–
7
F
1
is stronger than that of the transition
5
D
0
–
7
F
2.
As is well known, the relative intensities of
5
D
0
–
7
F
1
and
5
D
0
–
7
F
2
emission, which are typical magnetic and electronic
dipole–dipole transitions, respectively, depend strongly on
the local symmetry of the Eu
3?
[35–37]. In a site with
inversion symmetry, the
5
D
0
–
7
F
1
magnetic dipole transition
is dominating, while in a site without inversion symmetry the
5
D
0
–
7
F
2
electric dipole transition is the strongest. The results
already indicate that more Eu
3?
occupied the position with
the inversion symmetry in host lattices. At the same time,
we have found that the intensity of the Eu
3?
emissions
in La
0.5
Gd
0.5
PO
4
is stronger than that of the other two
samples. This can be attributed to the morphology of the
La
0.5
Gd
0.5
PO
4
, which presents more uniformity nanorods
among these three samples.
For the mixed rare earth phosphate Y
x
Gd
1–x
PO
4
:Eu
3?
(x = 0.1, 0.5, 0.9), both excitation and emission spectra are
shown in Fig. 7, which have the similar features to the
above. It can be observed the CTB band of O
2-
to Eu
3?
(belonging to PO
4
3-
, here ‘‘
2-
’’ is only the formatted charge
of O in PO
4
2-
), peaking at 253 nm and a sharp absorption
band from
8
S
7/2
–
6
I
J
transitions for Gd
3?
, revealing the
existence of the energy transfer process between Gd
3?
and
Eu
3?
. The characteristic emissions of Gd
3?
are situated at
the strong excitation band of Y
x
Gd
1–x
PO
4
, suggesting that
there exists the energy transfer of Gd
3?
?PO
4
3-
? Eu
3?
,at
the same time, the energy level difference in
6
G
J
and
6
P
J
of
Gd
3?
is close to that of
7
F
1
and
5
D
0
of Eu
3?
,aGd
3?
in
6
G
J
state can excite Eu
3?
into
5
D
0
state by resonance energy
transfer, which results in the energy transfer of Gd
3?
to Eu
3?
[39]. Besides this, several strong absorption bands have been
observed in the long region of 300–500 nm, which originate
from the Eu
3?
f–f transitions. Figure 6B shows the emission
spectra of the Y
x
Gd
1–x
PO
4
:Eu
3?
with the different content
ratio of Y
3?
to Gd
3?
ions. The characteristic emission can be
seen obviously (
5
D
0
?
7
F
J
) originating from low energy
transfer of Eu
3?
. Among these emission lines,
5
D
0
?
7
F
1
transition is dominant. This indicates that in these hosts,
more Eu
3?
sites are in inversion symmetry. With the content
of Gd increases, the intensity of
5
D
0
?
7
F
1
emission
increases. Obviously, Gd
3?
plays an intermediate role in the
energy transfer from PO
4
3-
to the activator. The energy
transfer process in Y
x
Gd
1–x
PO
4
:Eu
3?
may be described as
follows [40]: energy is first absorbed by host absorption
band, then is trapped by Gd
3?
ions and migrated along them
until it is trapped by the activator, resulting in the charac-
teristic luminescence. Certainly, Eu
3?
also can obtain
energy from host band directly. Besides, it can be seen the
luminescent intensity of Y
0.9
Gd
0.1
PO
4
:Eu
3?
is weaker than
those of other composition, suggesting that the tetragonal
phase of Y
0.9
Gd
0.1
PO
4
:Eu
3?
is not so favorable as the
hexagonal phase of Y
0.9
Gd
0.1
PO
4
:Eu
3?
and Y
0.9
Gd
0.1
PO
4
:
Eu
3?
and the influence of crystal phase on the luminescence
is higher than that of water molecules. In addition, either
hexagonal phase or tetragonal one cannot show apparent
difference in the luminescent intensity of magnetic dipolar
transition (
5
D
0
?
7
F
1
) and electronic dipolar transition
(
5
D
0
?
7
F
2
).
The photoluminescence spectrum of Eu
3?
in monoclinic
phase La
0.9
Y
0.1
PO
4
has also been investigated, which is
shown in Fig. 8. There are no apparent excitation bands in
long wavelength of 300–400 nm and the effective energy
absorption takes place in the shorter wavelength of
250 300 350 400 450 500 550 600 650 700
Em
CTB
8
S
7/2
6
I
J
7
F
0,1
5
L
7, 6
5
G
J
7
F
0,1
5
D
4
5
D
0
7
F
1, 2, 3, 4
Y
x
Gd
1-x
PO
4
: 5 % Eu
3+
Relative Intensities / a.u.
Wavelength / nm
x = 0.5
x = 0.1
x = 0.9
Ex
Fig. 7 The excitation (a) and emission (b) spectra of Y
x
Gd
1-x
PO
4
:
5 mol% Eu
3?
(x = 0.1, 0.5, 0.9)
Nanoscale Res Lett (2010) 5:1962–1969 1967
123
200–280 nm, peaking at 270 nm. This broad band is
ascribed to the CTB band of O
2-
(belonging to PO
4
3-
, here
‘‘
2-
’’ is only the formatted charge of O in PO
4
2-
)toEu
3?
.
At the same time, under 270 nm excitation, the emission
originates mainly from those crystallographic Eu
3?
sites
due to the local energy transfer from Eu–O charge transfer
state to the adjacent Eu
3?
ions. The emission spectra are
composed with the characteristic Eu
3?
emission lines.
Different from the luminescent spectra of Y
x
Gd
1–x
PO
4
:
Eu
3?
and La
x
Gd
1–x
PO
4
:Eu
3?
, the emission intensity of
5
D
0
?
7
F
2
transition for Eu
3?
in La
0.9
Y
0.1
PO
4
is stronger
than that of
5
D
0
?
7
F
1
. This result shows that more Eu
3?
in the monoclinic La
0.9
Y
0.1
PO
4
occupied the site with less
inversion symmetry. When the Eu
3?
is located at a low-
symmetry local site lack of inversion center, the emission
at transition is dominated in the emission spectra [41–43].
The resulting lifetime data of the selected Eu-activated rare
earth orthophosphates (La
x
Gd
1–x
PO
4
,Y
x
Gd
1–x
PO
4
) are
given in Table 1. It can be observed that the composition of
hosts with different molar ratio of rare earth ions have great
influence on the luminescent lifetimes of excited state of
europium ions. Besides, there exists different order
between La
x
Gd
1–x
PO
4
:Eu
3?
and Y
x
Gd
1–x
PO
4
:Eu
3?
. For
La
x
Gd
1–x
PO
4
:Eu
3?
, the luminescent lifetime reaches the
longest (3.43 ms) at the x = 0.5, which is much longer
than the other two compositions (x = 0.1 or 0.9), sug-
gesting there exist a suitable molar ratio of La
3?
to Gd
3?
(1:1) for the luminescence of Eu
3?
. While it is different for
Y
x
Gd
1–x
PO
4
:Eu
3?
, whose lifetime decreases dramatically
with the increase in the molar ratio of Y, revealing the
introduction of Y ion is not suitable for the luminescence of
Eu
3?
.
Conclusions
In summary, the Eu
3?
activated rare earth phosphate
(Y
x
Gd
1–x
PO
4
,La
x
Gd
1–x
PO
4
and Y
x
La
1–x
PO
4
) nanophos-
phors (x = 0.1, 0.5, 0.9) have been synthesized by hydro-
thermal technology. The crystal phase and microstructure
of the products are strongly depended on the difference in
the ion radii of rare earth elements. For Y
3?
and La
3?
ions,
the difference in the radii is so large that Y
x
La
1–x
PO
4
cannot be favorable for the formation of the pure phase
except that Y
0.1
La
0.9
PO
4
powders present the pure mono-
clinic phase and nanowires. As for Y
x
Gd
1–x
PO
4
and
La
x
Gd
1–x
PO
4
, the radii difference between two rare earth
ions cannot make a big influence on the crystal structure
and the morphology. With the increase in the Y content in
Y
x
Gd
1–x
PO
4
, the structure of the product has been changed
from the hexagonal phase to the tetragonal phase and the
morphology from nanorods to nanowires. Similarly,
La
x
Gd
1–x
PO
4
(x = 0.1, 0.5) powders have the hexagonal
phase and La
0.9
Gd
0.1
PO
4
belongs to the monoclinic phase.
With the increase in the La
3?
content, the ratio of the
length to width has been changed. Y
0.1
Gd
0.9
PO
4
:Eu
3?
and
La
0.5
Gd
0.5
PO
4
:Eu
3?
nanophosphors present the longest
lifetime in the corresponding series. These lanthanide
phosphates can be expected to have some potential appli-
cations in such fields as fluorescent lamps, plasma display
panels and luminescent probes or labels for biomolecule
system.
Acknowledgments The work is supported by the Science Fund of
Shanghai University for Excellent Youth Scientists and National
Natural Science Foundation of China (20971100).
Open Access This article is distributed under the terms of the
Creative Commons Attribution Noncommercial License which per-
mits any noncommercial use, distribution, and reproduction in any
medium, provided the original author(s) and source are credited.
References
1. J.T. Hu, T.W. Odom, C.M. Lieber, Acc. Chem. Res. 32, 435
(1999)
2. N.I. Kovtyukhova, T.E. Mallouk, Chem. Eur. J. 8, 4355 (2002)
250 300 350 400 450 500 550 600 650 700
Em
CTB (Eu
3+
O
2-
)
5
D
0
7
F
1, 2, 3, 4
Relative Intensities / a.u.
Wavelength / nm
Ex
Fig. 8 The excitation (a) and emission (b) spectra of Y
0.1
La
0.9
PO
4
:
5 mol% Eu
3?
Table 1 Photoluminescence lifetimes for La
x
Gd
1–x
PO
4
Eu
3?
and
Y
x
Gd
1–x
PO
4
:Eu
3?
Nanophosphors
Nanophosphors La
0.1
Gd
0.9
PO
4
Eu
3?
La
0.5
Gd
0.5
PO
4
Eu
3?
La
0.9
Gd
0.1
PO
4
Eu
3?
s (ms) 1.10 3.43 0.85
Nanophosphors Y
0.1
Gd
0.9
PO
4
Eu
3?
Y
0.5
Gd
0.5
PO
4
Eu
3?
Y
0.9
Gd
0.1
PO
4
Eu
3?
s (ms) 1.98 1.23 0.38
1968 Nanoscale Res Lett (2010) 5:1962–1969
123
3. Y. Huang, X.F. Duan, Q.Q. Wei, C.M. Lieber, Science 291, 630
(2001)
4. M.H. Huang, S. Mao, H. Feick, H. Yan, Y. Wu, H. Kind,
E. Weber, R. Russo, P.D. Yang, Science 292, 1897 (2001)
5. Z.L. Wang, Adv. Mater. 12, 1295 (2000)
6. C. Dekker, Phys. Today 52, 22 (1999)
7. S. Frank, P. Poncharal, Z.L. Wang, W.A. de Heer, Science 280,
1744 (1998)
8. Y.N. Xia, P.D. Yang, Adv. Mater. 15, 351 (2003)
9. A. Huignard, T. Gacoin, J.P. Boilot, Chem. Mater. 12, 1090
(2000)
10. A. Huignard, V. Buissette, A.C. Franville, T. Gacoin, J.P. Boilot,
J. Phys. Chem. B 107, 6754 (2003)
11. K. Riwotzki, M. Haase, J. Phys. Chem. B 102, 10129 (1998)
12. R.C.L. Mooney, J. Chem. Phys. 16, 1003 (1948)
13. R.C.L. Mooney, Acta Crystallogr. 3, 337 (1950)
14. J. Dexpert – Ghys, R. Mauricot, M.D. Faucher, J. Lumin. 69, 203
(1996)
15. M.A. Aia, J. Electrochem. Soc. 114, 367 (1967)
16. H. Meyssamy, K. Riwotzki, A. Kornowski, S. Naused, M. Haase,
Adv. Mater. 11, 840 (1999)
17. H.T. Shi, L.M. Qi, J.M. Ma, H.M. Cheng, Chem. Commun. 1704,
(2002)
18. Y.P. Fang, A.W. Xu, R.Q. Song, H.X. Zhang, L.P. You, J. Yu,
H.Q. Liu, J. Am. Chem. Soc. 125, 16025 (2003)
19. W.B. Bu, Z.L. Hua, H.R. Chen, L.X. Zhang, J.L. Shi, Chem. Lett.
33, 612 (2004)
20. Z.G. Yan, Y.W. Zhang, L.P. You, R. Si, C.H. Yan, J. Cryst.
Growth 262, 408 (2004)
21. C.C. Tang, Y. Bando, D. Golberg, R.Z. Ma, Angew. Chem. Int.
Ed. 52, 576 (2005)
22. M.H. Cao, C.W. Hu, Q.Y. Wu, C.X. Guo, Y.J. Qi, E.B. Wang,
Nanotechnology 16, 282 (2005)
23. H. Ito, Y. Fujishiro, T. Sato, A. Okuwaki, Ber. Ceram. Trans. 94,
146 (1995)
24. R. Kijkowska, R.Z. LeGeros, Key Eng. Mater. 284–286,79
(2005)
25. C. Zollfrank, H. Scheel, S. Brungs, P.J. Greil, Cryst. Growth Des.
8, 766 (2008)
26. Z.A. Peng, X.G. Peng, J. Am. Chem. Soc. 123, 1389 (2001)
27. Z.A. Peng, X.G. Peng, J. Am. Chem. Soc. 124, 3343 (2002)
28. Y.W. Zhang, Z.G. Yan, L.P. You, R. Si, C.H. Yan, Eur. J. Inorg.
Chem. 4099, (2003)
29. K. Riwotzki, H. Meyssamy, H. Schnablegger, A. Kornowski,
M. Haase, Angew. Chem. Int. Ed. 40, 573 (2001)
30. K. Riwotzki, H. Meyssamy, A. Kornowski, M. Haase, J. Phys.
Chem. B 104, 2824 (2000)
31. S. Nishihama, T. Hirai, I. Komasawa, J. Mater. Chem. 12, 1053
(2002)
32. P. Schuetz, F. Caruso, Chem. Mater. 14, 4509 (2002)
33. D.F. Mullica, E.L. Sappenfield, L.A. Boatner, Inorg. Chim. Acta
244, 247 (1996)
34. H. Ito, Y. Fujishiro, T. Sato, A. Okuwaki, Br. Ceram. Trans. 94,
146 (1995)
35. R.X. Yan, X.M. Sun, X. Wang, Q. Peng, Y.D. Li, Chem. Eur. J.
11, 2183 (2005)
36. M.S. Wickleder, Chem. Rev. 102, 2011 (2002)
37. W.O. Milligan, D.F. Mullika, G.W. Beall, L.A. Boatner, Acta
Crystallogr. C39, 23 (1983)
38. W.O. Milligan, D.F. Mullica, G.W. Beall, L.A. Boatner, Inorg.
Chim. Acta 60, 39 (1982)
39. U. Rambabu, S. Buddhudu, Opt. Mater. 17, 401 (2001)
40. X.Y. Wu, H.P. You, H.T. Cui, X.Q. Zeng, G.Y. Hong,
C.H. Kim, C.H. Pyun, B.Y. Yu, C.H. Park, Mater. Res. Bull.
37, 1531 (2002)
41. Z.L. Wang, H.B. Liang, M.L. Gong, Q. Su, Opt. Mater. 29, 896
(2007)
42. J.G. Wang, X.P. Jing, C.H. Yan, J.H. Lin, F.H. Liao, J. Lumin.
121, 57 (2006)
43. M. Yu, J. Lin, Z. Wang, J. Fu, S. Wang, H.J. Zhang, Y.C. Han,
Chem. Mater. 14, 2228 (2002)
Nanoscale Res Lett (2010) 5:1962–1969 1969
123