Báo cáo hóa học: " Research Article The Effect of a Voice Activity Detector on the Speech Enhancement Performance of the Binaural Multichannel Wiener Filter" ppt
Bạn đang xem bản rút gọn của tài liệu. Xem và tải ngay bản đầy đủ của tài liệu tại đây (910.4 KB, 12 trang )
Hindawi Publishing Corporation
EURASIP Journal on Audio, Speech, and Music Processing
Volume 2010, Article ID 840294, 12 pages
doi:10.1155/2010/840294
Research Article
The Effect of a Voice Activity Detector on the Speech Enhancement
Performance of the Binaural Multichannel Wiener Filter
Jasmina Catic,1 Torsten Dau,1 Jă rg M. Buchholz,1 and Fredrik Gran2
o
1
Department of Electrical Engineering, Technical University of Denmark, Oersteds Plads, Building 352,
2800 Kgs. Lyngby, Denmark
2 GN ReSound A/S, Lautrupbjerg 7, 2750 Ballerup, Denmark
Correspondence should be addressed to Jasmina Catic,
Received 28 January 2010; Revised 24 June 2010; Accepted 5 October 2010
Academic Editor: Jont Allen
Copyright © 2010 Jasmina Catic et al. This is an open access article distributed under the Creative Commons Attribution License,
which permits unrestricted use, distribution, and reproduction in any medium, provided the original work is properly cited.
A multimicrophone speech enhancement algorithm for binaural hearing aids that preserves interaural time delays was proposed
recently. The algorithm is based on multichannel Wiener filtering and relies on a voice activity detector (VAD) for estimation of
second-order statistics. Here, the effect of a VAD on the speech enhancement of this algorithm was evaluated using an envelopebased VAD, and the performance was compared to that achieved using an ideal error-free VAD. The performance was considered
for stationary directional noise and nonstationary diffuse noise interferers at input SNRs from −10 to +5 dB. Intelligibilityweighted SNR improvements of about 20 dB and 6 dB were found for the directional and diffuse noise, respectively. No large
degradations (<1 dB) due to the use of envelope-based VAD were found down to an input SNR of 0 dB for the directional noise
and −5 dB for the diffuse noise. At lower input SNRs, the improvement decreased gradually to 15 dB for the directional noise and
3 dB for the diffuse noise.
1. Introduction
An increasing number of people suffer from hearing loss,
a deficit that can limit them in their interaction with the
surrounding world and often severely reduces their quality
of life. The most common type of hearing loss is the
sensorineural, caused by damage to the inner ear (cochlea).
People with sensorineural hearing loss often find it difficult
to understand speech in the presence of background noise,
even when wearing their hearing aids. Consequences of
sensorineural hearing loss vary from one individual to
another, but factors that often contribute are reduced audibility, loudness recruitment, reduced frequency selectivity,
and reduced temporal resolution. Reduced audibility can be
compensated for by a hearing aid through amplification,
and loudness recruitment can to some extent be alleviated
by compression. However, other contributing factors, such
as reduced frequency selectivity or deficits in temporal
processing, cannot fully be compensated for by a hearing
aid. Even if the hearing loss is located in the cochlea and
the higher levels of the auditory system function well, the
impaired ear may not be able to pass on the multitude of
cues otherwise available in the incoming sound. The internal
representation of the signals can then be incomplete and
difficult to analyze. It is well known that the intelligibility
of speech is tightly connected to the signal-to-noise ratio
(SNR) [1]. Thus, the problem of speech intelligibility (SI) in
noise can be approached by reducing the noise level. While
normal-hearing (NH) people can have a speech reception
threshold (SRT; the point where 50% of speech is intelligible)
at SNRs in the range of −5 to −10 dB depending on the
type of noise [2], this threshold is typically 5-6 dB higher
for hearing-impaired (HI) people [3]. At SNRs comparable
to the SRT, a small increase in SNR can improve the
intelligibility scores drastically as a 1 dB increase can lead to
an improvement of up to 15% [4]. This also implies that even
a few dB of elevated SRT in HI listeners can cause substantial
problems understanding speech compared to NH listeners.
Thus, many HI listeners could benefit from a noise reduction
of about 5 dB [3], depending on the acoustical environment.
2
The noise reduction techniques used in hearing aids
employ either a single-microphone or multiple microphones. Single-microphone techniques have been shown not
to improve SI in noise but may improve listening comfort
[5]. On the other hand, multimicrophone techniques can
exploit the spatial diversity of acoustic sources, ensuring
that both temporal and spatial processing can be performed.
Several microphone array processing techniques have been
shown to improve SI in noise [5]. Particularly, adaptive
arrays can in certain conditions reduce impressive amounts
of noise. However, while the array benefit in hearing aid
applications can be very large in the case of a single
noise source in mild reverberation, it reduces considerably
when several interfering sources are present or when the
environment is reverberant [6]. This is due to the use of small
arrays with a limited number of microphones used in hearing
aids, which limits the array performance. Nevertheless, as
small improvements of a few dB might improve intelligibility significantly, a large SNR improvement is not always
necessary.
One potential problem with microphone array processing is that it may affect the hearing aid user’s sense
of the auditory space. Some studies have shown that the
users can localize sounds better when the directionality
in their hearing aid is switched off [7, 8]. Preserving the
interaural localization cues can have a positive effect on
speech intelligibility in complex acoustic environments, as
the binaural processor in the auditory system can exploit
additional information provided by the two ears. Many HI
people are able to take advantage of the low frequency
interaural time delays (ITDs) almost as effectively as NH
people [9]. Thus, a system that combines noise reduction
with preservation of ITDs would be desirable. Such an
algorithm has recently been proposed in [10], as a binaural
extension of a multichannel Wiener filter-based speech
enhancement algorithm proposed in [11]. In [12] it was
shown theoretically that the binaural version preserves the
interaural time delays (ITDs) and interaural level differences
(ILDs) of the speech component. It was also shown that
the ITDs and ILDs of the noise component are distorted in
such a way that they become equal to those of the speech
component. Therefore, in [13], the Binaural Multichannel
Wiener Filter (BMWF) algorithm was extended to preserve
the ITDs of the noise component. A parameter that can pass
a specified amount of noise unprocessed, which is supposed
to restore the binaural cues of the noise, was included into
the calculation of the Wiener filters. Further, it was shown,
using an objective cross-correlation measure, that the ITD
cues of the noise component were preserved. The BMWF
algorithm has also been evaluated perceptually in terms of
lateralization performance [14] and SRT improvements [15].
The conclusion in [14] was that correct localization was
possible with BMWF processing as long as a small amount of
noise was left unprocessed. Regarding the SRT improvements
in [15], it was concluded that the performance was as good
as or better than that achieved with an adaptive directional
microphone (ADM), a standard directional processing often
implemented in hearing aids. The algorithm was developed for arbitrary array geometry with no need for any
EURASIP Journal on Audio, Speech, and Music Processing
assumptions about the sound source location or microphone
positions, and as such it is robust against microphone gain
and phase mismatch, as well as deviations in microphone
positions and variation of speaker position [11]. It only
relies on the second-order statistics of the speech and noise
sources, which allows for an estimation of the desired clean
speech component. The algorithm relies on a voice activity
detection (VAD) mechanism for estimation of the secondorder statistics, that is, the algorithm requires another
algorithm that detects time instants in the noisy speech
signal where the speech is absent. The studies evaluating the
BMWF have used an ideal error-free (perfect) VAD which
is not available in practice. Generally, VAD algorithms only
work well at moderate-to-high SNRs [16]. It is therefore
anticipated that the speech enhancement ability of BMWF in
those conditions would not be degraded by using a practical
VAD instead of a perfect VAD. However, for hearing aid
applications, speech enhancement at low SNRs must be
considered for two reasons: (1) the SNRs often found in
the environment span the range of −10 to 5 dB and should
therefore be included in the evaluation of algorithms for
hearing aids [17] and (2) the SRT point, at which there is
highest potential for improving intelligibility, is often found
at negative SNRs.
In this study, it is investigated to what extent the noise
reduction performance of the BMWF algorithm is affected
by a realistic VAD compared to a perfect VAD. The BMWF
is connected to an envelope-based VAD and the combined
system’s noise reduction performance is assessed for different
types of noise and different spatial configurations of noise
sources. The evaluation is based on objective measures such
as the intelligibility-weighted SNR improvement. The paper
is organized as follows. Section 2 provides an overview of
the Binaural Multichannel Wiener Filter algorithm and the
envelope-based VAD. Sections 3 and 4 describe the evaluation methods and present results with stationary directional
noise and nonstationary diffuse noise. The nonstationary
noise is derived from recordings in a restaurant to approach
a real world situation. Section 5 provides a discussion of
the potential use of this type of noise reduction processing in hearing aids based on the results obtained in this
study.
2. System Model and Algorithms
2.1. System Model. A binaural hearing aid system is considered throughout the present study. There are two microphones on each hearing aid and it is assumed that the aids are
linked, such that all four microphone signals are available to
a noise reduction algorithm. The processor provides a noise
reduced output at each ear.
It is assumed that the signals at each microphone y[k],
at time k, consist of a speech (target) signal, s[k], convolved
with the impulse response, h[k], from speech source to
microphone, and some additive noise. The additive noise
contains both the interfering sound source vn [k], convolved with the room impulse response from the source
to microphone, g[k], and the internal sensor noise vi [k],
EURASIP Journal on Audio, Speech, and Music Processing
yL1 [k] +
vL1 [k]
yR1 [k] +
xR1 [k]
−
The speech plus noise correlation matrix RYY (m), given in
(4), can be calculated directly from the input data vector in
(3)
xL1 [k]
−
Left ear
vR1 [k]
Wleft
Right ear
RYY (k) = RYY (k − 1) + y(k)y(k)T .
Wright
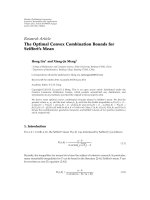
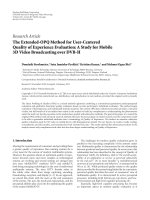
Figure 1: Structure of the BMWF algorithm. Clean speech components are obtained by computing two Wiener filters that estimate
the noise component in the left and right front channels, which are
subtracted from the received noisy signals.
as indicated in (1) for the left and right hearing aid, respectively,
yLm [k] = hLm [k] ⊗ s[k] + gLm [k] ⊗ vn [k] + viLm [k] ,
yRm [k] = hRm [k] ⊗ s[k] + gRm [k] ⊗ vn [k] + viRm [k]
(1)
with m = 1, 2 representing the microphone number index
in the two hearing aids. It is assumed that the noise is
uncorrelated with speech and is a short-term stationary zeromean process.
2.2. Binaural Multichannel Wiener Filter. The BMWF algorithm proposed in [13] provides a Minimum Mean Square
Error (MMSE) estimate of the speech component in the
two front microphones. As depicted in Figure 1, two Wiener
filters are computed to estimate the noise components vL [k]
and vR [k] in the front left and right microphones, which are
then subtracted from the original noisy speech signals yL [k]
and yR [k] to obtain estimates xL [k] and xR [k] of the clean
speech components.
Computation of the left and right Wiener filters requires
spatiotemporal information about the speech and noise
sources in the form of their second-order statistics. Using
the received microphone signals, an approximation of the
second-order statistics can be obtained from a block of input
data of length K. For a filter of length N per channel,
the input data vector yL1 [k] for the left front channel is
given in (2). Accordingly, input data vectors are defined for
the remaining channels. An input data vector y[k] for all
microphone signals is constructed as expressed in (3), which
is used for computing the correlation matrices of speech and
noise
yL1 [k] = yL1 [k] yL1 [k − 1] · · · yL1 [k − N + 1]
T
,
(2)
T
T
y[k] = yL1 [k] yL2 [k]
T
y T1 [k] yR2 [k]
R
T
.
3
(3)
(4)
The noise components are not directly available, as they
cannot be separated from the mixture of speech and noise
in the received microphone signals in (2) and (3). Therefore,
they need to be estimated in periods that only contain noise,
in order to compute the second-order statistics of the noise.
Such an operation requires a voice activity detection (VAD)
mechanism to identify the time instants in the received
mixture signal that do not contain speech. At these time
instants, denoted kn , the noise correlation matrix Rvv (m) is
calculated as expressed in the following:
Rvv (k) = Rvv (k − 1) + y(kn ) yL1 [kn ] yR1 [kn ] .
(5)
As the noise correlation matrix is constructed from q data
samples collected at time instants kn , the correlation matrices
are scaled such that RYY = RYY /K and Rvv = Rvv /q. The left
and right Wiener filters WLR are then calculated as shown in
the following:
WLR = WLeft WRight = RYY −1 Rvv .
(6)
Since the speech signal is estimated in the left and right
microphone channel, the BMWF processing inherently preserves the ITD cues of the speech component. However, ITD
cues of the noise component are distorted [12, 13]. In order
to improve localization, some noise is left unprocessed at
the output, by incorporating a parameter λ into the filter
calculation in (6), as shown in (7):
WLR = WLeft WRight = λRYY −1 Rvv .
(7)
The noise controlling parameter λ can take on values
between 0 and 1, where λ = 1 puts all effort on noise
reduction with no attempt on preservation of localization
cues, and λ = 0 puts all effort on preserving localization cues
and no noise reduction is performed, that is, there is a tradeoff between noise reduction and preservation of localization
cues.
The BMWF algorithm uses no information for computation of the filter matrix other than the second-order
statistics determined by the VAD. It can be expected that the
performance of the BMWF will degrade at some point due to
VAD detection errors, leading to incorrect noise estimation.
If speech is detected as noise, vectors containing speech
samples will be added to the noise data matrix in (5), which
leads to cancellation of parts of the speech signal. On the
other hand, if too many actual noise samples are detected
as speech, less noise vectors are added to the noise data
matrix in (5) and a poorer noise estimate is obtained which
leads to incorrect noise reduction. Generally, a multichannel
Wiener filter can be decomposed into a minimum variance
distortionless response MVDR beamformer followed by a
(spectral) Wiener postfilter [18]. Therefore, it can also be
4
EURASIP Journal on Audio, Speech, and Music Processing
expected that the speech enhancement strongly depends on
the spatial configuration of the noise sources. The adaptive
beamformer is mostly effective at suppressing interference
comprising fewer sources than the number of microphones,
with the noise reduction decreasing fast as the number of
noise sources increases. While the beamformer should not
modify the target signal, the postfilter can attenuate the target
signal, according to the amount of noise present at the output
of the beamformer. Hence, as the Wiener postfilter trades off
target distortion with noise reduction, the amount of target
cancellation is expected to be small in the case of few noise
sources, and high for many sources.
2.3. Voice Activity Detector. Speech has strong amplitude
modulations in the frequency region of 2–10 Hz, such that
its envelope fluctuates over a wide dynamic range. Many
types of noise (e.g., traffic or babble noise where signals
of many speakers are superimposed) exhibit smaller and
more rapid envelope fluctuations compared to speech. These
properties can be exploited for detection of time periods
in a signal where speech is absent. Therefore, an envelopebased VAD developed for hearing aid applications is used,
as proposed in [19]. The algorithm adaptively tracks the
dynamics of a signal’s power envelope and provides speech
pause detection based on the envelope minima in a noisy
speech signal. This VAD has been shown to have a low rate
of speech periods falsely detected as noise even at low-input
SNR of −10 dB [19], which is desirable in order to avoid
deteriorations of the speech signals in the noise reduction
process. Also, in [19], the VAD was compared to the
standardized ITU G.729 VAD by means of receiver operating
characteristic (ROC) curves, and was found to outperform
it for a representative set of noise types and SNRs. The
VAD provides speech/noise classification by analyzing time
frames of 8 ms, using the following processing steps for each
frame:
(1) A 50% overlap is used such that the processing delay
is 4 ms. Each frame is Hanning windowed and a 256point FFT is performed.
(2) Short-term magnitude-squared spectra were calculated. Temporal power envelopes are obtained
by summing up the squared spectral components.
Moreover, a low- and high-band power envelope are
calculated, by summing up the squared spectral components below a cutoff frequency fC and above fC .
The envelopes of band-limited signals are considered
since some noise types have stronger low- (or high-)
frequency components. In that case, one of the bandlimited envelopes may be less disturbed by the noise
and provide more reliable information for speech
pause decision. The envelopes are smoothed slightly
using a first-order recursive low-pass filter with a
release time constant τE .
(3) The maxima and minima of the signal envelope are
obtained by tracking the peaks and valleys of the
envelope waveform. This is done with two first-order
recursive low-pass filters with attack and release time
constants τraise and τdecay . The differences between
the maxima and minima are calculated to obtain the
current dynamic range of the signal.
(4) The decision for a speech pause is based on several
requirements regarding the dynamic range of the
signal and the current envelope values for the three
bands. As the complete decision process is described
in [19], it will not be outlined here, that is, only
the general concepts are provided. The criterion for
the envelope being close enough to its minimum
is determined by the free parameters β and η
and the current dynamic range of the signal. The
threshold parameter η represents the threshold for
determining whether the current dynamic range of
the signal is low, medium or high. The parameter
β can take on values between 0 and 1 and is
used in comparisons of whether a fraction (β)
of the current dynamic range is higher than the
difference between the current envelope and its
minimum. The settings of β and η determine how
strict the requirements for detecting a speech pause
are, and they can be adjusted to make the VAD
more or less sensitive to detecting speech pauses.
By increasing one or both of the parameters, the
algorithm will detect more speech pauses, but at the
same time, it will also detect more speech periods as
noise.
3. Evaluation Setup
The speech enhancement performance of the system was
evaluated for SNRs in the range from −10 to +5 dB, as
this range is most important for hearing aid applications
(see Section 1). Since the performance of microphone arrays
strongly depends on the spatial characteristics of the interfering noise, the system was evaluated both in conditions of
directional and diffuse noise. Further, two noise types were
considered: a stationary noise with low modulation index
and a nonstationary noise with strong envelope fluctuations.
3.1. Performance Measures. The noise reduction performance was evaluated using the intelligibility-weighted SNR
improvement, SNRINT , defined in [20]. This is a measure
of noise reduction that incorporates basic factors related to
speech intelligibility in noise. The signals were split into i
third octave bands where the SNR (in dB) was calculated
for each band i, as shown in (8) for the input and output
of the noise reduction algorithm, respectively. Here, P( f )
represents power spectral density, with the subscripts S and
N denoting the speech and noise components, respectively.
As different frequency bands do not contribute equally to the
intelligibility of speech, each band with center frequency fic
was weighted with a weight Ii according to its importance
for speech intelligibility. The center frequencies and weights
are defined in ANSI 1997 [21]. The weighting function
has roughly a bandpass characteristic, with a passband of
1–3 kHz. Since the improvement in SNR after processing
is of interest, ΔSNRINT was calculated as expressed in (9),
EURASIP Journal on Audio, Speech, and Music Processing
5
0.5
where the input SNR was subtracted from the output SNR
the following:
⎜
SNRi,in = 10 log10 ⎝
⎛
⎜
SNRi, out = 10 log10 ⎝
ΔSNRINT =
c
21/6 fi
c P
S,in
−21/6 fi
1/6 fic
2
c P
N,in
−21/6 fi
0.3
f df ⎟
⎠,
f df
0.2
⎞
c
21/6 fi
c
−21/6 fi
c
21/6 fi
c
−21/6 fi
0.4
⎞
(8)
P S,out f df ⎟
⎠,
P N,out f df
Amplitude
⎛
0.1
0
−0.1
−0.2
−0.3
Ii SNRi,out − SNRi,in .
i
(9)
−0.4
−0.5
Several studies on microphone arrays for hearing aids have
found good agreement between the weighted SNR improvement and changes in SRTs for normal-hearing individuals
[22, 23]. In [24], a close agreement between the AI weighted
directivity index (AI-DI) (in the case of diffuse noise and
frontal incidence of target, the ΔSNRINT approaches the AIDI) and SRTs for hearing-impaired listeners was reported.
Although it can be expected that an improvement in SNR
in the frequency regions important for speech intelligibility
should improve speech recognition, this measure is not
considered as a substitute for speech intelligibility tests with
hearing-impaired listeners.
Cancellation of speech can occur when the VAD erroneously detects speech periods as noise periods, due to
speech samples being added to the noise data correlation
matrix in (5). Speech cancellation can also occur due to the
BMWF algorithm processing. This effect may not always be
reflected in the SNR improvement, since the noise can be
reduced accordingly. The speech cancellation (SCINT ) was
therefore calculated as the ratio of the speech signal output
power to speech signal input power, frequency weighted and
averaged in dB, similar to the intelligibility-weighted SNR
calculation described above
⎛
⎜
SCi = 10 log10 ⎝
⎞
c
21/6 fi
c
−21/6 fi
1/6 fic
2
c
−21/6 fi
SCINT =
P S,out f df ⎟
⎠,
P S,in f df
(10)
Ii SCi .
i
3.2. Reference System. In order to quantify the degradation
of the BMWF system performance due to the integration
of a realistic VAD mechanism in the noise estimation
method, it was necessary to have a reference VAD that
performs “perfectly.” Ideally, a VAD should detect all the
noise samples without cutting parts of speech. The reference
VAD sequence was derived by running the implemented
envelope-based VAD algorithm on the speech material used
for target speech, mixed with a very low-level noise signal
(speech-weighted noise at −35 dB SNR) to ensure correct
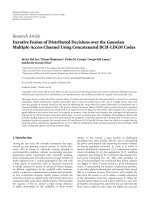
speech/noise classification, as shown in Figure 2. This VAD
sequence was used as the reference VAD here and is from
now on referred to as “perfect” VAD, while the VAD running
on the actual signals is referred to as envelope-based VAD.
The noise reduction obtained with BMWF using the perfect
0
1
2
3
4
t (s)
5
6
7
8
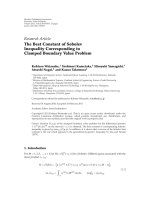
Figure 2: Target speech waveform accompanied by the binary
sequence representing the perfect VAD. The selected speech pauses
are indicated by zeros in the binary sequence.
VAD can be regarded as the optimum for the considered
acoustic scenarios.
3.3. Experimental Setup. The measurements of speech and
noise were carried out in an acoustically highly damped
room. The speech and noise sources were recorded separately
on behind the ear (BTE) hearing aids with omnidirectional
microphones, mounted on a dummy head which was placed
in the center of the room. The speech waveform is shown
in Figure 2. The 8 seconds long speech segment is a male
speaker on BBC news, where an additional speech pause
was added to the waveform in the intervals from 3.5 to 4
seconds and 7.5 to 8 seconds. This was done since there are
very few natural speech pauses in the newsreader speech,
and because the BMWF relies on presence of speech pauses
for noise estimation. It is assumed that, in a more natural
conversation, several speech pauses would be present in the
waveform. The speech was played through a loudspeaker
located at 0◦ azimuth relative to the dummy head. The
stationary noise used was speech-shaped noise, which is a
steady noise with the same long-term average spectrum as
(typical) speech. The noise was recorded at the House Ear
Institute in Los Angeles. In order to generate directional
noise, this recording was played through a loudspeaker
positioned at an azimuth of 90◦ relative to the dummy
head. The nonstationary noise used was diffuse multitalker
babble noise. Further recording were made in a restaurant
at 8 different locations. These recordings were played from
8 different loudspeakers located in the corners of the room.
This artificial diffuse sound field is assumed to mimic a
“cocktail party” situation, and was chosen to assess the
performance of BMWF combined with envelope-based VAD
in a realistic and challenging acoustical environment.
The sampling frequency was 24.414 Hz and the BMWF
filter length per channel was 64. The filters in (7) were
calculated using the whole signal. The output speech and
noise signals were generated by filtering the clean speech and
6
EURASIP Journal on Audio, Speech, and Music Processing
Table 1: List of parameters used in VAD implementation.
VAD parameter
Frame length T
No of FFT points N0
Sampling frequency fS
Cutoff frequency fC
Smoothing time constant τE
Minima tracking time constant τdecay
Maxima tracking time constant τraise
Threshold parameter η
Threshold parameter β
Setting
8 ms
256
24.414 kHz
2 kHz
32 ms
3s
3s
5 dB
0.1, 0.2, and 0.3
noise signals separately with the obtained filter coefficients.
The input SNRs were calculated using the VAD sequence
shown in Figure 2 in order to exclude the noise-only samples
indicated by zeros from the calculation.
In order to investigate the combined systems’ noise
reduction performance, including the effect of the noise
controlling parameter λ that trades off noise reduction with
preservation of ITDs, two different settings of λ were used:
λ = 1, corresponding to full effort on noise reduction,
and λ = 0.8, corresponding to adding a small amount of
unprocessed noise to the output. These values were chosen
since it was found in [14] that by passing a small amount
of unprocessed noise (λ = 0.8), the localization can be
preserved also for the noise component, while λ = 1 distorts
the localization of the noise component but provides more
noise reduction. The λ parameter was kept fixed in all
situations, that is, it was assumed that the hearing aid user
does not adjust this according to the acoustical situation.
The algorithmic parameters for the VAD used in the current
implementation were determined empirically in [19] based
on tests employing several noise types, speech signals, and
input SNRs. However, since these parameters were adjusted
to yield a low false alarm rate (which consequently results in
a low hit rate), two additional values of β were considered
here, as an increase in β yields a larger speech pause hit rate.
This also allowed the investigation of different combinations
of speech and noise classification errors. The complete list of
VAD parameters is shown in Table 1.
4. Results
4.1. Speech and Noise Classification. In this section, the
speech and noise classification performance of the envelopebased VAD for the three settings of β is presented. The
percentages of correctly detected samples were calculated
for the scenarios described in the experimental setup in
Section 3. Hence, the noise reduction and speech cancelation
obtained for each scenario in Sections 4.2 and 4.3 can directly
be related to this particular classification performance. The
correct scores were calculated with respect to the perfect VAD
sequence from Figure 2 (Section 3). Note that the length of
the entire signal was 8 seconds of which about 2 seconds were
noise and so the amount of speech and noise is not equal.
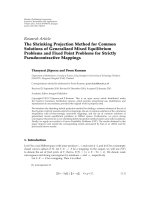
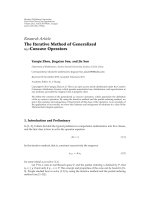
In Figure 3 the percentages of correct scores are shown
for the diffuse multitalker babble noise for β = 0.1 (solid
curve), β = 0.2 (dashed curve) and β = 0.3 (dotted curve).
The left and right panels show the correct scores for the
speech and noise periods, respectively. For β = 0.1, the
amount of correctly detected speech samples is at least 95%
at all input SNRs. However, only about 15–20% of the actual
noise samples are detected as noise. This is partly due to the
way the VAD tracks the minima in the envelope, and due to
the threshold settings used to obtain a speech pause decision.
The multitalker babble noise fluctuates strongly, such that its
envelope is rarely as close to its minimum as is required in the
algorithm for a speech pause decision. Increasing β improves
the classification of noise, which is mostly pronounced at
higher SNR, but this comes at the expense of more speech
being classified as noise. It should be noted, that some of
these errors occur at time instants when the speech signal is
weak, and hence may not always be detrimental.
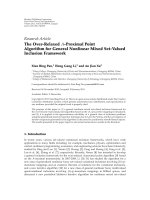
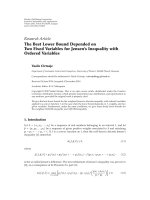
In Figure 4 the percentages of correct scores are shown
for the directional speech-shaped noise for β = 0.1 (solid
curve), β = 0.2 (dashed curve) and β = 0.3 (dotted curve).
The left and right panels show the correct scores for speech
and noise period, respectively. For β = 0.1, the amount of
correctly detected speech samples is at least 85% at all SNRs.
Compared to the multitalker babble noise, the speech-shaped
noise exhibits smaller fluctuations of the envelope. Thus
the VAD demonstrates significantly better detection of the
actual noise frames, but also a higher amount of incorrectly
classified speech. Increasing β from 0.1 to 0.2 improves the
overall noise classification, with correct scores on the order
of 98% down to an input SNR of 0 dB. Below this point,
the amount decreases gradually to 64%. Further increase of
β to 0.3 only slightly improves the noise classification, but
each increase in β results in an increased error in speech
classification.
4.2. Stationary Directional Noise. Figure 5 shows the intelligibility-weighted SNR improvement ΔSNRINT for stationary
directional noise when the perfect VAD is used for the noise
estimation (solid curve), and when the envelope-based VAD
is used with β = 0.1 (dashed curve), β = 0.2 (dotted
curve), and β = 0.3 (solid curve with cross markers). The
left panel and right panel show the results for λ = 1 and
λ = 0.8, respectively. For β = 0.2 and β = 0.3, the noise
reduction performance does not degrade due to VAD down
to an input SNR of 0 dB, where an improvement of about
20 dB SNR is obtained. This can be related to the speech and
noise classification shown in Figure 4, as a high amount of
noise is correctly detected for the two β settings down to an
input SNR of 0 dB. In this condition, the setting β = 0.1
yields less improvement, which is also consistent with the
15–30% lower detection rate for noise observed in Figure 4.
In this context, the increased misclassification of speech due
to increasing β does not have a negative impact on noise
reduction performance. Below an input SNR of 0 dB, the
noise suppression gradually decreases for all β settings, and
eventually amounts to roughly 15 dB at an input SNR of
−10 dB.
EURASIP Journal on Audio, Speech, and Music Processing
7
90
Correctly detected samples (%)
100
90
Correctly detected samples (%)
100
80
70
60
50
40
30
20
80
70
60
50
40
30
20
10
10
0
−10
−5
0
0
−10
5
−5
Input SNR (dB)
0
5
Input SNR (dB)
β = 0.1
β = 0.2
β = 0.3
β = 0.1
β = 0.2
β = 0.3
(a)
(b)
Figure 3: Percentage of correctly detected samples for diffuse multitalker babble noise as interferer, at different SNR and for β = 0.1, 0.2 and
0.3. (a) Speech period, (b) noise period.
90
Correctly detected samples (%)
100
90
Correctly detected samples (%)
100
80
70
60
50
40
30
20
10
80
70
60
50
40
30
20
10
0
−10
−5
0
5
0
−10
−5
Input SNR (dB)
β = 0.1
β = 0.2
β = 0.3
0
5
Input SNR (dB)
β = 0.1
β = 0.2
β = 0.3
(a)
(b)
Figure 4: Percentage of correctly detected samples for directional speech-shaped noise as interferer, at different SNR and for β = 0.1, 0.2
and 0.3. (a) Speech period, (b) noise period.
The right panel of Figure 5 shows that reducing λ from 1
to 0.8 (to preserve ITD cues of the noise component) leads
to SNR improvement of about 13 dB for all considered SNR
conditions when utilizing perfect VAD. This is substantially
less than the 20 dB obtained with the λ = 1 setting. However
the degradation of noise reduction performance due to
employing envelope-based VAD is smaller when the noise
estimate is scaled, such that an average gain of 10 dB is found.
Figure 6 shows the intelligibility-weighted speech cancellation SCINT for the same conditions as for the ΔSNRINT
in Figure 5. (note that a smaller number indicates higher
target cancelation) The SCINT ranges from 0.2 to 1 dB when
EURASIP Journal on Audio, Speech, and Music Processing
25
Intelligibility weighted SNR improvement (dB)
Intelligibility weighted SNR improvement (dB)
8
20
15
10
5
0
−10
−5
0
25
20
15
10
5
0
−10
5
Input SNR (dB)
Perfect VAD
Envelope VAD β = 0.1
−5
0
5
Input SNR (dB)
Envelope VAD β = 0.2
Envelope VAD β = 0.3
Perfect VAD
Envelope VAD β = 0.1
(a)
Envelope VAD β = 0.2
Envelope VAD β = 0.3
(b)
0
Intelligibility weighted speech cancellation (dB)
Intelligibility weighted speech cancellation (dB)
Figure 5: Intelligibility weighted SNR improvement for directional speech-shaped noise at different SNRs for perfect VAD and envelopebased VAD with β = 0.1, 0.2 and 0.3. (a) λ = 1 and (b) λ = 0.8.
−1
−2
−3
−4
−5
−6
−7
−8
−9
−10
−10
−5
0
5
Input SNR (dB)
Perfect VAD
Envelope VAD β = 0.1
Envelope VAD β = 0.2
Envelope VAD β = 0.3
(a)
0
−1
−2
−3
−4
−5
−6
−7
−8
−9
−10
−10
−5
0
5
Input SNR (dB)
Perfect VAD
Envelope VAD β = 0.1
Envelope VAD β = 0.2
Envelope VAD β = 0.3
(b)
Figure 6: Intelligibility weighted speech cancelation for directional speech-shaped noise at different SNRs for perfect VAD and envelopebased VAD with β = 0.1, 0.2 and 0.3. (a) λ = 1 and (b) λ = 0.8.
the perfect VAD is employed. When envelope-based VAD is
employed, the SCINT increases, with higher β resulting in
increased cancellation, as more speech is classified as noise.
This increase is modest at higher input SNR but becomes
progressively greater at lower SNR.
Results in the right panel of Figure 6 show that setting
λ = 0.8 reduces the amount of target cancellation by up to
1.5 dB.
4.3. Diffuse and Fluctuating Noise. Figure 7 shows the intelligibility-weighted SNR improvement for a diffuse multitalker
babble scenario with the same conditions as for stationary
noise (Section 4.2). The noise suppression is around 6 dB
with a slight decline below-input SNR of −5 dB when the
perfect VAD is employed. Using the envelope-based VAD
does not result in large degradations (<1 dB) down to an
input SNR of −5 dB, at least for the β = 0.3 setting (this β
value yields the highest noise reduction). Below −5 dB, the
noise reduction degrades gradually to about 3 dB at −10 dB.
The detection rates for noise displayed in Figure 3 show
that, as the input SNR decreases, the VAD classifies a
higher amount of noise as speech. But this is not the only
reason for reduced performance. Figure 3 shows that the
VAD detection rates are quite similar at and below −5 dB
9
7
Intelligibility weighted SNR improvement (dB)
Intelligibility weighted SNR improvement (dB)
EURASIP Journal on Audio, Speech, and Music Processing
6
5
4
3
2
1
0
−10
7
6
5
4
3
2
1
0
−5
0
−10
5
Perfect VAD
Envelope VAD β = 0.1
−5
0
5
Input SNR (dB)
Input SNR (dB)
Envelope VAD β = 0.2
Envelope VAD β = 0.3
Perfect VAD
Envelope VAD β = 0.1
(a)
Envelope VAD β = 0.2
Envelope VAD β = 0.3
(b)
0
Intelligibility weighted speech cancellation (dB)
Intelligibility weighted speech cancellation (dB)
Figure 7: Intelligibility weighted SNR improvement for diffuse multitalker babble noise at different SNRs for perfect VAD and envelopebased VAD with β = 0.1, 0.2 and 0.3. (a) λ = 1 and (b) λ = 0.8.
−1
−2
−3
−4
−5
−6
−7
−8
−9
−10
−11
−10
−5
0
Input SNR (dB)
Perfect VAD
Envelope VAD β = 0.1
Envelope VAD β = 0.2
Envelope VAD β = 0.3
(a)
5
0
−1
−2
−3
−4
−5
−6
−7
−8
−9
−10
−11
−10
−5
0
5
Input SNR (dB)
Perfect VAD
Envelope VAD β = 0.1
Envelope VAD β = 0.2
Envelope VAD β = 0.3
(b)
Figure 8: Intelligibility weighted speech cancellation for diffuse multitalker babble noise at different SNRs for perfect VAD and envelopebased VAD with β = 0.1, 0.2 and 0.3. (a) λ = 1 and (b) λ = 0.8.
input SNR, yet the SNR improvement decreases. The noise
reduction performance does not only depend on the VAD
error rates, but also on the quality of the noise estimate
and this is especially pronounced at very low SNRs in
nonstationary noise. The noncontinuous collection of noise
data introduces inaccuracies in the noise correlation matrix
since it is estimated only in limited periods of time in the
entire signal waveform. Thus, the filter coefficients differ
from those that could have been obtained if the speech
and noise correlation matrices were estimated at the same
time. While the improvement for directional speech-shaped
noise in Figure 5 actually increases with decreasing SNR
when employing a perfect VAD, this is not the case for
diffuse babble noise (Figure 7), where a 1 dB decrease is seen.
Therefore, frequent sampling of the fluctuating noise is even
more important at lower SNRs.
10
The right panel of Figure 7 shows that a setting λ = 0.8
in diffuse noise results only in a very small decrease in SNR
improvement (on average 1 dB).
The target cancelation for the multitalker babble interferer is shown in Figure 8. Most of the target cancellation
occurs due to the BMWF processing, which ranges from
1.5 to 7 dB depending on the input SNR. Since the noise is
diffuse, the data-dependent spatial filter is not as effective
as in the case of a few noise sources, and consequently
the spectrum-dependent postfilter attenuates the signal in
the effort to reduce the considerable amount of residual
noise at the output of the spatial filter. The additional target
cancelation due to VAD errors is around 3 dB at most and
in some cases the SCINT is actually lower than that obtained
with the perfect VAD. Thus the amount of cancellation for
diffuse babble noise due to VAD errors is limited. The right
panel of Figure 8 shows that scaling the noise estimate by
setting λ = 0.8 reduces the target cancelation by up to 2.5 dB.
5. Discussion
The noise reduction results showed that for stationary
directional noise an average SNR improvement of 20 dB (see
left panel of Figure 5) can be achieved when using perfect
VAD for noise estimation in the BMWF system. The effect
of incorporating a realistic VAD for this scenario is minimal
(<1 dB) as long as the input SNR is at or above 0 dB.
Although noise reduction performance deteriorated with
decreasing SNR, a robust gain of about 15 dB is still obtained
at −10 dB input SNR. When trading off some noise reduction
in order to preserve ITD cues of the noise component (i.e.,
setting λ = 0.8, shown in right panel of Figure 5), an
adequate improvement in SNR of 10 dB on average can
still be obtained. This means that in such a situation, the
user could, in addition to the benefit from auditory release
from masking (that also improves speech intelligibility), also
benefit from the microphone array processing. While an
adequate amount of noise reduction can be obtained for the
case of stationary directional interferer, the noise recorded in
a restaurant is a more realistic condition that often would be
encountered by hearing aid users. In this scenario, a limited
amount of noise reduction of about 6 dB was obtained by the
BMWF system in the optimal case (i.e., with perfect VAD),
as can be seen in Figure 7. Furthermore, the setting λ = 0.8
reduced the SNR improvement by 1 dB. It could be argued
that this reduction is not necessary since in a diffuse noise
environment no directional localization cues for the noise
are available. In the present study, it was assumed that the
hearing aid user does not adjust the λ setting according to the
acoustical environment, but in principle it should be possible
that this adjustment is made in the hearing aid according
to the acoustical environment with the sound classifiers
installed in modern hearing aids.
When using the envelope-based VAD, the performance
is not degraded by more than 1 dB down to an input
SNR of about −5 dB compared to the optimal case. At this
point (for β = 0.3), the correct classification of speech
was about 78% and the correct classification of noise was
EURASIP Journal on Audio, Speech, and Music Processing
about 50% (see Figure 3). Thus, it is not necessary for the
BMWF system that the VAD shows satisfactory performance
(i.e., a low error rate), but rather that the error rate is
not excessive (e.g., higher than 50%), and therefore only
small effects of VAD are observed in relatively adverse
conditions. It should be noted, that even a small weighted
SNR improvement of 3–6 dB found for diffuse babble noise
can lead to a crucial speech recognition increase, if the
improvement is found at SNRs comparable to the SRT. In
[25], for example, sentence intelligibility in different types
of noise for hearing-impaired listeners was investigated. The
average SRTs for speech-shaped noise and fluctuating noise
were −3.3 dB and −2.1 dB, respectively, with improvements
in speech recognition of 16 and 11 percent for each 1 dB
increase in SNR. This means that for a typical hearingimpaired individual the SNR range of understanding almost
nothing to understanding almost everything is −7 to 3 dB for
sentences in fluctuating noise. In much of this SNR range
(down to −5 dB), the BMWF performance does not degrade
much due to VAD errors and an SNR improvement of 5-6 dB
is found. Hence, the BMWF with envelope-based VAD might
provide a significant improvement in speech recognition of
more than 50%.
In very adverse conditions, for example, at −10 dB SNR,
which may also be encountered in the environment, the SNR
improvement reduced to about 3 dB when using envelopebased VAD for noise estimation, which is comparable to
that of a directional microphone. A first-order directional
microphone, consisting of two closely spaced microphones
has an AI weighted directivity index as measured on KEMAR
(which is equivalent to our measure of weighted SNR
improvement in diffuse noise) of around 3 dB, for example,
[5, 26]. It should be kept in mind that the results regarding
reduction in SNR improvement relative to that obtained
when employing perfect VAD are limited to the specific VAD
used here. The effect of other types of VAD algorithms may
be different. In addition to the degraded performance in very
adverse conditions, an obvious problem for this system arises
if the interference is a single speaker or only a few speakers.
In such situations, the temporal fluctuations of the noise
interferer are very similar to the target fluctuations and thus,
the VAD cannot discriminate between both. In consequence,
no significant suppression of the interferers can be achieved.
The purpose of this work was primarily to investigate
the effect of a realistic VAD on BMWF, more specifically,
to identify the range of SNRs where the VAD has minimal
effect on noise reduction performance compared to the case
when VAD errors are not taken into account, and to quantify
the degradation in performance for the conditions where
the VAD has significant influence. The following aspects can
be subject to further research. The analysis presented has
employed block processing where the statistics of speech and
noise were calculated using the entire signal of 8 seconds
of which about 2 seconds were noise. It is likely that head
movement and movement of noise sources will degrade
algorithm performance. In this context, the performance
of the algorithm will not only be influenced by the type
of adaptation used, but by the filters only being updated
during speech pauses. Obviously, this impedes tracking of
EURASIP Journal on Audio, Speech, and Music Processing
fast movement, as the filters can be frozen for seconds to the
previous scenario. Also, VAD classification errors can lead
to slower convergence of the filters. Due to the directional
properties of the BMWF, this degradation is more likely to be
significant in a simple (directional) noise source setup than
if the noise scenario is complex that is, spatially diffuse.
Although it can be expected that an SNR improvement in
frequency regions important for speech recognition would
result in higher speech recognition, the gains obtained
in intelligibility-weighted SNR can only be related to the
potential of this system to improve intelligibility. This is
particularly critical when individual hearing impairments
(e.g., limitation in audibility, spectral resolution, or temporal fine structure processing) are considered. The effect
of hearing impairment on speech intelligibility might be
addressed by using modifications to the speech-weighted
SNR measure such as those proposed in, for example, [27]
for the Articulation Index. However, in order to demonstrate
the true benefit of the BMWF system in complex scenarios,
speech intelligibility tests with hearing aid users need to be
conducted. Also, the quality of the processed speech could be
addressed.
References
[1] B. C. J. Moore, “Speech processing for the hearing-impaired:
successes, failures, and implications for speech mechanisms,”
Speech Communication, vol. 41, no. 1, pp. 81–91, 2003.
[2] J. M. Festen and R. Plomp, “Effects of fluctuating noise
and interfering speech on the speech-reception threshold for
impaired and normal hearing,” Journal of the Acoustical Society
of America, vol. 88, no. 4, pp. 1725–1736, 1990.
[3] R. Plomp, “Auditory handicap of hearing impairment and the
limited benefit of hearing aids,” Journal of the Acoustical Society
of America, vol. 63, no. 2, pp. 533–549, 1978.
[4] M. Nilsson, S. D. Soli, and J. A. Sullivan, “Development of the
hearing in noise test for the measurement of speech reception
thresholds in quiet and in noise,” Journal of the Acoustical
Society of America, vol. 95, no. 2, pp. 1085–1099, 1994.
[5] J. M. Kates, Digital Hearing Aids, Plural Publishing, San Diego,
Calif, USA, 2008.
[6] J. Bitzer, K. U. Simmer, and K. Kammeyer, “Theoretical
noise reduction limits of the generalized sidelobe canceller
(GSC) for speech enhancement,” in Proceedings of the IEEE
International Conference on Acoustics, Speech, and Signal
Processing (ICASSP ’99), pp. 2965–2968, March 1999.
[7] T. Van Den Bogaert, T. J. Klasen, M. Moonen, L. Van Deun,
and J. Wouters, “Horizontal localization with bilateral hearing
aids: without is better than with,” Journal of the Acoustical
Society of America, vol. 119, no. 1, pp. 515–526, 2006.
[8] T. J. Klasen, K. Rohrseitz, G. Keidsler, et al., “The effect
of multi-channel wide dynamic range compression, noise
reduction, and the directional microphone on horizontal
localization performance in hearing aid wearers,” International
Journal of Audiology, vol. 45, pp. 563–579, 2006.
[9] A. W. Bronkhorst and R. Plomp, “Binaural speech intelligibility in noise for hearing-impaired listeners,” Journal of the
Acoustical Society of America, vol. 86, no. 4, pp. 1374–1383,
1989.
[10] T. J. Klasen, M. Moonen, T. Van Den Bogaert, and J. Wouters,
“Preservation of interaural time delay for binaural hearing
11
aids through multi-channel Wiener filtering based noise
reduction,” in Proceedings of the IEEE International Conference
on Acoustics, Speech and Signal Processing (ICASSP ’05), vol. 3,
pp. 29–32, 2005.
[11] S. Doclo and M. Moonen, “GSVD-based optimal filtering
for single and multimicrophone speech enhancement,” IEEE
Transactions on Signal Processing, vol. 50, no. 9, pp. 2230–2244,
2002.
[12] B. Cornelis, S. Doclo, T. Van den Bogaert, J. Wouters, and M.
Moonen, “Theoretical analysis of binaural multi-microphone
noise reduction techinques,” IEEE Transactions on Audio,
Speech and Language Processing, vol. 18, no. 2, pp. 342–355,
2010.
[13] T. J. Klasen, T. Van den Bogaert, M. Moonen, and J. Wouters,
“Binaural noise reduction algorithms for hearing aids that
preserve interaural time delay cues,” IEEE Transactions on
Signal Processing, vol. 55, no. 4, pp. 1579–1585, 2007.
[14] T. Van Den Bogaert, S. Doclo, J. Wouters, and M. Moonen,
“The effect of multimicrophone noise reduction systems on
sound source localization by users of binaural hearing aids,”
Journal of the Acoustical Society of America, vol. 124, no. 1, pp.
484–497, 2008.
[15] T. Van Den Bogaert, S. Doclo, J. Wouters, and M. Moonen,
“Speech enhancement with multichannel Wiener filter techniques in multimicrophone binaural hearing aids,” Journal of
the Acoustical Society of America, vol. 125, no. 1, pp. 360–371,
2009.
[16] P. Vary and R. Martin, Digital Speech Transmission—Enhancement, Coding and Error Concealment: Chapter 11, John Wiley
& Sons, New York, NY, USA, 2006.
[17] T. A. Ricketts, “Directional hearing aids: then and now,”
Journal of Rehabilitation Research and Development, vol. 42,
no. 4, supplement 2, pp. 133–144, 2005.
[18] M. Brandstein and D. Ward, Microphone Arrays—Signal
Processing Techniques and Applications: Chapter 3, Springer,
New York, NY, USA, 2001.
[19] M. Marzinzik and B. Kollmeier, “Speech pause detection
for noise spectrum estimation by tracking power envelope
dynamics,” IEEE Transactions on Speech and Audio Processing,
vol. 10, no. 2, pp. 109–118, 2002.
[20] J. E. Greenberg, P. M. Peterson, and P. M. Zurek,
“Intelligibility-weighted measures of speech-to-interference
ratio and speech system performance,” Journal of the Acoustical
Society of America, vol. 94, no. 5, pp. 3009–3010, 1993.
[21] ANSI S3.5-1997, “American National Standard Methods for
Calculation of the Speech Intelligibility Index,” The Acoustical
Society of America, 1997.
[22] P. M. Peterson, S.-M. Wei, W. M. Rabinowitz, and P. M. Zurek,
“Robustness of an adaptive beamforming method for hearing
aids,” Acta Oto-Laryngologica, no. 469, supplement, pp. 85–90,
1990.
[23] M. W. Hoffman, T. D. Trine, K. M. Buckley, and D. J. Van
Tasell, “Robust adaptive microphone array processing for
hearing aids: realistic speech enhancement,” Journal of the
Acoustical Society of America, vol. 96, no. 2, pp. 759–770, 1994.
[24] S. Laugesen and T. Schmidtke, “Improving on the speechin-noise problem with wireless array technology,” News from
Oticon, pp. 3–23, 2004.
12
[25] K. C. Wagener and T. Brand, “Sentence Intelligibility in noise
for listeners with normal hearing and hearing impairment:
influence of measurement procedures and masking parameters,” International Journal of Audiology, vol. 44, no. 3, pp. 144–
156, 2005.
[26] V. Harnacher, J. Chalupper, J. Eggers, E. Fischer, U. Kornagel,
H. Puder, and U. Rass, “Signal processing in high-end hearing
aids: state of the art, challenges, and future trends,” Eurasip
Journal on Applied Signal Processing, vol. 2005, no. 18, pp.
2915–2929, 2005.
[27] C. V. Pavlovic, G. A. Studebaker, and R. L. Sherbecoe, “An
articulation index based procedure for predicting the speech
recognition performance of hearing-impaired individuals,”
Journal of the Acoustical Society of America, vol. 80, no. 1, pp.
50–57, 1986.
EURASIP Journal on Audio, Speech, and Music Processing