Báo cáo hóa học: " Research Article Optimizing the Directivity of Multiway Loudspeaker Systems" ppt
Bạn đang xem bản rút gọn của tài liệu. Xem và tải ngay bản đầy đủ của tài liệu tại đây (1.71 MB, 11 trang )
Hindawi Publishing Corporation
EURASIP Journal on Audio, Speech, and Music Processing
Volume 2010, Article ID 928439, 11 pages
doi:10.1155/2010/928439
Research Article
Optimizing the Directivity of Multiway Loudspeaker Systems
Hmaied Shaiek (EURASIP Member)
1
and Jean Marc Boucher
2
1
´
Ecole Nationale d’Ing
´
enieurs de Brest, Universit
´
eEurop
´
eenne de Bretagne (UEB), Laboratoire Brestois de M
´
ecanique et des Syst
`
emes
(LBMS), EA 4325, Technop
ˆ
ole Brest-Iroise, CS 73862, 29238 Brest Cedex 3, France
2
TELECOM Bretagne, Institut TELECOM, Universit
´
eEurop
´
eenne de Bretagne (UEB), CNRS UMR 3192 Lab-STICC, CS 83818,
29238 Brest Cedex 3, France
Correspondence should be addressed to Hmaied Shaiek, shaiek
Received 26 March 2010; Revised 8 July 2010; Accepted 19 August 2010
Academic Editor: Woon Seng Gan
Copyright © 2010 H. Shaiek and J. M. Boucher. This is an open access article distributed under the Creative Commons Attribution
License, which permits unrestricted use, distribution, and reproduction in any medium, provided the original work is properly
cited.
In multiway loudspeaker systems, digital signal processing techniques have been used to correct the frequency response, the
propagation time, and the lobbing errors. These solutions are mainly based on correcting the delays between the signals coming
from loudspeaker system transducers, and they still show limited performances over the overlap frequency bands. In this paper, we
propose an enhanced optimization of relevant directivity characteristics of a multiway loudspeaker system such as the frequency
response, the radiation pattern, and the directivity index over an extended transducers’ frequency overlap bands. The optimization
process is based on applying complex weights to the crossover filter transfer functions by using an iterative approach.
1. Introduction
As full-range transducer designed to have the widest fre-
quency band with a good overall performance is hard to
achieve, most high-quality loudspeaker systems are of the
multiway type. Therefore, two or more drive units must
be used, each one of them being designed for a limited
frequency range. In such acoustic source, we must avoid band
aliasing and prevent each transducer from being fed with
signals outside its frequency band. Thus, a suitable filter bank
must be employed to split the input signal into different
bands. This network is known as loudspeaker crossover
[1–3].
When transducers have a separate geometrical distri-
bution, the crossover design is generally done for a par-
ticular on-axis listening point, by including extra delays
to correct the differences between the propagation time of
the sound waves coming from all the transducers [1, 4].
Alternatively, the D’Appolito geometrical dist ribution [5]
or the psychoacoustic error cancelation [6]couldbeused
to reach this target over a wider listening area. With such
solution, some amplitude, phase and directivity deviations
still remain around the crossover frequencies when the
listener moves away from the central listening point. In [7],
it was shown that the best solution to control the directivite
behavior of a multiway loudspeaker system is to mount
its transducers around the same axis and use a coaxial
configuration.
For a high-end loudspeaker system, the fluctuation of the
directivity characteristics are sometimes unacceptable [8, 9].
These parameters are func tion of the crossover filter transfer
functions especially over the transducers’ overlap bands. In
this paper, we will introduce a dedicated signal processing
technique based on a complex weighting of the crossover
filter responses in order to optimize relevant directivity
parameters.
This paper is organized in two main sections. The first
one introduces the technique that we propose to enhance
the control of relevant directivity parameters for a multi-
way loudspeaker system. This control is achieved through
a complex weighting of the crossover filter frequency
responses over the transducers’ overlap bands. In the second
section of this paper, we will discuss the results of an applica-
tion example, based on measurements done with a Cabas-
se ( two-way coaxial loudspeaker
system.
2 EURASIP Journal on Audio, Speech, and Music Processing
Loudspeaker systemAmplifiersCrossover filters
Input
z
θ
x
y
M(θ, φ)
φ
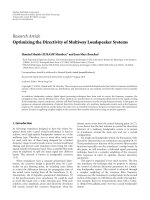
Figure 1: Multiway active loudspeaker system.
2. Proposed Algorithm
2.1. Notations. For a multiway loudspeaker system, such as
that one shown in Figure 1, we introduce the following
notations:
(i) h
k
(θ, φ, f ): transfer function of the kth transducer
measured at a listening point M(θ, φ), one meter
away from the top transducer (generally reproducing
the high frequencies: tweeter);
(ii) b
k
( f ): transfer function of the crossover filter applied
to the kth transducer.
Let A(θ, φ, f )andW(f ) be the K
× 1vectorsgivenby
A
θ, φ, f
=
h
1
θ, φ, f
b
1
f
, , h
K
θ, φ, f
b
K
f
T
,
W
f
=
w
1
f
, , w
K
f
T
,
(1)
where A(θ, φ, f ) is the ve ctor containing the filtered trans-
ducers’ transfer functions. For (θ, φ)
= (0, 0), the vector A
contains the axially filtered transducer responses and will be
noted A
axis
( f ). W( f ) is the vector containing the complex
frequency weights to be applied to transducer 1, , K.In(1),
(
·)
T
denotes the transpose operator.
The aim of our method is to find the optimal weights
w
k
( f ), k = 1, , K that optimize suited directivity charac-
teristics of a given multiway loudspeaker system.
2.2. Loudspeaker Directivity Characteristics. Assuming a
spherical wave radiation, the directional factor of the mul-
tiway loudspeaker system is given by
DF
θ, φ, f
=
A
H
θ, φ, f
W
f
A
H
axis
f
W
f
,(2)
where
|·|is the modulus operator and (·)
H
denotes the
complex conjugate transpose operator.
The directivity of the loudspeaker system can then be
approached by [10]
D
f
=
W
H
f
E
f
W
f
W
H
f
L
f
W
f
,(3)
where E( f )andL( f )areK
× K matrices given by
E
f
=
A
axis
f
A
H
axis
f
,
L
f
=
1
4π
π
θ
=0
2π
φ
=0
A
θ, φ, f
A
H
θ, φ, f
sin
(
θ
)
dθ dφ.
(4)
The directivity index of the filtered loudspeaker system is
then given by
DI
f
=
10 log
10
D
f
,(5)
where log
10
(·) is the decimal logarithm function.
2.3. Cost Function. The proposed algorithm for optimizing
the crossover filter bank of a multiway loudspeaker system
is based on antenna array filtering techniques [11]. For this
system, the synthesis of the radiation pattern is generally
based on finding the weights that produce a predefined polar
response. The principle of this synthesis is equivalent to
minimizing a Hermitian criterion on the differences between
the radiation pattern of the weighted system and a given
target.
For our context, we seek to control the radiation of a
multiway loudspeaker system over the transducers’ overlap
frequency bands. Our goal is to ensure a progressive directiv-
ity, in the vertical plane (φ
= 0) orthogonal to transducers’
membranes, by forcing N directions (θ
n
, φ = 0), n = 1, , N
of the radiation pattern (2) to positive gains g
n
( f ). This
criterion can be achieved by minimizing the following cost
function:
J
(
W
)
=
N
n=1
A
H
θ
n
,0, f
W
f
−
g
n
f
A
H
axis
f
W
f
2
.
(6)
The control of the radiation pattern in various directions
requires the choice of fixed gains g
n
( f ) for the corresponding
angles. This gain can be the same for all the frequencies of the
overlap band. Otherwise it can be a decreasing function with
frequency according to loudspeaker system directivity.
In the case of a multiway loudspeaker system the control
of the radiation pattern is done for few directions. As a
first constraint, the cost function must take into account
the fluctuations of the r adiated acoustic power over overlap
frequency bands. This can be reached by minimizing the
fluctuations of the directivity index of the multiway loud-
speaker system around an average target response DI
av
( f ).
As a second constraint the optimization process should
not induce important amplitude fluctuations over the axial
response of the multiway loudspeaker system. Taking into
EURASIP Journal on Audio, Speech, and Music Processing 3
account these constraints, the cost function to be minimized
can be rewritten as follows:
J
W, α, β
=
N
n=1
A
H
θ
n
,0, f
W
f
− g
n
f
A
H
axis
f
W
f
2
+ α
A
H
axis
f
W
f
− 1
2
+β
W
H
f
P
f
W
f
2
,
(7)
where P( f )
= E( f ) − σ( f )L( f ), σ( f ) = e
0.23DI
av
( f )
and e(·)
is the exponential function. In (7) α and β are two Lagrange
multipliers.
The cost function to be minimized is thus a weighted sum
of the following components:
(1)
N
n
=1
(|A
H
(θ
n
,0, f )W( f )|−g
n
( f )|A
H
axis
( f )W( f )|)
2
:
to control the radiation pattern of the loudspeaker
system in N directions,
(2) (
|A
H
axis
W( f )|−1)
2
:tocontroltheaxialresponseof the
loudspeaker system and avoid excessive amplitude
weights,
(3)
|W
H
( f )P( f )W( f )|
2
:tocontrol the directivity index
of the loudspeaker system in order to avoid unaccept-
able fluctuations of the radiated a coustic power over
transducers overlap bands.
2.4. Determination of the Optimal Weights. The cost of (7)
is more complicated than a cost on the complex terms:
n
(A
H
(θ
n
,0, f )W( f ) − g
n
( f ))
2
where the optimal solu-
tions on
|A
H
(θ
n
,0, f )W( f )|=g
n
( f )(2
N
for n = 1, , N)
are symmetrical compared to the the origin. However,
J(W, α, β)isdifferentiable according to w
1
( f ), , w
K
( f ):
components of the vector W( f ). We can so calculate the gra-
dient and use an iterative optimization method which gives
approximated numerical solutions of the optimal weights to
be applied to the crossover filter transfer functions.
Let R( f )andQ( f ) be the N
× 1vectorsgivenby
R
f
=
A
H
θ
1
,0, f
W
f
···
A
H
θ
N
,0, f
W
f
T
,
Q
f
=
g
1
f
A
H
axis
f
W
f
···
g
N
f
A
H
axis
f
W
f
T
.
(8)
By using the previous notations we can rewrite (7)as
follows:
J
W, α, β
=
R
f
− Q
f
2
+ α
A
H
axis
f
W
f
− 1
2
+ β
W
H
f
P
f
W
f
2
=
R
f
2
+
Q
f
2
− 2Q
f
T
R
f
+ α
A
H
axis
f
W
f
− 1
2
+ β
W
H
f
P
f
W
f
2
.
(9)
The gradient
−→
∇
W
J(W, α, β) of the cost function J(W,
α, β) (developed in the appendix) is given by
−→
∇
W
J
W, α, β
=
∂J
W, α, β
∂W
∗
=
Y
f
Y
H
f
+ X
f
X
H
f
W
f
−
Y
f
U
f
Y
H
f
W
f
−
X
f
V
f
X
H
f
W
f
+ α
⎛
⎝
1 −
1
A
H
axis
f
W
f
⎞
⎠
A
axis
f
A
H
axis
f
W
f
+2βW
H
f
P
f
W
f
P
f
W
f
,
(10)
where ∂J(W, α, β)/∂W
∗
denotes the vector of the partial
derivative of J(W, α, β) with respect to the components of the
vector W
∗
,(·)
∗
denotes the complex conjugate operator and
denotes the term-by-term Hadamard product. Matrices
X( f )andY( f ) are of dimension K
× N and they are given
by
X
f
=
A
θ
1
,0, f
, , A
θ
N
,0, f
,
Y
f
=
g
1
f
A
axis
f
, , g
N
f
A
axis
f
.
(11)
In (10), U( f )andV( f ) are the N
× K matrices given by
U
f
=
Q
f
./R
f
, , Q
f
./R
f
,
V
f
=
R
f
./Q
f
, , R
f
./Q
f
,
(12)
where ./ denotes the term by term division.
For a given value of W( f ), the gradient
−→
∇
W
J(W, α, β)
have a component which is opposite to the direction of the
minimum. The algorithm of gradient descent [12]advances
W( f ) in the opposite direction of the gradient and narrows
it to the minimum. This algorithm is given by the following
formula:
W
m+1
α, β, f
=
W
m
α, β, f
−
μ
−→
∇
W
J
W
m
α, β, f
,
(13)
4 EURASIP Journal on Audio, Speech, and Music Processing
where m is the number of iteration and μ is a step-size
parameter introduced to control how far we can move along
the error function surface at each iteration. If μ is large
we can quickly reach the minimum but with bad precision.
Conversely, if μ is small, the minimum is reached with better
precision, but more slowly. Since no real-time constraint is
imposed to the optimization process, we can use a small
value for the step-size parameter μ and allow a large number
of iteration to the gradient algorithm. This guarantees a
better precision for the optimal weighting vector W
opt
( f ).
The complexity of this algorithm after M iteration amounts
to M(14K
2
+11K +8KN + N + 6) single instruction.
3. Application Example
3.1. Loudspeaker Systems with Separately Distributed Trans-
ducers. From (3), it can be seen that the determination of
the directivity index for a multiway loudspeaker exhibits the
knowledge of the system responses in all directions (θ, φ)
over the 4π steradian. However, this becomes more com-
plicated when using traditional loudspeakers with separately
distributed transducers. Meyer [13] and Kenneth and Birkle
[14] proposed the use of some interpolation techniques
for the estimation of loudspeaker system response at any
given direction. However these methods still show limited
performances, for real applications because they are based
on using simplified model radiators such as monopole or flat
piston mounted in an infinite baffle.
3.2. Loudspeakers with Coaxially Mounted Transducers. In
the case of coaxial loudspeaker systems [7] and based on axial
symmetries (around the [Oz) axis for the system of Figure 1),
the expression of the matrix L( f )in(3) used to characterize
the directivity index of the system can be simplified to the
following formula:
L
f
=
1
2
π
θ
=0
A
θ, f
A
H
θ, f
sin
(
θ
)
dθ.
(14)
Thus, for calculating the directivity index of a coaxial
loudspeaker system we just need few measurements over 2π
steradian.
3.3. Experimental Results. The algorithm described in the
previous section will then be applied to enhance the control
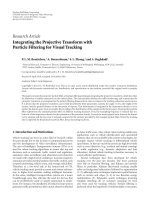
of the directivity characteristics of a Cabasse, two-way coaxial
loudspeaker system shown in Figure 2.
This loudspeaker system consists of two transducers
coaxially mounted in a closed box enclosure. The central
dome with a convex shape is the tweeter of diameter 0.028 m
surrounded by the medium concentric radiating ring with an
outside diameter of 0.106 m and inside diameter of 0.043 m.
The tweeter dome is loaded by a small waveguide which helps
in assuring the continuity of shape with the medium drive
unit and optimizes the polar pattern of the tweeter on its
low-frequency range, especially on the overlap region with
the medium [7]. This transducer has a conical shape on its
center. As far as the periphery part is concerned, it turns to a
convex shape in order to prevent diffraction effects.
Medium
Twee ter
Waveguide
Closed box enclosure
Figure 2: The Cabasse two-way coaxial loudspeaker system.
The measurements of the frequency responses neces-
sary for determining the directivity characteristics of the
loudspeaker system were made in an anechoic room of
size 6
× 7 × 8m
3
. The block diagram of the measur-
ing chain is given by Figure 3. In this diagram, a per-
sonal computer allows the generation and acquisition of
the input and output signals needed to characterize the
acoustic drivers. The determination of transducers’ impulse
responses is based on the Maximum Length Sequences
(MLS) technique [15]. Another function of the personal
computer is the control of the turntable on which lies
the loudspeaker system. These functions are managed
by the CLIOwin ( />software. The input channel of a dedicated sound card
is connected to a calibrated microphone (CLIO MIC-03,
condenser electret, microphone) positioned at 1 m in front
of the tweeter dome. The amplified signal of the sound
card output channel is connected to the loudspeaker system
input. Once a measurement is done, the turntable is shifted
with 5
◦
. Considering the loudspeaker system symmetry, only
measurements between 0
◦
and 180
◦
are needed (14). All
the measurement data are then exported in a usable format
by the MATLAB ( />The experimental protocol described previously is applied
separately to each transducer of the loudspeaker system.
The on-axis amplitude responses of the medium
(
|h
1
(0, 0, f )|) and the tweeter (|h
2
(0, 0, f )|) are depicted in
Figure 4. We can identify the band-pass behavior of these
transducers with a frequency band of [500 Hz, 4000 Hz]
for the first drive unit and [4000 Hz, 20000 Hz] for the
second one. The fluctuations in these amplitude responses
are mainly due to diffraction effects and can be corrected by
an adapted equalizer.
In practice, the width of the frequency overlap band
do not exceed 2 octaves. This width takes into account
the nonlinear behavior of the transducers. From the axial
amplitude responses of the two transducers given in Figure 4,
we can see an extended overlap frequency band ranging from
2000 Hz to 6000 Hz.
In this section we will also compare the performances
of our method to a conventional one, such as, that one
proposed by Vanderkooy and Lipshitz [4]. In this paper,
EURASIP Journal on Audio, Speech, and Music Processing 5
Microphone
Amplifier
Pre-amplifier
1m
Loudspeaker system
Turn tab le
Turntable control
Anechoic room
Personal
computer
Sound
card
Figure 3: Experimental measurement protocol.
10
3
10
4
−40
−35
−30
−25
−20
−15
−10
−5
0
5
10
Frequency (Hz)
Amplitude (dB)
h
1
(0,0, f )
h
2
(0,0, f )
Figure 4: On-axis amplitude responses of the transducers.
the authors proposed the use of a pair of an in-phase
squared Butterworth crossover filters. The amplitude and
phase responses of these filters are shown in Figure 5.
The Butterworth filters have been designed to have a
cutoff of 4000 Hz and moderate slopes of 24 dB/octave. With
this crossover and since we are using a coaxial configuration
for the multiway loudspeaker system, no extra processing is
needed to correct the delays between the signals coming from
the several transducers.
The crossover that we propose for the optimization
process is a pair of low-pass (of order 14)/high-pass (of
order 26), linear phase, finite impulse response filters. The
amplitude and phase responses of these filters are shown in
Figure 6. This filter bank have been designed to have the same
cutoff frequency and slopes as the squared Butterworth filters
shown in Figure 5.
For the optimization, we targeted the control of the
radiation pattern at four directions (θ
1
= 15
◦
, φ = 0),
(θ
2
= 30
◦
, φ = 0), (θ
3
= 45
◦
, φ = 0) and (θ
4
= 60
◦
, φ = 0).
For a given angle θ
i
(n = 1, , N = 4), the gain g
n
( f ), in
(7), decreases linearly with frequency in order to achieve a
radiation pattern that narrows when the frequency increases.
The algorithm is stopped after M
= 2000 iteration which
leads to 296000 instruction. In order to achieve a good
precision for the optimal weighting vector W
opt
( f ), the step
size μ can be chosen in the interval [0.008, 0.01].
We considered the case where we give much more
importance to the control of the directivity index than
that of the radiation pattern and the axial response of the
loudspeaker system. This choice means a uniformly radiated
sound power over a wider listening area. In this case, we
adjust the Lagrange multipliers to α
= 1andβ = 100. In this
paper we have not developed a study on an optimal choice
6 EURASIP Journal on Audio, Speech, and Music Processing
10
3
10
4
−40
−35
−30
−25
−20
−15
−10
−5
0
5
10
Frequency (Hz)
Amplitude (dB)
(a) amplitude responses
0.2 0.4 0.6 0.8 1 1.2 1.4 1.6 1.8 2
×10
4
−6
−4
−2
0
2
4
6
Frequency (Hz)
Angle (Rad)
b
1
( f )
b
2
( f )
(b) phase responses
Figure 5: Frequency responses of the squared Butterworth crosso-
ver filters.
of parameters α and β. Indeed, the choice has been done
systematically according to the importance we want to give
to each directivity criterion.
The amplitude responses of the original and weighted
linear-phase crossover filters are shown in Figure 7(a).The
optimization process modifies the amplitude of the original
filters over the frequency band of interest without adding
high level gains. Figure 7(b), depicts the group delay τ
g
1
( f )
and τ
g
2
( f ) of the weighting filters w
1
( f )andw
2
( f ). These
delays are analytically given by
τ
g
k
f
=−
1
2π
∂Φ
w
k
( f )
∂f
,
(15)
where Φ
w
k
( f )
is the phase of the weighting filter w
n
( f )with
k
= 1ork = 2.
10
3
10
4
−40
−35
−30
−25
−20
−15
−10
−5
0
5
10
Frequency (Hz)
Amplitude (dB)
(a) amplitude responses
0.2 0.4 0.6 0.8 1 1.2 1.4 1.6 1.8 2
×10
4
−6
−4
−2
0
2
4
6
Frequency (Hz)
b
1
( f )
b
2
( f )
Phase (Rad)
(b) phase responses
Figure 6: Frequency responses of the linear-phase crossover filters.
As shown in Figure 7(b), the fluctuation of the group
delay for the weighting filters, w
1
( f )andw
2
( f ), do not
exceed 1 ms which, according to Blauert and Laws [16],
should not induce audible effects.
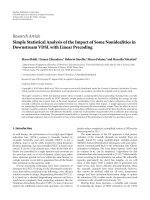
The directivity characteristics of the multiway loud-
speaker system are given in Figures 8, 9,and10.The
radiation patterns of the loudspeaker system at 3 frequencies
( f
= 3000 Hz, f = 4000 Hz, and f = 5500 Hz) of the
overlapregionaregiveninFigure8. As a first conclusion we
remark a well controlled directivity compared to the case of
the nonoptimized crossover filters or the case of using the
conventional squared-Butterworth crossover filters. Indeed,
with the optimization process, the main lobe of the multiway
loudspeaker system narrows as the frequency increases.
The second conclusion that we can notice is that the
conventional method do not modify the radiation pattern of
EURASIP Journal on Audio, Speech, and Music Processing 7
10
3
10
4
−40
−35
−30
−25
−20
−15
−10
−5
0
5
10
Frequency (Hz)
Amplitude (dB)
b
1
( f )
b
2
( f )
b
1
( f )w
1
( f )
b
2
( f )w
2
( f )
(a) amplitude responses
10
3
10
4
−2.5
−2
−1.5
−1
−0.5
0
0.5
1
1.5
2
2.5
Frequency (Hz)
Time (ms)
w
1
( f )
w
2
( f )
Audibility threshols
(b) group delay
Figure 7: Frequency responses of the optimized crossover filters.
the loudspeaker system because, for each crossover network
(the linear-phase, finite impulse response crossover and the
squared Butterworth one), the filters used are in phase.
In Figure 9, we show the amplitude responses of the two-
way coaxial loudspeaker system at 0
◦
,30
◦
,and60
◦
.From
Figures 9(a), 9(b),and9(c), we observe that the optimization
of crossover filters provides a steady decrease over the ampli-
tude response of the loudspeaker system as we move away
from its central axis. At this step, we can also underline the
advantages of using a linear-phase, finite impulse responses
filter bank ov er a squared Butterworth o ne. In fact, with a
conventional filtering using a squared Butterworth crossover,
an undesirable boost over the amplitude response of the
5
10
15
20
25
30
210
60
240
90
270
120
300
150
330
180
0
(a) f = 3000 Hz
5
10
15
20
25
30
210
60
240
90
270
120
300
150
330
180
0
(b) f = 4000 Hz
5
10
15
20
25
30
210
60
240
90
270
120
300
150
330
180
0
Before optimization
Conventional method
After optimization
(c) f = 5500 Hz
Figure 8: Radiation pattern of the multiway loudspeaker system.
8 EURASIP Journal on Audio, Speech, and Music Processing
10
3
10
4
−20
−15
−10
−5
0
5
10
Frequency (Hz)
Amplitude (dB)
(a) 0
◦
10
3
10
4
−20
−15
−10
−5
0
5
10
Frequency (Hz)
Amplitude (dB)
(b) 30
◦
10
3
10
4
−20
−15
−10
−5
0
5
10
Frequency (Hz)
Amplitude (dB)
Before optimization
Conventional method
After optimization
(c) 60
◦
Figure 9: Amplitude responses of the multiway loudspeaker system.
10
3
10
4
−5
0
5
10
15
Frequency (Hz)
DI (dB)
Before optimization
Conventional method
DI
av
( f )
After optimization
Figure 10: Directivity index of the multiway loudspeaker system.
loudspeaker system still remain over [3000 Hz, 5000 Hz]
frequency band and even 60
◦
away from the central axis of
the loudspeaker system.
Regarding the directivity index, given in Figure 10,we
see an improvement in the behavior of the radiated sound
power after the weighting of the linear-phase, finite impulse
response crossover filters. Indeed, with the optimization
process, we have less fluctuations over the directivity index
of the loudspeaker system as we move from the medium
to the tweeter. We also remind that the in-phase behavior
of the two filter banks used justifies the similarity between
the directivity index of the loudspeaker system before the
optimization of the linear-phase, finite impulse response
crossover filters and when using a squared Butterworth
crossover network.
4. Conclusion
In order to correct the frequency response or the lobbing
errors of a multiway loudspeaker system, most solutions [1,
4] are based on delaying the signals sent to the loudspeaker
system transducers. These solutions failed in achieving a uni-
formly radiated sound field especially when the transducers
of the loudspeaker s ystem are separately distributed.
In this paper, we have shown that, a dedicated complex
weighting of the crossover filter responses, jointly optimizes
the frequency response, the radiation pattern and the direc-
tivity index of the loudspeaker system over a wide frequency
overlap band. Additionally, the performances obtained, are
function of the degree of importance given to each radiation
criterion through a judicious adjustment of Lagrange mul-
tipliers. The proposed method was then applied to enhance
the control of the directivity behavior of a two-way coaxial
loudspeaker system from the Cabasse company. In order to
confirm its advantages, the performances of the proposed
method were compared to a conventional crossover network
EURASIP Journal on Audio, Speech, and Music Processing 9
bank design [4] using a pair of in-phase squared Butterworth
filters. Once the complex weights are obtained, the impulse
responses of the optimized crossover filters can be obtained
by using the generalized least squares method [17].
The method proposed in this paper can easily be applied
to any frequency band. The interested reader can refer to
[7] to get more information about the application of this
technique to a three-way or a four-way loudspeaker system.
Appendix
Our aim is to calculate the gradient of the cost function
J(W, α, β)givenby(9)
−→
∇
W
J
W, α, β
=
∂J
W, α, β
∂W
∗
=
∂
∂W
∗
R
f
2
+
Q
f
2
− 2Q
f
T
R
f
+α
A
H
axis
f
W
f
−
1
2
+β
W
H
f
P
f
W
f
2
.
(A.1)
Let’s calculate the gradient of each term in the previous
equation:
(i) ∂
|R( f )|
2
/∂W
∗
( f ) =?and∂|Q( f )|
2
/∂W
∗
( f ) =?
R
f
2
=
N
n=1
A
H
θ
n
,0, f
W
f
2
= W
H
f
X
f
X
H
f
W
f
,
(A.2)
where X( f ) is the K
× N matrix given by (11).
By the mean of complex matrices derivation formulas
[11], we can write
∂
R
f
2
∂W
∗
f
=
X
f
X
H
f
W
f
.
(A.3)
The same methodology applied to
|Q( f )|
2
gives
∂
Q
f
2
∂W
∗
f
= Y
f
Y
H
f
W
f
,
(A.4)
where Y ( f ) is the K
× N matrix given by (11).
(ii) ∂Q
T
( f )R( f )/∂W
∗
( f ) =?
The scalar Q
T
( f )R( f ) is the sum of N components.
Q
T
f
R
f
=
N
n=1
g
n
f
A
H
axis
f
W
f
2
A
H
θ
n
,0, f
W
f
2
=
N
n=1
q
n
r
n
,
(A.5)
where q
n
( f ) =
g
n
( f )|A
H
axis
( f )W( f )|
2
and r
n
( f ) =
|A
H
(θ
n
,0, f )W( f )|
2
.
For n
= 1, , N:
∂q
n
f
r
n
f
∂W
∗
f
=
∂
g
n
f
A
H
axis
f
W
f
2
A
H
θ
n
,0, f
W
f
2
∂W
∗
f
=
g
n
f
A
H
axis
f
W
f
2
∂
A
H
θ
n
,0, f
W
f
2
∂W
∗
f
+
A
H
θ
n
,0, f
W
f
2
∂
g
n
f
A
H
axis
f
W
f
2
∂W
∗
f
=
q
n
f
2r
n
f
A
θ
n
,0, f
A
H
θ
n
,0, f
H
W
f
+
r
n
f
2q
n
f
g
n
f
2
A
axis
f
A
H
axis
f
W
f
.
(A.6)
The derivative of Q
T
( f )R( f ) is then given by
∂Q
T
f
R
f
∂W
∗
f
=
N
n=1
∂q
n
f
r
n
f
∂W
∗
f
=
⎡
⎣
N
n=1
q
n
f
2r
n
f
A
θ
n
,0, f
A
H
θ
n
,0, f
⎤
⎦
W
f
+
⎡
⎣
N
n=1
r
n
f
2q
n
f
g
n
f
2
A
axis
f
A
H
axis
f
⎤
⎦
W
f
.
(A.7)
Putting the last equation in a matrix form by using the
notations of (10)leadsto
∂Q
T
f
R
f
∂W
∗
f
=
1
2
X
f
V
f
X
H
f
W
f
+
1
2
Y
f
U
f
Y
f
H
f
W
f
,
(A.8)
(iii) ∂(
|A
H
axis
( f )W( f )|−1)
2
/∂W
∗
( f ) =?
By developing this term we obtain
A
H
axis
f
W
f
− 1
2
= W
f
H
A
axis
f
A
H
axis
f
W
f
−
2
A
H
axis
f
W
f
+1.
(A.9)
10 EURASIP Journal on Audio, Speech, and Music Processing
For the first term of (A.9)wecanwrite
∂W
H
f
A
axis
f
A
H
axis
f
W
f
∂W
∗
f
=
A
axis
f
A
H
axis
f
W
f
.
(A.10)
The derivative of
|A
H
axis
( f )W( f )| with respect to the
components of W
∗
( f )isgivenby
∂
A
H
axis
f
W
f
∂W
∗
f
=
∂
A
H
axis
f
W
f
2
∂W
∗
f
=
∂
W
H
f
A
axis
f
A
H
axis
f
W
f
∂W
∗
f
=
1
2
W
H
f
A
axis
f
A
H
axis
f
W
f
×
∂W
H
f
A
axis
f
A
H
axis
f
W
f
∂W
∗
f
=
1
2
A
H
axis
f
W
A
axis
f
A
H
axis
f
W
f
.
(A.11)
We obtain finally
∂
A
H
axis
f
W
f
− 1
2
∂W
∗
f
=
⎛
⎝
1 −
1
A
H
axis
f
W
f
⎞
⎠
A
axis
f
A
H
axis
f
W
f
.
(A.12)
(iv) ∂(W
H
( f )P( f )W( f ))
2
/∂W
∗
( f ) =?
The derivative of this composite function is relatively easy
and is equal to
∂
W
H
f
P
f
W
f
2
∂W
∗
f
= 2W
H
f
P
f
W
f
P
f
W
f
.
(A.13)
Finally the gradient of the cost function J(W, α, β)is
given by
−→
∇
W
J
W, α, β
=
Y
f
Y
H
f
+ X
f
X
H
f
W
f
−
Y
f
U
f
Y
H
f
W
f
−
X
f
V
f
X
H
f
W
f
+ α
⎛
⎝
1 −
1
A
H
axis
f
W
f
⎞
⎠
A
axis
f
A
H
axis
f
W
f
+2βW
H
f
P
f
W
f
P
f
W
f
.
(A.14)
Acknowledgments
This work was supported by Cabasse Acoustic Center.
The authors would like to express special gratitude to
Yvon KERNEIS, expert consultant at Cabasse Acoustics
Center, Bernard DEBAIL, R&D director and Pierre-Yves
DIQUELOU, project manager in the supporting company.
The authors also wish to thank Emmanuel DELALEAU,
professor at the
´
Ecole Nationale d’iNg
´
enieurs de Brest, for
various comments and interactions.
References
[1] R. Bews, Digital crossover networks for active loudspeaker
systems, Ph.D. dissertation, University of Essex, Colchester,
UK, 1987.
[2] K. C. Haddad, H. Stark, and N. P. Galatsanos, “Design of
digital linear-phase fir crossover systems for loudspeakers by
the method of vector space projections,” IEEE Transactions on
Signal Processing, vol. 47, no. 11, pp. 3058–3066, 1999.
[3] J. Baird and D. McGrath, “Practical application of linear
phase crossovers with transition bands approaching a brick
wall response for optimal loudspeaker frequency, impulse and
polar response,” in Proceedings of the 115th Convention of the
Audio Engineering Society, New York, NY, USA, October 2003.
[4] J. Vanderkooy and S. P. Lipshitz, “Power response of
loudspeakers with non-coincident drivers-the influence of
crossover design,” Journal of the Audio Engineering Society, vol.
34, no. 4, pp. 236–244, 1986.
[5] J. A. d’Appolito, “A geometric approach to eliminating lobbing
error in multiway loudspeakers,” in Proceedings of the 74th
Convention of the Audio Engineering Society,NewYork,NY,
USA, October 1983.
[6] A. Rimell, Reduction of loudspeaker polar response aberrations
through the application of psychoacoustic error concealment,
Ph.D. dissertation, Universityof Essex, Colchester, UK, 1996.
[7] H. Shaiek, Optimizing wide band coaxial loudspeaker systems
using digitalsignal processing techniques, Ph.D. dissertation,
TELECOM, Bretagne, France, 2007.
[8] N. Zacharov, “Subjective appraisal of loudspeaker directivit y
for multichannel reproduction,” Journal of the Audio Engineer-
ing Society, vol. 46, no. 4, pp. 288–303, 1998.
[9] D. Queen, “The effect of loudspeaker radiation patterns on
stereo imaging and clarity,” Journal of the Audio Engineering
Society, vol. 27, no. 5, pp. 358–379, 1979.
[10] L. E. Kinsler, A. R. Frey, A. B. Coppens, and J. V. Sanders,
Fundamentals of Acoustics, John Wiley & Sons, New York, NY,
USA, 4th edition, 2000.
[11] R. Lamberti, Antenna array synthesis and pattern constrained
adaptive beamforming, Ph.D. dissertation, University of Orsay,
Orsay, France, 1993.
[12] J. A. Snyman, Practical Mathematical Optimization: An Intro-
ductionto Basic Optimization Theory and Classical and New
Gradient-Based Algorithms, Springer, Berlin, Germany, 2005.
[13] D. G. Meyer, “Computer simulation of loudspeaker directiv-
ity,” Journal of the Audio Engineering Society,vol.32,no.5,pp.
294–314, 1984.
[14] J. D. Kenneth and T. K. Birkle, “Prediction of the full-space
directivity characteristics of loudspeaker arrays,” Journal of the
Audio Engineering Society, vol. 38, no. 4, pp. 250–259, 1990.
[15] D. D. Rife and J. Vanderkooy, “Transfer-function measure-
ment with maximum-length sequences,” Journal of the Audio
Engineering Society, vol. 37, no. 6, pp. 419–444, 1989.
EURASIP Journal on Audio, Speech, and Music Processing 11
[16] J. Blauert and P. Laws, “Group delay distortions in electroa-
coustical systems,” Journal of the Acoustical Society of America,
vol. 63, no. 5, pp. 1478–1483, 1978.
[17] T. I. Laakso, V. V
¨
alim
¨
aki, M. Karjalainen, and U. K. Laine,
“Splitting the unit: delay tools for fractional delay filter
design,” IEEE Signal Processing Magazine,vol.13,no.1,pp.
30–60, 1996.