Trend Forecasting with Intermarket Analysis Predicting Global Markets with Technical Analysis Trade Secrets Marketplace Books_6 pot
Bạn đang xem bản rút gọn của tài liệu. Xem và tải ngay bản đầy đủ của tài liệu tại đây (288.2 KB, 14 trang )
TRADE SECRETS
56
Thus, gold prices are an important component in performing intermar-
ket analysis of the forex market. If you see a trend or price signal on
a gold chart, it may be a good clue for taking a position in the forex
market, where a price move may not have occurred yet, or a forex move
may tip off a gold move.
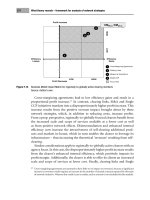
One of the factors cited for the rise in oil prices is the weakness of the
dollar as foreign oil producers viewed increases in oil prices as a way
to maintain their purchasing power in U.S. dollar terms (Figure 5.4).
One way to counter the impact of higher oil prices is a weaker dollar,
in what could become a vicious inflationary cycle.
Oil is a key commodity driving global economic growth, and oil prices
and forex have a key relationship in the global economy. For example,
when oil becomes expensive, it hurts the economy of Japan, which has
Source: VantagePoint Intermarket Analysis Software (www.TraderTech.com)
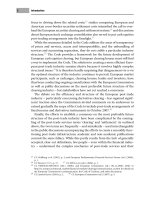
gold and the euro—a strong Correlation. when the value of the u.s.
dollar rises or sinks, the euro often does the opposite, making it a
good matCh with gold priCes if you are looking for two markets mov-
ing in the same direCtion.
Fi g u r e 5.3.
57
FOREX TRADING USING INTERMARKET ANALYSIS
to rely on imports for most of its energy needs. That weakens the yen.
High oil prices benefit the economy of a country such as the United
Kingdom, which produces oil, which strengthens the value of the
British pound.
Because of the standing of oil in world business and commerce,
anything that affects its supply or distribution is likely to produce a
response in the forex market. This is why terrorist attacks or natural
disasters such as hurricane Katrina, which threaten the normal flow of
oil, often cause an immediate response in the forex market. A sudden
shift from the dollar to the euro as the designated currency in crude oil
contracts, as Mideast oil producers have mentioned from time to time,
could also cause an immediate decline in the value of the U.S. dollar.
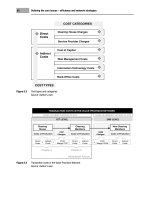
Source: VantagePoint Intermarket Analysis Software (www.TraderTech.com)
oil and the u.s. dollar—another CrissCrossing Correlation. as the
value of the u.s. dollar deClines, Crude oil priCes, like gold, tend to go
up as oil produCers try to overCome the effeCts of a falling dollar.
beCause of its Central role in global eConomies, oil is a key faCtor in
intermarket analysis of finanCial markets.
Fi g u r e 5.4.
TRADE SECRETS
58
Although these are the kinds of shocks that make market analysis
difficult for any trader, the more typical scenario usually involves
subtle movements taking place in intermarket relationships that hint
a price change may be coming. If you are not using intermarket
analysis, you probably are not going to pick up on all those relation-
ships and the effects they have on markets, as those clues are hidden
from obvious view.
Gold and oil are not the only commodities affected by changes in
forex values. Exports of agricultural commodities account for a sizable
share of U.S. farm income. When the value of the dollar rises, it tends
to curtail buying interest from an importing nation as the commodity
becomes too expensive in terms of that nation’s domestic currency.
When the value of the dollar declines, it reduces the price to an
importing nation in terms of its currency and encourages it to buy more
U.S. agricultural products. Instead of hedging their soybeans or corn, it
may not be too far-fetched to suggest that U.S. farmers should be learn-
ing how to hedge the value of their production in the forex market.
Cotton is another commodity market strongly influenced by shifts in
the forex market, especially with China as a major player in cotton
because of its textile industry. Forex traders worried about the impact
of China’s revaluation of its currency on the world’s forex market might
even think about trading in the cotton market.
The influence that one market has on another market naturally shifts
over time so these relationships are not static but should be the
subject of ongoing study. Forex traders should also be aware that the
impact from related markets may not be instantaneous. It may take
time for a policy decision or other development to have an impact on
the ever-changing marketplace. In addition, an influencing condition
may influence a market direction for only a short period of time, so
traders may have only a brief window in which to capitalize on a trad-
ing opportunity.
59
FOREX TRADING USING INTERMARKET ANALYSIS
analyTiCal CHallenge
Intermarket analysis is not an easy task to accomplish for the average
forex trader. The complexity of the dynamics between markets and
their influences on each other mean that just comparing price charts
of two currencies and producing a chart of the spread difference or a
ratio between the two prices is not enough to get the full picture of a
currency’s strength or weakness or its potential for a price move.
Some analysts like to do correlation studies of two related markets,
which measures the degree to which the prices of one market move in
relation to the prices of the second market. Two markets are consid-
ered perfectly correlated if the price change of the second market can
be forecasted precisely from the price change of the first market. A
perfectly positive correlation occurs when both markets move in the
same direction. A perfectly negative correlation occurs when the two
markets move in opposite directions.
However, this approach has its limitations because it compares prices
of only two currencies to one another and does not take into account
the influence of other currencies or other markets on the target market.
In the financial markets and especially the forex markets, a number of
related markets need to be included in the analysis rather than assum-
ing that there is a one-to-one cause-and-effect relationship between
just two markets.
The correlation studies also do not take into account the leads and lags
that may exist in economic activity or other factors affecting a forex
market. Typically their calculations are based only on the values at the
moment and may not consider the long-term consequences of central
bank intervention or a policy change that takes some time to influence
the markets.
The Canadian and Australian dollars, for example, are considered
“commodity currencies.” They may be highly correlated when a
TRADE SECRETS
60
development influences raw commodity prices in general, and they
may move in tandem as the value of the U.S. dollar or other major
currencies move in the other direction by varying amounts. However,
the Australian dollar is more sensitive to developments in Asia and
may be more responsive to what is happening in that area of the world,
at least for a while. Likewise, as China’s currency becomes more sig-
nificant in world currency markets, it may have more influence on the
Japanese yen than on other major currencies. Developments in the
British economy may keep the British pound from following the lead
of the euro.
mUlTimarkeT eFFeCT
The forex market is a dynamic marketplace, constantly shifting and
evolving. It is not one currency versus the world but all currencies
affecting all other currencies to a greater or lesser degree. To attempt
to examine the multiple effects of five or ten related markets such as
forex simultaneously on a target market, reviewing five or ten years
of data to find recurring, predictive patterns, methods such as linear
correlation analysis and subjective chart analysis quickly reveal their
limitations and inadequacies as trend and price-forecasting tools.
Single-market analysis tools cannot ferret out forex market interrela-
tionships. If traders are serious about forex trading, they need to make
the commitment to get the right tools from the beginning, or they are
likely to struggle to keep their accounts intact. When it come to invest-
ing in analytical tools, another familiar saying: “Penny wise and pound
foolish” is apropos.
Nothing, of course, is 100% correct, no matter what tools are used. Even
the best tool can only provide mathematical probabilities, not certain-
ties, but the tools do not need to be perfect to provide a trading edge.
If analytical tools can find and identify the recurring patterns within
individual forex markets and between related global markets, that is
61
FOREX TRADING USING INTERMARKET ANALYSIS
all that is necessary to have a leg up on other traders. This insight into
price activity over the next few days can provide added confidence and
discipline to adhere to trading strategies and enable traders to pull the
trigger at the right time without self-doubt or hesitation.
6
63
When all of the many shifting and changing intermarket relationships
in the forex markets discussed in Chapter 5 are considered, traders
might wonder how anyone could possibly pick out patterns and rela-
tionships from such a mass of data. The approach taken here to fore-
cast moving averages is based on the use of neural networks applied
to price, volume, and open interest data on each target market and
various related markets.
Unlike the subjective approach of chart analysis, neural networks
provide an objective way to identify and analyze the complex rela-
tionships that exist in forex and related markets. They reveal hidden
patterns and correlations in these markets that cannot be spotted on
a chart or through the use of traditional single-market indicators that
tend to lag the markets.
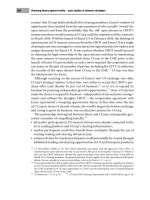
A neural network is not a human brain, but it takes on some brain-like
functions as it studies data, “learns” relationships within and between
markets, recognizes patterns in past data, and uses this information to
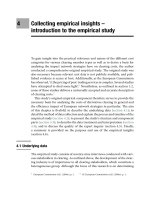
make forecasts about the target market. The neural net is essentially a
modeling tool that accepts a variety of data and processes information
in a manner similar to the brain (Figure 6.1).
Using neUral
neTWorks To
analyZe Forex
TRADE SECRETS
64
Neural nets were used in corporate decision-making, medical diagnos-
tics, and many other applications before I began using them in finan-
cial forecasting in the late 1980s. Fortunately, traders using a program
such as VantagePoint do not have to get under the hood and know
exactly how neural networks function. Instead, they can concentrate on
trading because expert developers have done extensive experimenta-
tion to develop the best trading model. However, to have confidence in
a neural network trading model, it is worthwhile to have at least some
understanding of neural networks and their training process.
inPUT layer
A critical first step in neural-network analysis is data input. The fore-
casts from a neural network are only as good as the data put into it.
Collecting, cleaning, selecting, and preparing the data for analysis are
all important. Neural networks are not limited to single-market data
Source: Market Technologies, LLC (www.MarketTechnologies.com)
neural networks Continuously try to find hidden patterns. like the
human brain, neural networks “learn” by sifting through data over
and over again to find patterns.
Fi g u r e 6.1.
65
FOREX TRADING USING INTERMARKET ANALYSIS
inputs nor are they limited solely to technical data inputs. The data
goes far beyond just price or technical indicators, including volume
and open interest for the target market, intermarket data from related
markets, and even fundamental data.
With VantagePoint, for example, the raw data inputs involved in
forecasting moving averages for euro forex futures include the daily
open, high, low, close, volume and open interest for euro forex, plus
the daily open, high, low, close, volume and open interest data for
nine related markets.
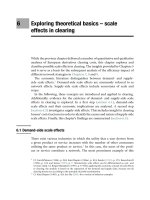
Each VantagePoint program is designed specifically for a particular
target market and uses five neural networks, in a two-level hierarchy,
to forecast five different indicators for that market (Figure 6.2).
Source: Market Technologies, LLC (www.MarketTechnologies.com)
map of a suCCessful neural network trading program. vantagepoint
is an example of an analytiCal software program that uses multiple
neural networks to analyze data and produCe market foreCasts.
Fi g u r e 6.2.
TRADE SECRETS
66
• Thefirstnetworkforecaststomorrow’shightohelpset
stops for entry and exit points.
• Thesecondnetworkforecaststomorrow’slowtohelpset
stops for entry and exit points.
• Thethirdnetworkforecastsafive-daymovingaverageof
closes two days into the future to indicate the expected
short-term trend direction within the next two days.
• Thefourthnetworkforecastsaten-daymovingaverageof
closes four days into the future to indicate the expected
medium-term trend direction within the next four days.
• Thefifthnetworkindicateswhetherthemarketisexpect-
ed to change trend direction within the next two days, by
making a top or a bottom.
The first four networks at the primary level of the network hierarchy
make independent market forecasts of the high, low, short-term trend
and medium-term trend. These predictions are then used as inputs
into the fifth network, along with other intermarket data inputs, at the
secondary level of the network hierarchy, to predict market turning
points.
Once raw input data have been selected, it is preprocessed or mas-
saged using various algebraic and statistical methods of transforma-
tion, which help to facilitate “learning” by the neural network. That
means it is converted into a form that the learning algorithm in the next
layer can best exploit to get the most accurate forecasts in the shortest
amount of time.
Hidden layer
The hidden layer is the learning algorithm used for internal process-
ing to store the “intelligence” gained during the learning process.
67
FOREX TRADING USING INTERMARKET ANALYSIS
There are a number of learning algorithms. The network recodes the
input data into a form that captures hidden patterns and relationships
in the data, allowing the network to come to general conclusions from
previously learned facts and apply them to new inputs. As this learn-
ing continues, the network creates an internal mapping of the input
data, discerning the underlying causal relationships that exist within
the data. This is what allows the network to make highly accurate
market forecasts.
Many different learning algorithms can be used to train a neural net-
work in an attempt to minimize errors associated with the network’s
forecasts. Some are slow while others are unstable.
Training a neural network is somewhat like human learning: repeti-
tion, repetition, repetition. The neural network learns from repeated
exposures to the input data, and learned information is stored by the
network in the form of a weight matrix. Changes in the weights occur
as the network “learns.” Similar to the human learning process, neu-
ral networks learn behaviors or patterns by being exposed to repeated
examples of them. Then the neural networks generalize through the
learning process to related but previously unseen behaviors or pat-
terns. One popular network architecture for financial forecasting is
known as a “feed-forward” network that trains through “back-propaga-
tion of error.”
Although a neural network-based trading program can accommodate
and analyze vast amounts of data, one thing a programmer must avoid
is “over-training,” which is analogous to “curve-fitting” or “over-opti-
mization” in testing rule-based trading strategies. It takes considerable
experimentation to determine the optimum number of neurons in the
hidden layer and the number of hidden layers in a neural network.
If the hidden layer has too few neurons, it cannot map outputs from
inputs correctly. If a network is presented with too many hidden layer
TRADE SECRETS
68
neurons, it memorizes the patterns in the training data without devel-
oping the ability to generalize to new data and discover the underly-
ing patterns and relationships. An over-trained network performs
well on the training data but poorly on out-of-sample test data and
subsequently during real-time trading—just like an over-optimized
rule-based system.
oUTPUT layer
The output layer is where the network’s forecasts are made. During
training, the network makes its forecasts, errors are computed and
“connection weights” between neurons are adjusted prior to the next
training iteration. Connection weights are altered by an algorithm—the
“learning law,” including the back-propagation method—to minimize
output errors. Lots of adjustments may be necessary at any point along
the way to get the desired results.
Two types of real number outputs in financial analysis include price
forecasts, such as the next day’s high and low, and forecasts of forward-
shifted technical indicators, such as the five-day moving average value
for two days in the future. The network developers have to decide not
only what output to forecast but also how far into the future to make
the forecast.
Then comes extensive testing to verify the accuracy of the network’s
forecasts. Testing is performed by creating an independent test file
of data not used during the training process. In the testing mode the
neural network is given these new inputs and uses the representation
that it had previously learned to generate its forecasts so the network
can be evaluated under real-time conditions. This is analogous to
“walk-forward” or “out-of-sample” testing of rule-based trading strat-
egies. The developers can compare performance results from various
networks and decide which network to use in the final application.
69
FOREX TRADING USING INTERMARKET ANALYSIS
As with other aspects of neural network and intermarket analysis
research, there are a number of ways to evaluate performance of a neu-
ral network-based trading strategy. Traders should not attempt to tweak
it by making human “adjustments” without going through the whole
development cycle as such changes could undermine the accuracy
and integrity of the network’s forecasts and results. That is one reason
why traders are not given the option within VantagePoint to make any
change in parameters because the best parameter choices have already
been defined after more exhaustive research than most traders could
ever accomplish.
The result is a trading tool that is not only highly accurate but also
very simple to use even by novice forex traders. Traders do not have
to be rocket scientists to apply the forecasting capabilities of neural
networks in trading the forex markets.
ProoF is in real Trading
Obviously, no neural network nor any other trading tool can give you
100% predictive accuracy. Unforeseen events and random price action
continue to produce uncertain markets. However, the most important
focus is to achieve the most accurate market forecasts as possible.
Neural networks are excellent mathematical tools for finding hidden
patterns and relationships in seemingly disparate data and making
highly accurate short-term market forecasts in a consistent, non-
subjective, quantitative manner. This can be seen in test results with
VantagePoint, which is nearly 80% accurate over all the markets it
analyzes and forecasts (Figure 6.3).
If traders can appreciate the value of having intermarket-based trend
forecasts, giving them a broader vantage point on the markets than
could otherwise be achieved by focusing solely upon the internal
dynamics of one market at a time, then traders will become believers