Báo cáo hóa học: " Research Article Classification of Pulse Waveforms Using Edit Distance with Real Penalty" potx
Bạn đang xem bản rút gọn của tài liệu. Xem và tải ngay bản đầy đủ của tài liệu tại đây (1.53 MB, 8 trang )
Hindawi Publishing Corporation
EURASIP Journal on Advances in Signal Processing
Volume 2010, Article ID 303140, 8 pages
doi:10.1155/2010/303140
Research Article
Classification of Pulse Waveforms Using Edit
Distance with Real Penalty
Dongyu Zhang,
1
Wangmeng Zuo,
1
David Zhang,
1, 2
Hongzhi Zhang,
1
and Naimin Li
1
1
Biocomputing Research Centre, School of Computer Science and Technology, Harbin Institute of Technology, Harbin, 150001, China
2
Shenzhen Graduate School, Harbin Institute of Technology, Shenzhen 518055, China
Correspondence should be addressed to Wangmeng Zuo,
Received 13 March 2010; Revised 12 June 2010; Accepted 25 August 2010
Academic Editor: Christophoros Nikou
Copyright © 2010 Dongyu Zhang et al. This is an open access article distributed under the Creative Commons Attribution License,
which permits unrestricted use, distribution, and reproduction in any medium, provided the original work is properly cited.
Advances in sensor and signal processing techniques have provided effective tools for quantitative research in traditional Chinese
pulse diagnosis (TCPD). Because of the inevitable intraclass variation of pulse patterns, the automatic classification of pulse
waveforms has remained a difficult problem. In this paper, by referring to the edit distance with real penalty (ERP) and the
recent progress in k-nearest neighbors (KNN) classifiers, we propose two novel ERP-based KNN classifiers. Taking advantage of
the metric property of ERP, we first develop an ERP-induced inner product and a Gaussian ERP kernel, then embed them into
difference-weighted KNN classifiers, and finally develop two novel classifiers for pulse waveform classification. The experimental
results show that the proposed classifiers are effective for accurate classification of pulse waveform.
1. Introduction
Traditional Chinese pulse diagnosis (TCPD) is a convenient,
noninvasive, and effective diagnostic method that has been
widely used in traditional Chinese medicine (TCM) [1]. In
TCPD, practitioners feel for the fluctuations in the radial
pulse at the styloid processes of the wrist and classify
them into the distinct patterns which are related to various
syndromes and diseases in TCM. This is a skill which
requires considerable training and experience, and may
produce significant variation in diagnosis results for differ-
ent practitioners. So in recent years techniques developed
for measuring, processing, and analyzing the physiological
signals [2, 3] have been considered in quantitative TCPD
research as a way to improve the reliability and consistency
of diagnoses [4–6]. Since then, much progress has been
made: a range of pulse signal acquisition systems have been
developed for various pulse analysis tasks [7–9]; a number
of signal preprocessing and analysis methods have been
proposed in pulse signal denoising, baseline rectification
[10], segmentation [11]; many pulse feature extraction
approaches have been suggested by using various time-
frequency analysis techniques [12–14]; many classification
methods have been studied for pulse diagnosis [15, 16]and
pulse waveform classification [17–19].
Pulse waveform classification aims to assigning a tradi-
tional pulse pattern to a pulse waveform according to its
shape, regularity, force, and rhythm [1]. However, because
of the complicated intra-class variation in pulse patterns
and the inevitable influence of local time shifting in pulse
waveforms, it has remained a difficult problem for automatic
pulse waveform classification. Although researchers have
developed several pulse waveform classification methods
such as artificial neural network [18, 20, 21], decision tree
[22], and wavelet network [23], most of them are only tested
on small data sets and usually cannot achieve satisfactory
classification accuracy.
Recently, various time series matching methods, for
example, dynamical time warping (DTW) [24] and edit
distance with real penalty (ERP) [25], have been applied
for time series classification. Motivated by the success of
time series matching techniques, we suggest utilizing time
series classification approaches for addressing the intraclass
variation and the local time shifting problems in pulse
waveform classification. In this paper, we first develop an
ERP-induced inner product and a Gaussian ERP (GERP)
2 EURASIP Journal on Advances in Signal Processing
Online
Baseline wander removal
Denoising
Periods segmentation
Classification
result
Online
Offline
Offline
Offline
Pulse waveform
database
Processed
pulse waveform
database
Pulse-waveform-
acquisition
Pulse-waveform-preprocessing
Feature-extraction-
and-classification
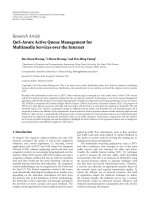
Figure 1: Schematic diagram of the pulse waveform classification modules.
kernel function. Then, with the difference-weighted KNN
(DFWKNN) framework [26], we further present two novel
ERP-based classifiers: the ERP-based difference-weighted
KNN classifier (EDKC) and the kernel difference-weighted
KNN with Gaussian ERP kernel classifier (GEKC). Finally,
we evaluate the proposed methods on a pulse waveform
data set of five common pulse patterns, moderate, smooth,
taut, unsmooth,andhollow. This data set includes 2470
pulse waveforms, which is the largest data set used for pulse
waveform classification to the best of our knowledge. Exper-
imental results show that the proposed methods achieve an
average classification rate of 91.74%, which is higher than
those of several state-of-the-art approaches.
The remainder of this paper is organized as follows.
Section 2 introduces the main modules in pulse waveform
classification. Section 3 first presents a brief survey on
ERP and DFWKNN, and then proposes two novel ERP-
based classifiers. Section 4 provides the experimental results.
Finally, Section 5 concludes this paper.
2. The Pulse Waveform Classification Modules
Pulse waveform classification usually involves three modules:
a pulse waveform acquisition module, a preprocessing mod-
ule, and a feature extraction and classification module. The
pulse waveform acquisition module is used to acquire pulse
waveforms with satisfactory quality for further processing.
The preprocessing module is used to remove the distortions
of the pulse waveforms caused by noise and baseline wan-
der. Finally, using the feature extraction and classification
module, pulse waveforms are classified into different patterns
(Figure 1).
2.1. Pulse Waveform Acquisition. Our pulse waveform acqui-
sition system is jointly developed by the Harbin Institute
of Technology and the Hong Kong Polytechnic University.
The system uses a motor-embedded pressure sensor, an
amplifier, a USB interface, and a computer to acquire pulse
waveforms. During the pulse waveform acquisition, the
sensor (Figure 2(a)) is attached to wrist and contact pressure
is applied by the computer-controlled automatic rotation of
motors and mechanical screws. Pulse waveforms acquired by
the pressure sensors are transmitted to the computer through
the USB interface. Figure 2(b) shows an image of the scene of
the pulse waveform collection.
2.2. Pulse Waveform Preprocessing. In the pulse-waveform-
preprocessing, it is necessary to first remove the random
noise and power line interference. Moreover, as shown in
Figure 3(a), the baseline wander caused by factors such as
respiration would also greatly distort the pulse signal. We
use a Daubechies 4 wavelet transform to remove the noise
by empirically comparing the performance of several wavelet
functions and correct the baseline wander using a wavelet-
based cascaded adaptive filter previously developed by our
group [10].
Pulse waveforms are quasiperiodic signals where one or
afewperiodsaresufficient to classify a pulse shape. So we
adopt an automatic method to locate the position of the
onsets, split each multiperiods pulse waveform into several
single periods, and select one of these periods as a sample
of our pulse waveform data set. Figure 3(b) shows the result
of the baseline wander correction and the locations of the
onsets of a pulse waveform.
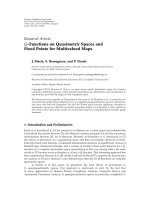
2.3. Feature E xtraction and Classification. TCPD recognizes
more than 20 kinds of pulse patterns which are defined
according to criteria such as shape, position, regularity, force,
and rhythm. Several of these are not settled issues in the
TCPD field but we can say that there is general agreement
that, according to the shape, there are five pulse patterns,
namely, moderate, smooth, taut, hollow, and unsmooth.
Figure 4 shows the typical waveforms of these five pulse
patterns acquired by our pulse waveform acquisition system.
All of these pulses can be defined according to the presence,
absence, or strength of three types of waves or peaks:
percussion (primary wave), tidal (secondary wave), and
dicrotic (triplex wave), which are denoted by P, T, and D,
respectively, in Figure 4. A moderate pulse usually has all
three types of peaks in one period, a smooth pulse has low
dicrotic notch (DN) and unnoticeable tidal wave, a taut pulse
frequently exhibits a high-tidal peak, an unsmooth pulse
exhibits unnoticeable tidal or dicrotic wave, and a hollow
EURASIP Journal on Advances in Signal Processing 3
(a) (b)
Figure 2: The pulse waveform acquisition system: (a) the motor embedded pressure sensor, and (b) the whole pulse waveform acquisition
system.
4
5
6
7
2500 3000 3500 4000 4500 5000 5500
Pulse waveform
Baseline
(a)
0
1
2
3
2500 3000 3500 4000 4500 5000 5500
Pulse waveform
Onset
(b)
Figure 3: Pulse waveform baseline wander correction: (a) pulse waveform distorted by baseline wander, and (b) pulse waveform after
baseline wander correction.
0
0.5
1
P
T
D
(a)
0
0.5
1
P
DN
D
(b)
0
0.5
1
(c)
0
0.5
1
(d)
0
0.5
1
(e)
Figure 4: Five typical pulse patterns classified by shape: (a) moderate, (b) smooth, (c) taut, (d) hollow, and (e) unsmooth pulse patterns.
pulse has rapid descending part in percussion wave and
unnoticeable dicrotic wave.
However, pulse waveform classification may suffer from
the problems of small inter class and large intraclass varia-
tion. As shown in Figure 5, moderate pulse with unnoticeable
tidal wave is similar to smooth pulse. For taut pulse, the tidal
wave sometimes becomes very high or even merges with the
percussion wave. Moreover, the factors such as local time
axis distortion would make the classification problem more
complicated.
So far, a number of pulse waveform classification
approaches have been proposed, which can be grouped into
4 EURASIP Journal on Advances in Signal Processing
two categories: the representation-based and the similarity
measure-based methods. The representation-based methods
first extract representative features of pulse waveforms using
techniquessuchasspatiotemporalanalysis[14], fast Fourier
transform (FFT) [12], and wavelet transform [13]. Then
the classification is performed in the feature space by using
various classifiers, for example, decision tree [22] and neural
network [18, 20, 21].
For the similarity measure-based methods, classification
is performed in the original data space by using certain
distance functions to measure the similarity of different pulse
waveforms. Our pulse waveform classification approaches
belong to the similarity measure-based method, where we
first propose an ERP-induced inner product and a Gaussian
ERP kernel, and then embed them into the DFWKNN and
KDFWKNN classifiers [26, 27]. In the following section, we
will introduce the proposed methods in detail.
3. The EDCK and GEKC Classifiers
In this section, we first provide a brief survey on related
work, that is, ERP, DFWKNN, and KDFWKNN. Then we
explain the basic ideas and implementations of the ERP-
based DFWKNN classifier (EDKC) and the KDFWKNN with
Gaussian ERP kernel classifier (GEKC).
3.1. Edit Distance with Real Penalty. The ERP distance is
a state-of-the-art elastic distance measure for time series
matching [25]. During the calculation of the ERP distance,
two time series, a
= [a
1
, , a
m
]withm elements and b =
[b
1
, , b
n
]withn elements, are aligned to the same length
by adding some symbols (also called gaps) to them. Then
each element in one time series is either matched to a gap or
an element in the other time series. Finally the ERP distance
between a and b, d
erp
(a, b), is recursively defined as
d
erp
(
a, b
)
=
⎧
⎪
⎪
⎪
⎪
⎪
⎪
⎪
⎪
⎪
⎪
⎪
⎪
⎪
⎪
⎪
⎨
⎪
⎪
⎪
⎪
⎪
⎪
⎪
⎪
⎪
⎪
⎪
⎪
⎪
⎪
⎪
⎩
m
i−1
a
i
− g
if n = 0,
n
i−1
b
i
− g
if m = 0,
min
⎧
⎪
⎪
⎪
⎪
⎨
⎪
⎪
⎪
⎪
⎩
d
erp
(
Rest
(
a
)
,Rest
(
b
))
+
|a
1
− b
1
|,
d
erp
(
Rest
(
a
)
, b
)
+
a
1
− g
,
d
erp
(
a,Rest
(
b
))
+
b
1
− g
,
⎫
⎪
⎪
⎪
⎪
⎬
⎪
⎪
⎪
⎪
⎭
, otherwise,
(1)
where Rest(a)
= [a
2
, , a
m
] and Rest(b) = [b
2
, , b
n
], |·|
denote the l
1
-norm, and g is a constant with a default value g
= 0[25]. From (1), one can see that the distance d
erp
(a, b)can
be derived by recursively calculating the ERP distance of their
subsequences until the length of one subsequence is zero.
By incorporating gaps in aligning time series of different
length, the ERP distance is very effective in handling the local
time shifting problem in time series matching. Besides, the
ERP distance satisfies the triangle inequality and is a metric
[25].
3.2. DFWKNN and KDFWKNN. DFWKNN and
KDFWKNN are two recently developed KNN classifiers
with classification performance comparable with or better
than several state-of-the-art classification methods [26].
Let X be a data set of n samples
{x
1
, , x
n
}, and the
corresponding class labels are
{y
1
, , y
n
} with each element
from
{ω
j
| j ∈ [1, ,c]},wherec denotes the number of
classes. For a test sample x,itsk-nearest neighbors from X
are found using the Euclidean distance to form a matrix
X
nn
= [x
nn
1
, , x
nn
k
]. In DFWKNN, the weights of the k-
nearest neighbors are defined as a vector w
= [w
1
, , w
k
]
T
,
which can be obtained by solving the following constrained
optimization problem:
w
= arg min
w
1
2
x − X
nn
w
2
subject to
k
i=1
w
i
= 1.
(2)
By defining the Gram matrix as
G
=
x − x
nn
1
, , x − x
nn
k
T
x − x
nn
1
, , x − x
nn
k
,(3)
the weight vector w can be obtained by solving Gw
= 1
k
,
where 1
k
is a k × 1 vector with all elements equal to 1. If the
matrix G is singular, there is no inverse of G and the solution
of w would be not unique. To avoid this case, a regularization
method is adopted by adding the multiplication of a small
value with the identity matrix, and the weight vector w can
be obtained by solving the system of linear equations:
G +
ηI
k
tr
(
G
)
k
w = 1
k
,(4)
where tr(G) is the trace of G, η
∈ [10
−3
∼ 10
0
]is
the regularization parameter, k is the number of nearest
neighbors of x,andI
k
is a k × k identity matrix. Finally,
using the weighted KNN rule, the class label ω
j
max
=
arg max
ω
j
(
y
nn
i
=ω
j
w
i
) is assigned to the sample x.
By defining the kernel Gram matrix, DFWKNN can be
extended to KDFWKNN. Using the feature mapping
F : x →
φ(x) and the kernel function κ(x, x
) =φ(x), φ(x
), the
kernel Gram matrix G
κ
is defined as
G
κ
=
φ
(
x
)
− φ
x
nn
1
, , φ
(
x
)
− φ
x
nn
1
T
×
φ
(
x
)
− φ
x
nn
1
, , φ
(
x
)
− φ
x
nn
1
.
(5)
In KDFWKNN, the weight vector w is obtained by solving
G
κ
+
ηI
k
tr
(
G
κ
)
k
w = 1
k
. (6)
For a detailed description of KDFWKNN, please refer to
[26].
3.3. The EDKC Classifier. Current similarity measure-based
methods usually adopt the simple nearest neighbor classifier.
EURASIP Journal on Advances in Signal Processing 5
0
0.5
1
(a)
0
0.5
1
(b)
0
0.5
1
(c)
0
0.5
1
(d)
0
0.5
1
(e)
Figure 5: Inter- and intraclass variations of pulse patterns: (a) a moderate pulse with unnoticeable tidal wave is similar to (b) a smooth
pulse; taut pulse patterns may exhibit different shapes, for example, (c) typical taut pulse, (d) taut pulse with high tidal wave, and (e) taut
pulse with tidal wave merged with percussion wave.
Input: The unclassified sample x, the training samples X ={x
1
, , x
n
} with the corresponding
class labels
{y
1
, , y
n
}, the regularization parameter η, and the number of nearest
neighbors k.
Output: The predicted class label ω
j
max
of the sample x.
Step 1. Use the ERP distance to obtain the k-nearest neighbors of the sample x ,
X
nn
= [x
nn
1
, , x
nn
k
], and their corresponding class labels [y
nn
1
, , y
nn
k
].
Step 2. Calculate the ERP-induced inner product of the samples x and each of its nearest
neighbors, k
erp
(i) =x, x
nn
i
erp
= (d
2
erp
(x, x
0
)+d
2
erp
(x
nn
i
, x
0
) − d
2
erp
(x, x
nn
i
))/2.
Step 3. Calculate the ERP-induced inner product of the k-nearest neighbors of sample x,
K
erp
(i, j) =x
nn
j
, x
nn
i
erp
.
Step 4. Calculate the self-inner product of the sample x,
x, x
erp
.
Step 5. Calculate G
erp
= K
erp
+ x, x
erp
1
kk
− 1
k
k
T
erp
− k
erp
1
T
k
.
Step 6. Calculate w by solving [G
erp
+ ηI
k
tr(G
erp
)/k]w = 1
k
.
Step 7. Assign the class label ω
j
max
= arg max
ω
j
(
y
nn
i
=ω
j
w
i
)tothesamplex.
Algorithm 1: EDKC.
The combination of similarity measure with advanced
KNN classifiers is expected to be more promising. So, by
using DFWKNN, we intend to develop a more effective
classifier, the ERP-based DFWKNN classifier (EDKC), for
pulse waveform classification. Utilizing the metric property
of the ERP distance, we first develop an ERP-induced inner
product, and then embed this novel inner product into
DFWKNN to develop the EDKC classifier.
Let
·, ·
erp
denote the ERP-induced inner product. Since
ERP is a metric. We can get the following heuristic deduction:
d
2
erp
(
x, x
)
=
x − x
, x − x
erp
=x, x
erp
+
x
, x
erp
− 2
x, x
erp
,
=⇒ d
2
erp
(
x, x
)
= d
2
erp
(
x, x
0
)
+ d
2
erp
(
x
, x
0
)
− 2
x, x
erp
,
(7)
where d
erp
(x, x
) is the ERP distance between x and x
,and
the vector x
0
represents a zero-length time series. Then the
ERP-induced inner product of x and x
can be defined as
follows:
x, x
erp
=
1
2
d
2
erp
(
x, x
0
)
+ d
2
erp
(
x
, x
0
)
− d
2
erp
(
x, x
)
. (8)
In (3), the element at the ith row and the jth column of
the Gram matrix G is defined as G
ij
=x − x
nn
i
, x − x
nn
j
,
where
·, · denotes the regular inner product. In EDKC,
we replace the regular inner product with the ERP-induced
inner product to calculate the Gram matrix G
erp
, which can
be rewritten as follows:
G
erp
= K
erp
+ x , x
erp
1
kk
− 1
k
k
T
erp
− k
erp
1
T
k
,(9)
where K
erp
is a k × k matrix with the element at ith row and
jth column K
erp
(i, j) =x
nn
i
, x
nn
j
erp
, k
erp
is a k × 1vector
with the ith element k
erp
(i) =x, x
nn
i
erp
,and1
kk
is a k × k
matrix of which each element equals 1.
Once we obtain the Gram matrix G
erp
, we can directly
use DFWKNN for pulse waveform classification by solving
the linear system of equations defined in (4). The detailed
algorithm of EDKC is shown as Algorithm 1.
3.4. The GEKC Classifier. The Gaussian RBF kernel [28]is
one of the most common kernel functions used in kernel
methods. Given two time series x and x
with the same length
n, the Gaussian RBF kernel is defined as
K
RBF
(
x, x
)
= exp
−
x − x
2
2
2σ
2
, (10)
where σ is the standard deviation. The Gaussian RBF kernel
requires that the time series should have the same length, and
it cannot handle the problem of time axis distortion. If the
length of two time series is different, resampling usually is
6 EURASIP Journal on Advances in Signal Processing
Table 1: Data set used in our experiments.
Pulse Moderate Smooth Taut Hollow Unsmooth To t a l
Number 800 550 800 160 160 2470
Table 2: The confusion matrix of EDKC.
Predicted
MSTHU
Actual
M 720 59 19 2 0
S 68 473 360
T 22 5 764 36
H 794139 1
U 11202136
required to normalize them to the same length before further
processing. Thus Gaussian RBF kernel usually is not suitable
for the classification of time series data.
Actually Gaussian RBF kernel can be regarded as an
embedding of Euclidean distance in the form of Gaussian
function. Motivated by the effectiveness of ERP, it is inter-
esting to embed the ERP distance into the form of Gaussian
function to derive a novel kernel function, the Gaussian
ERP (GERP) kernel. By this way, we expect that the GERP
kernel would be effective in addressing the local time shifting
problem and be more suitable for time series classification in
kernel machines. Given two time series x and x
, we define
the Gaussian ERP kernel function on X as
K
erp
(
x, x
)
= exp
−
d
2
erp
(
x, x
)
2σ
2
, (11)
where σ is the standard deviation of the Gaussian function.
We embed the GERP kernel into KDFWKNN by con-
structing the kernel Gram matrix G
κ
erp
defined as
G
κ
erp
= K
κ
erp
+ 1
kk
− 1
k
k
κ
erp
T
− k
κ
erp
1
T
k
, (12)
where K
κ
erp
is a k × k matrix with its element at ith row and
jth column
K
κ
erp
i, j
=
K
erp
x
nn
j
, x
nn
i
, (13)
and k
κ
erp
is a k × 1vectorwithitsith element
k
κ
erp
(
i
)
= K
erp
x, x
nn
i
. (14)
Once we have obtained the kernel Gram matrix G
κ
erp
,
we can use KDFWKNN for pulse waveform classification by
solving the linear system of equations defined in (6). The
details of the GEKC algorithm are shown as Algorithm 2.
4. Experimental Results
In order to evaluate the classification performance of EDKC
and GEKC, by using the device described in Section 2.1,we
construct a data set which consists of 2470 pulse waveforms
Table 3: The confusion matrix of GEKC.
Predicted
MSTHU
Actual
M 730 54 15 1 0
S 61 479 460
T 16 2 775 16
H 772143 1
U 01191139
Table 4: Comparison of different methods for pulse waveforms
classification with their accuracies achieved in recent literature.
Category Methods
Data set
Accuracy
Size Classes
Representation-
based
methods
DT-M4 [22]
372 3 92.2%
Wavele t Networ k
[23]
600 6 83%
Artificial Neural
Network [21]
63 3 73%
21 2 90%
Similarity
measure-based
methods
IDTW [19]
1000 5 92.3%
EDKC
2470 5 90.36%
GEKC
2470 5 91.74%
of five pulse patterns, including moderate (M), smooth (S),
taut (T), hollow (H), and unsmooth (U). All of the data
are acquired at the Harbin Binghua Hospital under the
supervision of the TCPD experts. All subjects are patients
in the hospital between 20 and 60 years old. Clinical data,
for example, biomedical data and medical history, are also
obtained for reference. For each subject, only the pulse signal
of the left hand is acquired, and three experts are asked to
determine the pulse pattern according to their pulse signal
and the clinical data. If the diagnosis results of the experts
are the same, the sample is kept in the data set, else it is
abandoned. Ta b le 1 lists the number of pulse waveforms of
each pulse pattern. To the best of our knowledge, this data
set is the largest one used for pulse waveform classification.
We make use of only one period from each pulse signal
and normalize it to the length of 150 points. We randomly
split the data set into three parts of roughly equal size and use
the 3-fold cross-validation method to assess the classification
performance of each pulse waveform classification method.
To reduce bias in classification performance, we adopt the
average classification rate of the 10 runs of the 3-fold cross-
validation. Using the stepwise selection strategy [26], we
choose the optimal values of hyperparameters k, η,andσ:
k
= 4, η = 0.01 for EDKC, and k = 31, η = 0.01, σ = 16
for GEKC. The classification rates of the EDKC and GEKC
classifiers are 90.36% and 91.74%, respectively. Tables 2 and 3
list the confusion matrices of EDKC and GEKC, respectively.
To provide a comprehensive performance evaluation of
the proposed methods, we compare the classification rates
of EDKC and GEKC with several achieved accuracies in the
recent literature [19, 21–23]. Ta bl e 4 lists the sizes of the
data set, the number of pulse waveform classes, and the
achieved classification rates of several recent pulse waveform
EURASIP Journal on Advances in Signal Processing 7
Input: The unclassified sample x, the training samples X ={x
1
, , x
n
} with the corresponding class
labels
{y
1
, , y
n
}, the regularization parameter η, the kernel parameter σ, and the number of
nearest neighbors k.
Output: The predicted class label ω
j
max
of the sample x.
Step 1. Use the ERP distance to obtain the k-nearest neighbors [x
nn
1
, , x
nn
k
]ofthesamplex,and
their corresponding class labels [y
nn
1
, , y
nn
k
].
Step 2. Calculate the GERP-induced inner product between samples x and each of its nearest
neighbors k
κ
erp
(i) = exp(−d
2
erp
(x, x
nn
i
)/2σ
2
).
Step 3. Calculate the GERP-induced inner product of the k-nearest neighbors of x
K
κ
erp
(i, j) = exp(−d
2
erp
(x
nn
j
, x
nn
i
)/2σ
2
).
Step 4. Calculate G
κ
erp
= K
k
erp
+ 1
kk
− 1
k
(k
κ
erp
)
T
− k
κ
erp
1
T
k
.
Step 5. Calculate w by solving [G
κ
erp
+ ηI
k
tr(G
κ
erp
)/k]w = 1
k
.
Step 6. Assign the class label ω
j
max
= arg max
ω
j
(
y
nn
i
=ω
j
w
i
)tothesamplex.
Algorithm 2: GEKC.
Table 5: The average classification rates (%) of different methods.
Pulse waveform 1NN-Euclidean 1NN-DTW 1NN-ERP Wavelet network [23]IDTW[19]EDKCGEKC
Moderate 86.11 82.44 88.31 87.23 87.31 89.94 91.25
Smooth 85.02 81.16 86.31 85.36 80.38 86.00 87.09
Taut 95.76 87.95 95.10 89.63 93.15 95.50 96.88
Hollow 86.75 82.44 87.56 85.63 80.44 86.88 89.38
Unsmooth 84.06 70.81 84.75 80.63 89.50 85.00 86.88
Average 87.36 83.19 89.79 87.08 88.90 90.36 91.74
classifiers, including improved dynamic time warping
(IDTW) [19], decision tree (DT-M4) [22], artificial neural
network [21], and wavelet network [23]. From Ta bl e 4,one
can see that GEKC achieves higher accuracy than wavelet
network [23] and artificial neural network [21]. Moreover,
although IDTW and DT-M4 reported somewhat higher
classification rates than our methods, the size of the data set
used in our experiments is much larger than those used in
these two methods, and DT-M4 is only tested on a 3-class
problem. In summary, compared with these approaches,
EDKC and GEKC are very effective for pulse waveform
classification.
To provide an objective comparison, we independently
implement two pulse waveform classification methods listed
in Ta ble 4, that is, IDTW [19] and wavelet network [23],
and evaluate their performance on our data set. The average
classification rates of these two methods are listed in Tab le 5 .
Besides, we also compare the proposed methods with several
related classification methods, that is, nearest neighbor with
Euclidean distance (1NN-Euclidean), nearest neighbor with
dynamic time warping (1NN-DTW), and nearest neighbor
with ERP distance (1NN-ERP). These results are also listed
in Ta bl e 5.FromTab le 5 , one can see that, our methods
outperform all the other methods in term of the overall
average classification accuracy.
5. Conclusion
By incorporating the state-of-the-art time series matching
method with the advanced KNN classifiers, we develop two
accurate pulse waveform classification methods, EDKC and
GEKC, to address the intraclass variation and the local
time shifting problems in pulse patterns. To evaluate their
classification performance, we construct a data set of 2470
pulse waveforms, which may be the largest data set yet
used in pulse waveform classification. The experimental
results show that the proposed GEKC method achieves an
average classification rate of 91.74%, which is higher than
or comparable with those of other state-of-the-art pulse
waveform classification methods.
One potential advantage of the proposed methods is to
utilize the lower bounds and the metric property of ERP
for fast pulse waveform classification and indexing [29]. In
our future work, we will further investigate accurate and
computationally efficient ERP-based classifiers for various
computerized pulse diagnosis tasks.
Acknowledgments
The paper is partially supported by the GRF fund from
the HKSAR Government, the central fund from the Hong
Kong Polytechnic University, the National S&T Major project
of China under Contract no. 2008ZXJ09004-035, and the
NSFC/SZHK innovation funds of China under Contracts
nos. 60902099, 60871033, and SG200810100003A.
References
[1] S. Z. Li, Pulse Diagnosis, Paradigm Press, 1985.
[2] H. Dickhaus and H. Heinrich, “Classifying biosignals with
wavelet networks: a method for nonivasive diagnosis,” IEEE
8 EURASIP Journal on Advances in Signal Processing
Engineering in Medicine and Biology Magazine,vol.15,no.5,
pp. 103–111, 1996.
[3] H. Adeli, S. Ghosh-Dastidar, and N. Dadmehr, “A wavelet-
chaos methodology for analysis of EEGs and EEG subbands to
detect seizure and epilepsy,” IEEE Transactions on Biomedical
Engineering, vol. 54, no. 2, pp. 205–211, 2007.
[4] H. Wang and Y. Cheng, “A quantitative system for pulse
diagnosis in traditional Chinese medicine,” in Proceedings of
the 27th Annual International Conference of the Engineering
in Medicine and Biology Society (EMBS ’05), pp. 5676–5679,
September 2005.
[5] S. E. Fu and S. P. Lai, “A system for pulse measurement
and analysis of Chinese medicine,” in Proceedings of the 11th
Annual International Conference of the IEEE Engineering in
Medicine and Biology Society, pp. 1695–1696, November 1989.
[6] J. Lee, J. Kim, and M. Lee, “Design of digital hardware system
for pulse signals,” Journal of Medical Systems,vol.25,no.6,pp.
385–394, 2001.
[7]W.Ran,J.I.Jae,andH.P.Sung,“Estimationofcentral
blood pressure using radial pulse waveform,” in Proceedings
of the International Symposium on Information Technology
Convergence (ISITC ’07), pp. 250–253, November 2007.
[8] R. Leca and V. Groza, “Hypertension detection using standard
pulse waveform processing,” in Proceedings of IEEE Instrumen-
tation and Measurement Technology Conference (IMTC ’05),
pp. 400–405, May 2005.
[9] C C. Tyan, S H. Liu, J Y. Chen, J J. Chen, and W M. Liang,
“A novel noninvasive measurement technique for analyzing
the pressure pulse waveform of the radial artery,” IEEE
Transactions on Biomedical Engineering, vol. 55, no. 1, pp. 288–
297, 2008.
[10] L. Xu, D. Zhang, and K. Wang, “Wavelet-based cascaded
adaptive filter for removing baseline drift in pulse waveforms,”
IEEE Transactions on Biomedical Engineering, vol. 52, no. 11,
pp. 1973–1975, 2005.
[11] C. Xia, Y. Li, J. Yan et al., “A practical approach to wrist
pulse segmentation and single-period average waveform esti-
mation,” in Proceedings of the 1st International Conference on
BioMedical Engineering and Informatics (BMEI ’08), pp. 334–
338, May 2008.
[12] H. Yang, Q. Zhou, and J. Xiao, “Relationship between vascular
elasticity and human pulse waveform based on FFT analysis
of pulse waveform with different age,” in Proceedings of the
International Conference on Bioinformatics and Biomedical
Engineering, pp. 1–4, 2009.
[13] Q L. Guo, K Q. Wang, D Y. Zhang, and N M. Li, “A
wavelet packet based pulse waveform analysis for cholecystitis
and nephrotic syndrome diagnosis,” in Proceedings of the
International Conference on Wavelet Analysis and Pattern
Recognition (ICWAPR ’08), pp. 513–517, August 2008.
[14] P Y. Zhang and H Y. Wang, “A framework for automatic
time-domain characteristic parameters extraction of human
pulse signals,” EURASIP Journal on Advances in Signal Process-
ing, vol. 2008, Article ID 468390, 9 pages, 2008.
[15] L. Xu, D. Zhang, K. Wang, and L. Wang, “Arrhythmic pulses
detection using Lempel-Ziv complexity analysis,” EURA SIP
Journal on Applied Signal Processing, vol. 2006, Article ID
18268, 12 pages, 2006.
[16] J J. Shu and Y. Sun, “Developing classification indices for Chi-
nese pulse diagnosis,” Complementary Therapies in Medicine,
vol. 15, no. 3, pp. 190–198, 2007.
[17] J. Allen and A. Murray, “Comparison of three arterial
pulse waveform classification techniques,” Journal of Medical
Engineering and Technology, vol. 20, no. 3, pp. 109–114, 1996.
[18] L. Xu, M. Q H. Meng, K. Wang, W. Lu, and N. Li,
“Pulse images recognition using fuzzy neural network,” Expert
Systems with Applications, vol. 36, no. 2, pp. 3805–3811, 2009.
[19] L. Wang, K Q. Wang, and L S. Xu, “Recognizing wrist pulse
waveforms with improved dynamic time warping algorithm,”
in Proceedings of the International Conference on Machine
Learning and Cybernetics
, pp. 3644–3649, August 2004.
[20] J. Lee, “The systematical analysis of oriental pulse waveform: a
practical approach,” Journal of Medical Systems,vol.32,no.1,
pp. 9–15, 2008.
[21] C. Chiu, B. Liau, S. Yeh, and C. Hsu, “Artificial neural
networks classification of arterial pulse waveforms in cardio-
vascular diseases,” in Proceedings of the 4th Kuala Lumpur
International Conference on Biomedical Engineering, Springer,
2008.
[22] H. Wang and P. Zhang, “A quantitative method for pulse
strength classification based on decision tree,” Journal of
Software, vol. 4, no. 4, pp. 323–330, 2009.
[23] L. S. Xu, K. Q. Wang, and L. Wang, “Pulse waveforms
classification based on wavelet network,” in Proceedings of
the 27th Annual International Conference of the Engineering
in Medicine and Biology Society (EMBS ’05), pp. 4596–4599,
September 2005.
[24]B.Yi,H.V.Jagadish,andC.Faloutsos,“Efficient retrieval of
similar time sequences under time warping,” in Proceedings
of the 14th International Conference on Data Engineering,pp.
201–208, February 1998.
[25] L. Chen and R. Ng, “On the marriage of Lp-norms and edit
distance,” in Proceeding of the 30th Very Large Data Bases
Conference, pp. 792–801, 2004.
[26] W. Zuo, D. Zhang, and K. Wang, “On kernel difference-
weighted k-nearest neighbor classification,” Pattern Analysis
and Applications, vol. 11, no. 3-4, pp. 247–257, 2008.
[27] M. R. Gupta, R. M. Gray, and R. A. Olshen, “Nonparametric
supervised learning by linear interpolation with maximum
entropy,” IEEE Transactions on Pattern Analysis and Machine
Intelligence, vol. 28, no. 5, pp. 766–781, 2006.
[28] B. Sch
¨
olkopf and A. J. Smola, Learning with Kernels, MIT Press,
Cambridge, Mass, USA, 2002.
[29] L. Chen, M. T. Ozsu, and V. Oria, “Robust and efficient
similarity search for moving object trajectories,” Tech. Rep.
CS-2003-30.