Báo cáo hóa học: " Research Article Adaptive Parameter Identification Based on Morlet Wavelet and Application in Gearbox Fault Feature Detection" pptx
Bạn đang xem bản rút gọn của tài liệu. Xem và tải ngay bản đầy đủ của tài liệu tại đây (2.69 MB, 10 trang )
Hindawi Publishing Corporation
EURASIP Journal on Advances in Signal Processing
Volume 2010, Article ID 842879, 10 pages
doi:10.1155/2010/842879
Research Article
Adaptive Parameter Identification Based on Morlet Wavelet and
Application in Gear box Fault Feature Detection
Shibin Wang, Z. K. Zhu, Yingping He, and Weiguo Huang
School of Urban Rail Transportation, Soochow University, Suzhou 215006, China
Correspondence should be addressed to Z. K. Zhu,
Received 26 July 2010; Accepted 22 October 2010
Academic Editor: T H. Li
Copyright © 2010 Shibin Wang et al. This is an open access article distributed under the Creative Commons Attribution License,
which permits unrestricted use, distribution, and reproduction in any medium, provided the original work is properly cited.
Localized defects in rotating mechanical parts tend to result in impulse response in vibration signal, which contain important
information about system dynamics being analyzed. Thus, parameter identification of impulse response provides a potential
approach for localized fault diagnosis. A method combining the Morlet wavelet and correlation filtering, named Cyclic Morlet
Wavelet Correlation Filtering (CMWCF), is proposed for identifying both parameters of impulse response and the cyclic period
between adjacent impulses. Simulation study concerning cyclic impulse response signal with different SNR shows that CMWCF is
effective in identifying the impulse response parameters and the cyclic period. Applications in parameter identification of gearbox
vibration signal for localized fault diagnosis show that CMWCF is effective in identifying the parameters and thus provides a
feature detection method for gearbox fault diagnosis.
1. Introduction
Rotating machines play an impor tant role in many industrial
applications, such as aircraft engines, automotive trans-
mission systems, and wind power generation. Most of the
machinery was operated by means of gears and other rotating
parts, which may develop faults. The study of fault diagnosis
of rotating machine by fault feature detection from vibration
signals has thus attracted more and more attention over the
past decade.
Gearbox, as an important mechanism for transmitting
power or rotation, is widely used in industrial applications.
The occurrence of impulse response in gearbox vibration
signals usually means that there exist mechanical defects or
faults. Most gear faults are due to gear damage, such as
tooth wear, cracks, scoring, spalling, chipping, and pitting
[1, 2]. With such flaws existing on gears, progressive damage
will occur and ultimately result in gear tooth breakage,
which may cause significant economic loss. For gearbox
fault diagnosis, therefore, it is very important to extract the
information of impulse response from vibration signals.
So far, different techniques have been proposed to
analyze the vibration signal for fault diagnosis, such as time-
frequency/time-scale methods, empirical mode decomposi-
tion (EMD), and matching pursuit (MP). Time-frequency
distribution is a three-dimensional time, frequency, and
amplitude representation of a signal, which is commonly
used to diagnose faults in mechanical systems because
the time-frequency distribution can accurately extract the
desired frequencies from a nonstationary signal [3–5]. The
time-frequency distributions are linear or bilinear. The
former includes the short time Fourier transform, which
provides constant resolution for all frequency since it uses the
same window for the analysis of the entire signal. The latter
includes the Wigner-Ville distribution, the Choi-Williams
distribution, and improved ones. There is no doubt that
the Wigner-Ville distribution has good concentration in the
time-frequency plane. However, even if support areas of the
signal do not overlap each other, interference terms will
appear to mislead the signal analysis. Time-scale methods
oftenrefertowavelettransform.Inwaveletanalysis,a
signal is analyzed at different scales or resolution: larger
time and smaller scale window is used to look at the
approximate stationarity of the signal and smaller time and
larger scale window at transients. Reference [6] summarizes
the application of the wavelet in machine fault diagnosis,
including the fault feature extraction, the denoising and
extraction of the weak signals, and the system identification.
2 EURASIP Journal on Advances in Signal Processing
EMD is an adaptive decomposition method proposed
by Huang et al. [7], which in essence extracts the intrinsic
oscillation of the signal being analyzed through their charac-
teristic time scales (i.e., local properties of the signal itself)
and decomposes the signal into a number of intrinsic mode
functions (IMFs), with each IMF corresponding to a specific
range of frequency components contained within the signal.
Because it still has some shortcomings when it comes to
calculating instantaneous frequency [8]orinsomecasesit
may reveal plausible characteristics due to the mode mixing
[9, 10], it is untenable in effective application in impulse
detection and analysis.
Matching pursuit algorithm, a greedy algorithm that
chooses a waveform that is the most adapted to approx-
imate part of the signal at each iteration, is effective in
analyzing impulse response signals; however, the excessive
computational cost limits its engineering applications [11].
Correlation filtering, enlightened from matching pursuit, is
used based on Laplace wavelet to identify the parameters
of impulse response by calculating the maximal correlation
value, which is employed by Freudinger et al. to identify
the modal parameters of a flutter for aerodynamic and
structur al testing [12]. Similar efforts were made by Zi
et al. for the identification of the natural frequency of a
hydrogenerator shaft and the wear fault diagnosis of the
intake valve of an internal combustion engine [13]. Qi et al.
employed Laplace wavelet correlation filter ing together with
empirical mode decomposition to identify modal parameters
[14]. An integrated approach, consisting of empirical mode
decomposition, Laplace wavelet correlation filtering, and
wavelet finite element model, proposed by Dong et al. for
rotor crack detection, was effective in identifying the position
and the depth of different cracks [15].
Laplace w avelet correlation filtering is effective in detect-
ing a single transient impulse response. However, localized
defects in rotating mechanical parts tend to result in mul-
tiple impulse responses, which are generally cyclic impulse
responses. Considering that the waveform of Morlet wavelet
is in shape similar to transient vibration caused by gearbox
localized defects [16, 17] and cyclostationarity matches the
key feature of the gearbox vibration [18, 19], Cyclic Morlet
Wavelet Cor relation Filtering (CMWCF) is thus proposed,
which, based on correlation filtering, constructs the cyclic
Morlet wavelet and identify both the impulse response
parameters and the cyclic period for diagnosed gear fault.
The remainder of the paper is organized as follows.
In Section 2, the basic theoretical background concerning
CMWCF is introduced. Section 3 gives a simulation study
and analysis to verify the proposed method. Section 4 applies
the method in gearbox transient feature detection by param-
eter identification for fault diagnosis. Finally, conclusions are
drawn in Section 5.
2. Adaptive Parameter Identification
Based on Morlet Wavelet
In this section, a method of adaptive parameter identification
of Morlet wavelet based on correlation filtering is presented.
Using correlation filtering, the parameters of Morlet wavelet
are firstly identified to detect the impulse response. Secondly,
cyclic Morlet wavelet is constructed to detect the cyclic
period between adjacent impulse responses. The proposed
method is suitable for not only identifying the parameters
of the impulse response but also detecting the cyclic period.
2.1. Morlet Wavelet and Parametric Representation. Morlet
wavelet is one of the most popular nonorthogonal wavelets,
defined in the time domain as a harmonic wave multiplied
by a Gaussian time domain window:
ψ
Morlet
(
t
)
= exp
−
β
2
t
2
2
cos
(
πt
)
. (1)
Morlet wavelet is a cosine signal that decays exponentially
on both the left and the right sides. This feature makes it very
similar to an impulse. It has been used for impulse isolation
and mechanical fault diagnosis [16, 17].
The parametric formulation of Morlet wavelet is
ψ
f , ζ,τ, t
=
ψ
γ
(
t
)
=e
(−ζ/
√
1−ζ
2
)[2πf(t−τ)]
2
cos
2πf
(
t −τ
)
,
(2)
where the parameter vector γ
= ( f , ζ,τ) determines the
wavelet properties. These parameters ( f , ζ,τ)aredenotedby
frequency f
∈ R
+
, damping ratio ζ ∈ [0, 1) ⊂ R
+
and time
index τ
∈ R,respectively.
The discrete parameters f , ζ,andτ belong to subsets of
F, Z,andT
C
,respectively:
F
=
f
1
, f
2
, , f
m
⊂
R
+
,
Z
=
ζ
1
, ζ
2
, , ζ
n
⊂
R
+
∩
[
0, 1
)
,
T
C
=
τ
1
, τ
2
, , τ
p
⊂
R.
(3)
The discrete grid Γ
= F × Z × T
C
is constructed, and the
set of the Morlet Wavelet, whose parameters are contained
in subsets of F, Z,andT
C
, is called the dictionary shown as
follows:
Ψ
=
ψ
γ
(
t
)
: γ
∈ Γ
=
ψ
f , ζ,τ, t
: f ∈ F, ζ ∈ Z, τ ∈ T
C
,
(4)
and each item in the dictionary is called an atom.
2.2. Correlation Filtering (CF). Correlation between two
signals describes their similarity to each other or, in gen-
eral term, their interrelationship. The degree of similarity
between two real certain signals with limited energy, ψ
γ
(t)
and x( t), can be measured in terms of a correlation
coefficient, defined as [20]
c
x(t)ψ
γ
(t)
=
C
x(t)ψ
γ
(t)
σ
x(t)
σ
ψ
γ
(t)
=
(
x
(
t
)
− x
)
ψ
γ
(
t
)
− ψ
γ
dt
(
x
(
t
)
− x
)
2
dt
ψ
γ
(
t
)
− ψ
γ
2
dt
,
(5)
where σ
x(t)
and σ
ψ
γ
(t)
are the standard deviations of the
vibr ation signal x(t) and the atom ψ
γ
(t), respectively, and
EURASIP Journal on Advances in Signal Processing 3
C
x(t)ψ
γ
(t)
is the covariance of x(t)andψ
γ
(t). In practice,
the signal x(t) and the atom ψ
γ
(t) are sampled as discrete
values; thus, the correlation coefficient is estimated from the
sampled data as
c
γ
=
N
k=1
(
x
(
k
)
− x
)
ψ
γ
(
k
)
− ψ
γ
N
k
=1
(
x
(
k
)
− x
)
2
N
k
=1
ψ
γ
(
k
)
− ψ
γ
2
,(6)
where N is the number of the data samples, and
x and ψ
γ
are
the mean values of x(k)andψ
γ
(k), respectively. Because of
the approximate zero mean property of the wavelet and the
vibration signal, (6) can be described as
c
γ
=
N
k=1
x
(
k
)
ψ
γ
(
k
)
N
k=1
x
2
(
k
)
N
k=1
ψ
2
γ
(
k
)
,(7)
where c
γ
is a multidimensional matrix, w hich is determined
by Γ
= F×Z×T
C
.Acorrelationcoefficient k
γ
(τ)isdefinedfor
modal analysis to correlate frequency and damping at each
time value. Peaks of c
γ
for a given τ relate the wavelet with the
strongest correlation to the signal. Define k
γ
(τ) as the peak
values of c
γ
at each τ. So, the formulation of k
γ
(τ)is
k
γ
(
τ
)
= max
f ∈F,ζ∈Z
c
γ
= c
{f ,ζ,τ}
,(8)
where
f and ζ are the characteristic parameters of the Morlet
wavelet associated with the peak correlation. Define
k
γ,max
= max
τ∈T
C
k
γ
(
τ
)
= max
f ∈F,ζ∈Z,τ∈T
C
c
γ
= c
{f ,ζ,τ}
,(9)
where
τ is the time of the peak value of c
γ
in the whole time
domain.
2.3. Cyclic Morlet Wavelet Correlation Filter ing (CMWCF).
According to the characteristics of vibration signal and the
identified Morlet wavelet ψ
γ
(t) through CF, in order to
determine the period, that is, time interval b etween two
adjacent impulse responses, we can define the cyclic Morlet
wavelet by introducing parameter T as
ϕ
λ
(
t
)
=
k
ψ
γ
(
t
− kT
)
=
k
Ae
(−ζ/
√
1−ζ
2
)[2πf(t−kT−τ)]
2
cos
2πf
(
t −kT − τ
)
,
(10)
where T is the time interval between two adjacent cyclic Mor-
let wavelet atoms, named cyclic period. Then, the parameter
vector λ
= ( f , ζ, τ, T) determines the cyclic Morlet wavelet
properties.
According to the characteristics of cyclic impulse
response, making use of the impulse response parameters
which is obtained from CF, the cyclic Morlet wavelet is
constructed to detect cyclic period. The set of the cyclic
Morlet wavelet, whose parameter is contained in the subset
of T
T
={T
1
, T
2
, , T
q
}⊂R
+
, is also called the dictionary
shown as
Φ
=
ϕ
T
(
t
)
: T
∈ T
T
=
ϕ
f , ζ,τ, T, t
: T ∈ T
T
, ( 11)
where
f , ζ,andτ are the parameters of impulse response
obtained from CF. Then, a correlation function k
T
(T)is
defined to quantify the correlation degree between ϕ
T
(t)and
x( t):
k
T
(
T
)
=
N
k=1
x
(
k
)
ϕ
T
(
k
)
N
k=1
x
2
(
k
)
N
k=1
ϕ
2
T
(
k
)
. (12)
Practically, k
T
(T) is a column vector, whose size is
determined by subset of T
T
.Define
k
T,max
= max
T∈T
T
k
T
(
T
)
= k
{f ,ζ,τ,T}
, (13)
where
T, associated with the maximum of k
T
,iscyclic period.
Then, both the parameters of Morlet wavelet and the
cyclic period between adjacent wavelet atoms are identified.
These identified parameters are associated with the impulse
responses. Finally, the procedure of the adaptive parameter
identification scheme proposed is summarized as follows:
(i) establish Morlet wavelet dic tionary;
(ii) find optimal Morlet wavelet using correlation filter-
ing based on maximal correlation coefficient crite-
rion;
(iii) construct cyclic Morlet wavelet given by (10)
obtained in step 2;
(iv) find cyclic period using CMWCF based on maximal
correlation coefficient criterion.
3. Simulation Signal Test
A simulation study is performed to illustrate the effect of the
CMWCF method. Consider a simulative signal
x
(
t
)
=
k
ψ
γ
(
t
− kT
)
+ A
n
n
(
t
)
=
k
e
(−ζ
0
/
√
1−ζ
2
0
)[2πf
0
(t−kT
0
−τ
0
)]
2
cos
2πf
(
t −kT
0
− τ
0
)
+ A
n
n
(
t
)
,
(14)
where the frequency f
0
= 5 Hz, the damping ratio ζ
0
= 0.01,
the time index τ
0
= 1 s, and the cyclic period T
0
= 2s.
Obviously, x(t) is a real periodic cyclic impulse responses
signal. The signal n(t) is white noise weight by A
n
= 0.2, and
the sampling frequency is 200 Hz in time range [0, 10].
The Morlet wavelet dictionary is adopted to analyze
the simulation signal. The grid of wavelet parameters is
determined according to the subsets of F
={4.5:0.01 :
5.5
}, Z ={{0.005 : 0.001 : 0.02}∪{0.03 : 0.05 : 0.9}},
T
C
={0:0.01 : 10},andT
T
={0.5:0.005 : 5},where
4 EURASIP Journal on Advances in Signal Processing
Table 1: The results of CMWCF when increasing the noise amplitude.
A
n
SNR (dB) k
γ,max
f (Hz) ζ τ (s) k
T,max
T (s)
0 ∞ 0.4472 5.00 0.010 5.00 1.0000 2.000
0.1 10.0120 0.4388 5.00 0.010 3.00 0.9522 2.000
0.2 3.9053 0.3947 5.00 0.010 5.00 0.8454 2.000
0.3 0.6009 0.3463 5.00 0.010 3.00 0.7427 2.000
0.4
−2.3101 0.2976 5.00 0.010 7.00 0.6253 2.000
0.5
−4.1144 0.2883 5.01 0.008 3.00 0.5378 2.000
0.6
−5.6627 0.2356 5.10 0.012 4.95 0.4167 2.000
0.7
−7.0026 0.2031 4.93 0.015 7.05 0.3846 1.995
0.8
−7.8508 0.2010 4.93 0.014 6.95 0.3676 1.995
0.9
−9.0012 0.1812 5.15 0.012 6.95 0.2688 2.010
1.0
−10.0057 0.1718 4.86 0.012 6.95 0.2851 1.990
1.1
−10.8197 0.1421 4.99 0.015 0.95 0.2802 2.000
1.2
−11.5463 0.1448 4.99 0.016 1.05 0.2695 2.000
Table 2: Success rate for detecting the cyclic period.
A
n
SNR (dB) Success rate A
n
SNR (dB) Success rate
0.1 10.0120 100% 0.7 −7.0026 85%
0.2 3.9053 96% 0.8
−7.8508 78%
0.3 0.6009 90% 0.9
−9.0012 78%
0.4
−2.3101 95% 1.0 −10.0057 81%
0.5
−4.1144 81% 1.1 −10.8197 80%
0.6
−5.6627 92% 1.2 −11.5463 77%
F ={4.5:0.01 : 5.5} is a Matlab notation which denotes
an array from 4.5 to 5.5 with step 0.01, and Z, T
C
,andT
T
are similar to F. The parameter subset of Z is nonuniform
to provide higher resolution at lower damping ratio values.
The results obtained by the proposed method from the
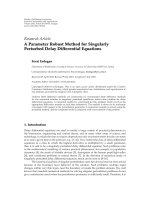
simulation signal are shown in Figure 1.
Figure 1(a) gives the waveform of the simulation sig-
nal without noise and Figure 1(b) with noise. Figure 1(c)
represents the correlation value k
γ
(τ), whose peak value
k
γ,max
= 0.3947 locates at one impulse. Figures 1(d) and 1(e)
indicate the modal information of frequency and damping
ratio parameters revealed from the peak correlation k
γ
(τ)at
each time τ. We obtained frequency
f = 5 Hz and damping
ratio
ζ = 0.01 w hich are exactly equal to simulation values
( f
0
= 5Hz, ζ
0
= 0.01). Because of the multi-impulse the
time index
τ = 5 s is not equal to τ
0
shown in Figure 1(c).
Using the results obtained by correlation filtering, the cyclic
Morlet wavelet is constructed. Then, the correlation value
k
T
(T), shown in Figure 1(f), is obtained by CMWCF, and
the cyclic period
T = 2 s associated with k
T,max
= 0.8454
is identified, which is also equal to the simulation value
(T
0
= 2s). Figure 1(g) gives the comparison between the
reconstructed cyclic Morlet wavelet with the obtained results
and the simulation signal. To see more clearly, we parallelly
move the curve of the reconstructed impulse response. The
consistency b etween them can be obviously seen, so it can be
drawn that the proposed method is effective in identifying
the cyclic period between adjacent impulses.
In order to test the noise tolerance of the method, the
simulation test with different noise amplitudes A
n
from (14)
is investigated shown in Table 1 , in which the results A
n
,SNR,
k
γ,max
, f , ζ, τ, k
T,max
,andT are listed. SNR, the signal-to-
noise ratio, is used to weigh the noise level and is defined as
follows:
SNR
= 10 × log
P
S
P
N
, (15)
where P
S
is the energy of the useful information and P
N
is
the energy of the noise.
It is clear that, with the increase of noise amplitude,
the correlation values k
γ,max
and k
T,max
decreased steadily,
illustrating that the noise reduces the correlation between the
simulation signal and Morlet wavelet. Meanwhile, the noise
amplitude influences the frequency
f , the damping ration ζ,
and the time
τ for A
n
> 0.4, but it has little influence on the
cyclic period. Table 2 gives the success rate of detecting the
cyclic period for randomized trial on 100 times.
4. Application in Gearbox Fault
Feature Detection
To study the effectiveness of the presented methods for the
gearbox fault feature detection, our experiment is concerned
with a fatigue test of an automobile tr ansmission gearbox.
The structure of the gearbox is shown in Figure 2, which has
five forward speeds and one backward speed. The vibration
signal was acquired by an accelerometer mounted on the
outer case of the gearbox when it is loaded with the third
speed gearbox.
EURASIP Journal on Advances in Signal Processing 5
012345678910
−1
0
1
Time (s)
A (m·s
−2
)
(a)
012345678910
−2
0
2
Time (s)
A (m·s
−2
)
(b)
012345678910
0
0.2
0.4
k
γ
(τ)
Time (s)
(c)
012345678910
4.5
5
5.5
f (Hz)
Time (s)
(d)
012345678910
0
0.01
0.02
ζ
Time (s)
(e)
0.5 1 1.5 2 2.5 3 3.5 4 4.5 5
0
0.5
1
k
T
(T)
Time (s)
T = 2s
(f)
012345678910
−4
−2
0
2
Time (s)
A (m·s
−2
)
(g)
Figure 1: CMWCF of the simulation signal: (a) the simulation signal, (b) the simulation signal with noise, (c) the correlation value of CF, (d)
frequency parameter
f , (e) damping ratio parameter ζ, (f) the correlation value of CMWCF, and (g) the comparison between the vibration
signal and reconstructed signal.
For a gear transmission, the meshing frequency f
m
is
calculated by
f
m
=
nz
(
60i
)
, (16)
where z is the number of gear teeth, n is the rotating speed of
the input shaft, and i is the transmission ratio. In the test, z
=
27, n = 1600 rpm, and i = 1.44. Then, the meshing frequency
of the third speed is calculated to be 500 Hz. The sampling
6 EURASIP Journal on Advances in Signal Processing
24
27
32
28
26
32
25
18
13
42
Third
speed
Forth
speed
First
speed
Second
speed
Reverse
speed
Fifth
speed
Input
shaft
Counter
shaft
Output
shaft
(a) Structure of the gearbox
(b) Gearbox setup
Figure 2: The automobile transmission gearbox.
Table 3: Working parameters of the third speed gears.
The third speed gears Constant meshing gears
Driving gear Driven gear Driving gear Driven gear
Numberofteeth 25272432
Rotating period (s) 0.05 0.054 0.04 0.03
Rotating frequency (Hz) 20 18.5 25 33.3
Meshing frequency (Hz) 500 640
frequency is 3 KHz. The working parameters are shown in
Table 3.
The typical vibr ation signal caused by one driving gear
teeth broken is shown in Figure 3(a). The time domain signal
fails to demonstrate the characteristic feature of the gearbox
vibration signal. Figure 3(b) expresses the corresponding
frequency spectrum, from which it can be seen that the
500 Hz in frequency is the main components. Figure 3(c)
gives the waveform of the correlation value k
γ
(τ)which
is the result of correlation filtering, in which the maximal
correlation value k
γ,max
= 0.3370 is marked. The associated
parameters are
f = 268 Hz, ζ = 0.0060, and τ = 0.1780 s.
In order to identify the cyclic period, the reconstructed
Morlet wavelet is used to construct cyclic Morlet wavelet.
The correlation coefficient k
T
between constructed cyclic
Morlet wavelet and the vibration signal under different
parameter period T is given in Figure 3(d), in which the
maximal correlation value k
T,max
= 0.5711 is marked and
the corresponding period is
T = 0.050 s. The comparison
between the reconstructed cyclic Morlet wavelet and the
EURASIP Journal on Advances in Signal Processing 7
0
0.02 0.04 0.06 0.08 0.1 0.12 0.14 0.16 0.18 0.2
−20
0
20
Time (s)
A (m·s
−2
)
(a)
0 500 1000 1500
0
500
1000
Frequency (Hz)
PSD (m
2
·s
−3
)
(b)
Time (s)
0 0.02 0.04 0.06 0.08 0.1 0.12 0.14 0.16 0.18 0.2
0
0.2
0.4
k
γ
(τ)
(c)
Time (s)
0.01 0.02 0.03 0.04 0.05 0.06 0.07 0.08 0.09 0.1
0
0.5
k
T
(T)
T = 0.05 s
(d)
Time (s)
0 0.02 0.04 0.06 0.08 0.1 0.12 0.14 0.16 0.18 0.2
−40
−20
0
20
(e)
Figure 3: The CMWCF application in gearbox vibration: (a) the gearbox vibration signal, (b) the spe ctrum of the gearbox vibration, (c) the
correlation value of CF, (d) the correlation value of CMWCF, and (e) the comparison of the vibration signal and reconstructed signal.
original vibration signal is given in Figure 3(e), in which,
to see more clearly, the curve of the reconstructed one
is also parallelly moved. Obviously, as shown in Tabl e 2,
the identified cyclic period is consistent with the rotating
period of the third speed dr iving gear. T hat is to say, the
proposed method is effective in identifying the characteristic
parameters.
To prove the tolerance of the proposed method, Figure 4
gives another signal whose length is different and the results
include k
γ,max
= 0.2877, f = 275Hz, ζ = 0.0080, τ =
0.2310 s, k
T,max
= 0.4327, and T = 0.050 s. These identified
parameters are almost identical to the result of Figure 3.
Furthermore, in addition to illustrate the effectiveness
of the proposed method, Figure 5 gives the vibration
signal on normal condition, in which k
γ,max
= 0.1187
and k
T,max
= 0.1236 are represented and smaller than
results of Figures 3 and 4. It is illustrated that there
is no apparent impulse response in the vibration signal.
8 EURASIP Journal on Advances in Signal Processing
0 0.05 0.1 0.15 0.2 0.25 0.3
Time (s)
−20
0
20
A (m·s
−2
)
(a)
0 500 1000 1500
0
500
Frequency (Hz)
1500
PSD (m
2
·s
−3
)
(b)
0 0.05 0.1 0.15 0.2 0.25 0.3
Time (s)
0
0.2
0.4
k
γ
(τ)
(c)
Time (s)
0.01 0.02 0.03 0.04 0.05 0.06 0.07 0.08 0.09 0.1
0
k
T
(T)
0.5
T = 0.05 s
(d)
0 0.05 0.1 0.15 0.2 0.25 0.3
Time (s)
−20
0
20
(e)
Figure 4: The CMWCF application in gearbox vibration: (a) the gearbox vibration signal, (b) the spe ctrum of the gearbox vibration, (c) the
correlation value of CF, (d) the correlation value of CMWCF, and (e) the comparison of the vibration signal and reconstructed signal.
Though the impulse response was reconstructed and given
in Figure 5(e), it can be clearly observed that the comparison
with the original signal is unaccountable. So it can be drawn
that there is no cyclic impulse response in the vibration
signal on normal condition. In other words, it can be
drawn that there is no localized defect in the gearbox,
and this also verifies the effectiveness of the proposed
method.
EURASIP Journal on Advances in Signal Processing 9
0
0.02 0.04 0.06 0.08 0.1 0.12 0.14 0.16 0.18 0.2
−20
0
20
Time (s)
A (m·s
−2
)
(a)
0 500 1000 1500
0
1000
Frequency (Hz)
2000
PSD (m
2
·s
−3
)
(b)
Time (s)
0 0.02 0.04 0.06 0.08 0.1 0.12 0.14 0.16 0.18 0.2
0
k
γ
(τ)
0.05
0.1
(c)
Time (s)
0.01 0.02 0.03 0.04 0.05 0.06 0.07 0.08 0.09 0.1
0
k
T
(T)
0.1
0.2
(d)
Time (s)
0 0.02 0.04 0.06 0.08 0.1 0.12 0.14 0.16 0.18 0.2
−40
−20
0
20
(e)
Figure 5: The CMWCF application in gearbox vibration: (a) the gearbox vibration signal, (b) the spe ctrum of the gearbox vibration, (c) the
correlation value of CF, (d) the correlation value of CMWCF, and (e) the comparison of the vibration signal and reconstructed signal.
5. Conclusions
The cyclic Morlet wavelet correlation filtering (CMWCF)
method proposed represents an attempt in the direction of
parameter identification and feature detection for fault diag-
nosis. Both the parameters of the Morlet wavelet associated
with the maximal correlation value and the cyclic period are
effective in feature detection of the impulse response.
The simulation study demonstrates that the proposed
method is effective in identifying parameters of impulse,
including frequency, damping ratio, and the time index,
and is especially sensitive to the cyclic period. The gearbox
application also demonstrates the fact that the method has
the capability of parameter identification.
In conclusion, the other gearbox applications have not
yet been provided in the paper; however, it conforms that
CMWCF provides a feature detection method for gearbox
fault diagnosis. Furthermore, the method has the potential
applicability for monitoring other rotating mechanical com-
ponents such as bearings and rotors.
10 EURASIP Journal on Advances in Signal Processing
Acknowledgments
This research is supported partly by the Natural Science
Foundation of China (no. 50905021) and the Natural Science
Foundation of Jiangsu Province (no. BK2010225).
References
[1] Z. Feng, M. J. Zuo, and F. Chu, “Application of regularization
dimension to gear damage assessment,” Mechanical Systems
and Signal Processing, vol. 24, no. 4, pp. 1081–1098, 2010.
[2] P. D. Samuel and D. J. Pines, “A review of vibr ation-based
techniques for helicopter transmission diagnostics,” Journal of
Sound and Vibration, vol. 282, no. 1-2, pp. 475–508, 2005.
[3] B. Leprettre and N. Martin, “Extraction of pertinent subsets
from time-frequency representations for detection and recog-
nition purposes,” Signal Processing, vol. 82, no. 2, pp. 229–238,
2002.
[4] M. Bl
¨
odt, M. Chabert, J. Regnier, and J. Faucher, “Mechanical
load fault detection in induction motors by stator current
time-frequency analysis,” IEEE Transactions on Industry Appli-
cations, vol. 42, no. 6, pp. 1454–1463, 2006.
[5] E. G. Strangas, S. Aviyente, and S. S. H. Zaidi, “Time-
frequency analysis for efficient fault diagnosis and failure
prognosis for interior permanent-magnet AC motors,” IEEE
Transactions on Industrial Electronics, vol. 55, no. 12, pp. 4191–
4199, 2008.
[6] Z. K. Peng and F. L. Chu, “Application of the wavelet transform
in machine condition monitoring and fault diagnostics: a
review with bibliography,” Mechanical Systems and Signal
Processing, vol. 18, no. 2, pp. 199–221, 2004.
[7] N. E. Huang, Z. Shen, S. R. Long et al., “The empirical mode
decomposition and the Hubert spectrum for nonlinear and
non-stationar y time series analysis,” Proceedings of the Royal
Society A, vol. 454, no. 1971, pp. 903–995, 1998.
[8] Y. Wang, Z. He, and Y. Zi, “Enhancement of signal denoising
and multiple fault signatures detecting in rotating machinery
using dual-tree complex wavelet transform,” Mechanical Sys-
tems and Signal Processing, vol. 24, no. 1, pp. 119–137, 2010.
[9] Q. Gao, C. Duan, H. Fan, and Q. Meng, “Rotating
machine fault diagnosis using empirical mode decomposi-
tion,” Mechanical Systems and Signal Processing,vol.22,no.5,
pp. 1072–1081, 2008.
[10] Y. Lei, Z. He, and Y. Zi, “Application of the EEMD method
to rotor fault diagnosis of rotating machinery,” Mechanical
Systems and Signal Processing, vol. 23, no. 4, pp. 1327–1338,
2009.
[11] S. G. Mallat and Z. Zhang, “Matching pursuits with time-
frequency dictionaries,” IEEE Transactions on Signal Process-
ing, vol. 41, no. 12, pp. 3397–3415, 1993.
[12] L. C. Freudinger, R. Lind, and M. J. Brenner, “Correlation
filtering of modal dynamic using the Laplace wavelet,” in
Proceedings of the 16th International Modal Analysis Conference
(IMAC ’98), vol. 2, pp. 868–877, Santa Barbara, Calif, USA,
February 1998.
[13] Y. Zi, X. Chen, Z. He, and P. Chen, “Vibration based modal
parameters identification and wear fault diagnosis using
Laplace wavelet,” Key Engineering Materials, vol. 293-294, pp.
183–190, 2005.
[14] K. Qi, J. Xiang, Y. Zi, and Z. He, “High precision modal
parameter identification based on Laplace wavelet correlation
filtering,” Chinese Journal of Mechanical Engineering, vol. 43,
no. 9, pp. 167–172, 2007.
[15] H. B. Dong, X. F. Chen, B. Li, K. Y. Qi, and Z. J. He, “Rotor
crack detection based on high-precision modal parameter
identification method and wavelet finite element model,”
Mechanical Systems and Signal Processing,vol.23,no.3,pp.
869–883, 2009.
[16] J. Lin and L. Qu, “Feature extraction based on morlet wavelet
and its application for mechanical fault diagnosis,” Journal of
Sound and Vibration, vol. 234, no. 1, pp. 135–148, 2000.
[17] J. Lin and M. J. Zuo, “Gearbox fault diagnosis using adaptive
wavelet filter,” Mechanical Systems and Signal Processing, vol.
17, no. 6, pp. 1259–1269, 2003.
[18] Z. K. Zhu, Z. H. Feng, and F. R. Kong, “Cyclostationarity
analysis for gearbox condition monitoring: approaches and
eff
ectiveness,” Mechanical Systems and Signal Processing, vol.
19, no. 3, pp. 467–482, 2005.
[19] A. Raad, J. Antoni, and M. Sidahmed, “Indicators of cyclo-
stationarity: theory and application to gear fault monitoring,”
Mechanical Systems and Signal Processing,vol.22,no.3,pp.
574–587, 2008.
[20] J. S. Bendat and A. G. Piersol, Random Data: Analysis and
Measurement Procedures, John Wiley & Sons, New York, NY,
USA, 3rd edition, 2000.