Báo cáo hóa học: " Research Article Neural Mechanisms of Motion Detection, Integration, and Segregation: From Biology to Artificial Image Processing Systems" docx
Bạn đang xem bản rút gọn của tài liệu. Xem và tải ngay bản đầy đủ của tài liệu tại đây (6.05 MB, 22 trang )
Hindawi Publishing Corporation
EURASIP Journal on Advances in Signal Processing
Volume 2011, Article ID 781561, 22 pages
doi:10.1155/2011/781561
Research Article
Neural Mechanisms of Motion Detection, Integration, and
Segregation: From Biology to Artificial Image Processing Systems
Jan D . Bouecke,
1
Emilien Tlapale,
2
Pierre Kornprobst,
2
and Heiko Neumann
1
1
Faculty of Engineering and Computer Sciences, Institute for Neural Information Processing, Ulm University, James-Franck-Ring,
89069 Ulm, Germany
2
Equipe Projet NeuroMathComp, Institut National de Recherche en Informatique et en Automatique (INRIA),
Unit
´
e de recherche INRIA Sophia Antipolis, Sophia Antipolis Cedex, 06902, France
Correspondence should be addressed to Heiko Neumann,
Received 15 June 2010; Accepted 2 November 2010
Academic Editor: Elias Aboutanios
Copyright © 2011 Jan D. Bouecke et al. This is anopen access article distributed under the Creative Commons Attribution License,
which permits unrestricted use, distribution, and reproduction in any medium, provided the original work is properly cited.
Object motion can be measured locally by neurons at different stages of the visual hierarchy. Depending on the size of their
receptive field apertures they measure either localized or more global configurationally spatiotemporal information. In the visual
cortex information processing is based on the mutual interaction of neuronal activities at different levels of representation and
scales. Here, we utilize such principles and propose a framework for modelling neural computational mechanisms of motion in
primates using biologically inspired principles. In particular, we investigate motion detection and integration in cortical areas
V1 and MT utilizing feedforward and modulating feedback processing and the automatic gain control through center-surround
interaction and activity normalization. We demonstrate that the model framework is capable of reproducing challenging data
from experimental investigations in psychophysics and physiology.Furthermore,themodelisalsodemonstratedtosuccessfully
deal with realistic image sequences from benchmark databases and technical applications.
1. Introduction and Motivation
A key visual competency of many species, including humans,
is the ability to rapidly and accurately ascertain the sizes,
locations, trajectories, and identities of objects in the envi-
ronment. For example, noticing a deer moving behind a
thicket, or steering around obstacles through a crowded
environment, indicates that many of the tasks of vision serve
as a basis to guide behaviour based on the spatiotemporally
changing visual input. The analysis and interpretation of
moving objects based on motion estimations is thus a
major task in everyday vision. However, motion can locally
be measured only orthogonal to an extended contrast
(aperture problem), while this ambiguity can be resolved at
localized image features, such as corners or junctions from
nonoccluding geometrical configurations. Several models
have been suggested that focus on the problem of how
to integrate localized and mostly ambiguous local motion
estimates. For example, the vector sum approach averages
movement vectors measured for a coherent shape [1]. Local
motion signals of an object define a subspace of possible
motion interpretations, namely, the so-called motion con-
straint equation (MCE; [2]). If several distinct measures are
combined, their associated constraint lines in the velocity
space intersect and thus yield the velocity common to the
individual measures (intersection of constraints, IOC) [3, 4].
Bayesian models combine different probabilities for veloci-
ties and combine these estimates with statistical priors which
often prefer slower motions [5, 6] (Simoncelli [7]). Like
for the IOC, Bayesian models mostly assume that motion
estimates belonging to distinct objects were already grouped
together. Unambiguous motion signals can be measured at
locations of significant 2D image structure such as curvature
maxima, corners, or junctions. These sparse features can
be tracked over several frames to yield robust movement
estimates and predictions (feature tracking) [8]. Coherent
motion is often computed by utilizing an optimization
approach in which the solution is searched given a set of
measurements that minimizes the distance to the constraint
lines in a least squares sense [4]. Other approaches utilize
2 EURASIP Journal on Advances in Signal Processing
Dorsal pathway motion
PFC
MT
MST
STS
V4
V2
V1
TE/TEO
Ve n t r a l p a thw ay form
MSTv MSTd
MST
MT
V1
V2
V4
Input
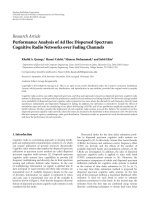
Figure 1: Structure of the organization of the visual cortical architecture with its areas and interconnections. The entry stage for cortical
visual processing is in area V1, the primary visual cortex. Feature processing along ascending pathways (blue arrows) proceeds along two
roughly segregated pathways, namely, the dorsal and the ventral pathway, respectively. While the processing along the ventral path is mostly
devoted to shape and form (WHAT system), the dorsal path is mostly concerned with motion processing (WHERE system). Areas higher up
in the hierarchy send feedback connections along descending pathways (red arrows) to influence the activation distributions at earlier stages
in the hierarchy. The scheme of interactive processing between different areas has been sketched on the right in a box-and-arrow scheme.
The different arrows indicate the signal flow between the different boxes, namely, areas, in the layout. Several cortical areas are highlighted
here to allow an association with major cortical areas and also the cross-reference between the brain sketch on the left and the box picture
on the right (V1: primary visual cortex; MT: medial temporal; MST: medial superior temporal (with v and d denoting the ventral and dorsal
subdivisions, resp.); PFC: prefrontal cortex; V2: secondary visual area; V4: visual area 4; TE/TEO: areas in inferior temporal cortex; STS:
superior temporal sulcus).
a priori models that impose smoothness upon the set of
possible solutions of the desired flow field in homogeneous
regions [2, 9] or along surface boundaries [10].
Here, we investigate a different route by studying the
mechanisms of the primate visual system to process visual
motion induced by moving objects or self-motion. Motion
information is primarily processed along the dorsal pathway
in the visual system, but mutual interactions exist at different
stages between the dorsal and ventral pathways [11]. As
outlined in Figure 1 the different pathways are instantiated
by a hierarchy of interacting areas with different functional
competencies which is exemplified by the box-and-arrow
conceptualization in the right part of the sketch. In this
paper, we will focus on the integration and segregation of
visual motion in reciprocally connected areas V1 and MT by
proposing a dynamical model to provide a simple framework
for 2D motion integration. We utilize a simple set of compu-
tational properties that are common in biological architec-
tures. We consider feedforward and feedback connectivities
between layered representation of cells operating at differ-
ent scales or spatial resolutions. Low-level cues for visual
surface properties can be combined with representations at
a more global scale that incorporates context information
and knowledge by reentering activity from representations
higher up in the processing hierarchy to selectively modulate
or bias the computations at the lower scales. Despite its
simplicity, the model is able to explain experimental data
and, without parameter changes, to successfully process real-
world data used for model benchmarking [12, 13]. In all,
the paper summarizes some previous work of the authors,
namely, work of [14–17] by using a common framework
of model description. Most importantly, the framework has
been extended such that different neural interaction schemes
canbeutilizedindifferent variants of the model. This
development allows relating the modelling framework to
recent proposals concerning normalization mechanisms in
vision to account for nonlinearities in processing as observed
in different cortical areas (e.g., [18]).
The paper is organized as follows. In Section 2 we outline
the approach to neural modelling based on the population
level of neuronal activity and gradual activation dynamics.
Section 3 is built upon the general modelling framework and
describes the neural model of motion estimation. Readers
who are interested primarily in the motion model but not
in the general modelling framework might skip Section 2
and proceed directly to Section 3.InSection 4 we present
various simulation results that highlight the neural principles
used for motion computation. A discussion of the major
contributions and relations to previous work is presented
in Section 5. The paper concludes with a brief summary in
Section 6.
2. Neural Modeling Approach
2.1. Neurodynamics and Notational Formats. The basic
processing units in biological information processing are
individual neurons. In cortical areas they are organized into
different areas each of which shows a typical layering. Corti-
cal areas are organized into six layers which are characterized
EURASIP Journal on Advances in Signal Processing 3
by cell clustering, their lateral interconnectivities, and the
major terminations of input and output fiber projections.
The transmission of activity in neurons is denoted in terms
of potential changes across the membrane of a cell. Single
cell dynamics can be described at various levels of detail,
for example, at the level of multicompartments, as a single
compartment entity or as a cascade model ([19]; see their
Figure 1). Here, we utilize single compartment models of
neurons, which are essentially point-like representations of a
neuron neglecting influences from widespread dendrites and
related nonlinear interactions. The membrane acts both as
a resistor (that blocks ions of different types to freely pass
across the barrier) and as a capacitance to build a charge
at both sides of the membrane. Without any input current
the cell membrane is in a state of dynamic equilibrium
in which currents are flowing across the membrane that
balance each other, resulting in zero net current flow. Gates
that have constant or activity dependent conductances allow
different amounts of ions passing the membrane to change
its potential. A simple description of a piece of membrane
takes into account the conductance C, the resistance R,
and the resting potential v, resembling an RC circuit. By
applying Kirchhoff ’s laws we can specify the dynamics of the
membrane potential (voltage) given arbitrary input currents.
If we take into account excitatory and inhibitory synaptic
inputs that are delivered by fast chemical synapses, then
the respective synaptic currents need to be incorporated in
the dynamic voltage equation. This leads to the following
dynamics:
τ
dv
(
t
)
dt
=−v
(
t
)
+R ·g
ex
·
(
E
ex
−v
(
t
))
+R ·g
in
·
(
v
(
t
)
−E
in
)
,
(1)
where τ
= RC defines the membrane constant, g
ex
and g
in
denote time-varying and input dependent membrane con-
ductances (separate for excitatory and inhibitory synapses,
resp.), and E
ex
and E
in
denote saturation points defining
the respective reversal battery potentials. If the net effect of
synaptic inputs causes a depolarization of the cell exceeding
a certain threshold level, then the cell emits a spike. This
behaviour has been captured in simplified models of leaky
integrate-and-fire (LIF) models [20]. The spatiotemporal
signature of spiking response pattern of groups of neurons is
believed to provide the neural code for sensory processing.
While we believe that the temporal dimension of spiking
behaviour is important to achieve robust feature integration
of patterns in a distributed fashion (see, e.g., [21, 22]), we
focus here on the average behaviour of neurons or groups of
neurons. The model neurons investigated here consider the
(average) firing rate to encode the strength and significance
of input stimuli along their feature dimensions.
Grossberg [23] summarized and unified various propos-
als to describe the neural response properties by using a
generalized notation of the membrane equation, namely,
τ
dv
(
t
)
dt
=−A ·v
(
t
)
+
(
B − C ·v
(
t
))
·net
ex
−
(
D + E
·v
(
t
))
·net
in
,
(2)
which is the basis for the notational format used in this
contribution. Here the constant A denotes the rate of passive
activity decay when the external input is switched off.The
introduction of parameters B and D allows transforming
parts of this generic equation into additive components by
eliminating the shunts, such as in the case of additive center-
surround interactions.
Saturation properties can be investigated by the steady-
state solution of (2) (for simplicity, we assume here that the
net input is generated by feedforward signals). We get
v
∞
=
B · net
ex
−D ·net
in
A + C ·net
ex
+ E ·net
in
. (3)
The limits for increasing excitatory input by pushing its
activity to infinity determine an upper bound v
↑
(t) = B/C,
while increasing the inhibitory input approaches a lower
bound, v
↓
(t) =−D/E. This property establishes a bounded
input/bounded output property for the activation of a model
cell (or group of model cells).
We can also assess the activation properties in standard
operation conditions when the activation is far from satura-
tion points and the input is in moderate range (for simplicity
we assume constant settings for parameters C and E,namely,
C
= E = 1). Closer inspection of (2) shows that the
conductance changes for excitatory and inhibitory inputs,
respectively, are approximately linear. To put it differently,
under the conditions outlined the approximate conditions
B
− v(t) ≈ c
ex
and D + v(t) ≈ c
in
hold. As a consequence,
(2) simplifies to the following linear equation:
τ
dv
(
t
)
dt
=−A ·v
(
t
)
+ c
ex
·net
ex
−c
in
·net
in
(4)
under these conditions. Equation (4) demonstrates that the
rate of change in response is governed by an approximately
linear property and saturates for increased steady input.
2.2. Cascade Architecture and Description of Gene ric Cortical
Processing Stages. Our modelling of neural mechanisms
(functionality) and their interaction is motivated by prin-
ciple findings of electrophysiology, anatomical studies, and
theories of information processing of macaque monkey’s
brain. We follow the principle that mechanisms of neural
processing are distributed and hierarchically organized in
different areas of visual cortex which are partly bidirectional
connected. Van Essen and Gallant [11] identified numerous
visual and visually associated areas with significant con-
nectivity. A second principle states that each visual area
adds a specific type of functionality like the extraction of a
(task relevant) feature. We consider several interconnected
visual areas that are included in the model. In previous
work,onwhichthisresearchisbased,severalareasare
considered that are relevant to the given visual task. For
example, a grouping mechanism that has been proposed to
enable the enhancement and extraction of oriented visual
structure mainly involves the first two stages along the ventral
pathway, namely, cortical areas V1 and V2 [24]. In a similar
fashion, texture boundary detection has been investigated
involving areas V1, V2, and V4 [25–27] again using the same
4 EURASIP Journal on Advances in Signal Processing
1
Driving input
1
+
×
Excitatory
feedback
Modulation signal
FF
↓ FB→
0
a
0
0
a
b
0
a+ab
3
−
.
.
.
Normalization
2
Figure 2: Three-stage cascade of dynamical processing stages used to determine the activation level of cells in one model area. Stage 1
(left) pools the bottom-up input signal by a filter mechanism that implements the respective cells’ receptive field properties. The resulting
activity is fed forward through the next stages of the cascade. Stage 2 (middle) realizes a multiplicative feedback interaction from higher
model areas to modulate the initial activation from the filtering stage. This mechanism implements a linking strategy in which the feeding
input is required to drive the response, while feedback signals can only modulate the driving input. Feedback cannot by itself generate any
new activation. On the other hand, the lack of feedback does not lead to the extinction of activities along the feedforward path such that
these activities are left unchanged. In Stage 3 (right) the top-down modulated activity undergoes a stage of shunting on-center/off surround
competition over a neighborhood in the spatial and feature domain.
connection and interaction structure. Here, we investigate
the analysis of visual motion, again based on the interaction
of several areas, but now along the dorsal pathway. The
details will be explained in Section 3.
In cortex, anatomically different structures and intercon-
nections can be distinguished in six layers. These layers con-
tribute to realize the computational function of a given area.
We employ a simplified, thus more abstract, description of
the layered architecture at each cortical stage, or area. In the
model, we emphasize key principles of interactive processes
that make three different hierarchically organized stages. In
particular, we suggest a generic three-level processing cascade
that is motivated by layered processing within visual cortex
which is sketched in Figure 2.
Before specifying details of the different stages of the
model architecture, we like to emphasize the functional logic
of the cascade. Assume that the initial stage of processing,
or filtering, generates a representation with the driving input
activation (stage 1 of Figure 2). Now consider the output of
the cascade which generates a normalized representation of
activities (stage 3). Such normalization, in a nutshell, keeps
the overall energy in the local region mainly constant, so
that individual activities balance their activation against the
other activities in a region of the visual field that is covered
by the neighbourhood in space and feature domain under
consideration. Now consider the function of modulatory
feedback (stage 2). If the activity at a given position in space
and feature domain is enhanced by excitatory feedback, then
the activity is increased by a component that is proportional
to the correlation between feeding input and the modulatory
feedback signal amplitude. If no feedback is present, the
driving input is left unchanged. Now, reconsider the final
stage of normalizing the activity in the pool of cells. Since this
mechanism tends to keep the total energy within limits, any
prior amplification will, in turn, inhibit those cells and their
activation that have not received any input via modulatory
feedback signals. Thus, the net effect of modulatory signal
enhancement and subsequent competition implements the
belief accumulation for a feature response at a target location
and the reduction of the likelihood for a representation that
does not receive any support (derived from a broader visual
context).
The three stages of the cascade will now be sketched and
discussed in more detail.
(1) The first processing stage includes a spatial inte-
gration and nonlinear enhancement of the signal, which is
realized through synaptic signal processing in the dendritic
tree laterally integrating incoming feeding signals [28]. In
other words, the initial stage of the cascade acts like a filter
that can be linear or non-linear in principle. For example, in
area V1 orientation selective filters, or simple cells, measure
the presence of local oriented contrasts. At other stages, like
areas V2 or V4, long-range integration of inputs establishes
oriented boundaries, while coarse-grain lateral interaction
senses the presence of orientation discontinuities in texture
patterns. In motion, such input filtering in V1 measures ini-
tial direction-selective spatiotemporal changes or integrates
such estimates into directional motion responses in area MT
[29].
(2) In the second processing stage, feedback (FB) signals
reenter that are delivered by other visual areas, possibly
from stages higher up in the hierarchy. Such feedback is
modulatory as it cannot by itself generate activation without
the presence of feeding, or driving, input. The table in
Figure 2 outlines the logic of processing at this stage in
the cascade. Each row summarizes the situation of presence
or nonpresence of feeding input (zero level or activity a)
while the columns denote the situation for feedback signals
(zero feedback signal or feedback signal b). The interaction
realizes a linking strategy as originally proposed by [30].
In a nutshell, when no driving input is present, then even
the presence of feedback activity cannot generate any net
response. However, if driving input is present but receives no
feedback signal, then the input is not extinguished by simple
EURASIP Journal on Advances in Signal Processing 5
multiplicative combination. Rather, the feeding input is left
unchanged. Only in the case when both feeding input as well
as modulating feedback signals exist, then the feedforward
signal is enhanced by a multiplicative gain control. We
suggest a simple mechanism that is denoted by out
x,feat
=
drive
x,feat
·(1 + λ · feedback
x,feat
), where λ defines a constant
amplification factor (indices (x, feat) denote the spatial
position and the feature that is considered, e.g., velocity or
contrast orientation). If the feedback signal is generated by
mechanisms that cover a large spatial region and combine
multiple input streams, then this allows context information
to be reentered to earlier stages of processing and the
representations created there. Such contextual modulation
effects may contribute to texture segmentation (Zipser
et al. [31]), figure-ground segregation [32], and motion
integration. In all, such feedback is a powerful mechanism
for selective tuning of sensory and processing stages in a
distributed and hierarchical processing scheme as reflected
in the scheme of hierarchical organization of visual areas
(Bullier [33]).
(3) With the third processing stage the integrated signals
are normalized by lateral interaction between retinotopic
organized features. Lateral (horizontal) connections often
build the surround of a receptive field’s integrating area
(Stettler et al. [34]). Following the suggestion of Sperling [35]
lateral interaction incorporates a normalization that has the
effect to bound activity. This inhibitory lateral interaction is
implemented by dividing activity at each retinotopical loca-
tion by laterally integrated input activity, net
in
. This property
is achieved in the model by the saturation properties of the
model membrane conductances as denoted in (2). By setting
parameters C
= D = 0(2) simplifies to
τ
dv
(
t
)
dt
=−A ·v
(
t
)
+ B ·net
ex
−E ·v
(
t
)
·net
in
(5)
which equilibrates to
v
∞
=
B · net
ex
A + E · net
in
. (6)
We assume that the net inputs are calculated by an on-
center and off-surround mechanism, with net
ex
= act ∗
Λ
center
and net
in
= act ∗ Λ
surround
,“∗” denoting the
convolution operator. Then, the surround input acts on the
center input activation by a divisive effect. It should be
noted that the effect can be amplified by allowing small
subtractive inhibition from surround input level to act on
the center activation (setting D>0). This leads to contrast
enhancement which is still normalized by the surround input
activation.
The generic flow of input signals that incorporates
excitatory and inhibitory driving input specifies the on-
and off-subfields of a model cell. In addition to this,
Carandini and coworkers found evidence for characteristic
nonlinearities in the response characteristics of cortical cells,
namely, orientation selective V1 cells. These nonlinearities
capture miscellaneous effects including (i) contrast responses
which show saturation properties at different levels, and
(ii) nonspecific suppression by stimuli which do not, by
themselves, lead to any cell firings. These include cross-
orientation inhibition and nonspecific suppression that is
(largely) independent of motion, orientation, spatial, and
temporal frequency (as well as an increase of contrast
leading to faster response). Also, (iii) nonlinearities were
observed in which spatial summation of cells changes with
stimulus contrast [18]. The authors suggest that a stage
of (delayed) divisive inhibition by unspecific pooling of
neuron responses over a large neighbourhood in space and
feature domain can account for this nonlinearity [18, 36].
Figure 3 summarizes the components of the model of a
cortical cell and its possible biophysical implementation by
the mechanism denoted in (2). Here, the excitatory and
inhibitory driving inputs regulate the conductances of the
model cell’s membrane, namely, g
ex
and g
in
,respectively,
while the passive (constant) leakage conductance realizes
the decay of activation to a resting state in the case of
lack of input. The incorporation of an additional shunting
conductance, g
shunt
, that is regulated by the average activation
from a pool of neurons in the same cortical layer leads to
the divisive normalization of cortical activity (gray shaded
componentintheextendedcircuitmodelofFigure 3). Note
that in the original proposal by Carandini and Heeger
[36] this component also incorporated a battery, E
shunt
,
that allows an additional additive influence of the pooled
activation on the target cell. We omit this here, because the
pooling is considered to generate a silent outer-surround
effect. The outer-surround is defined by a spatial region
around a target cell that is supposed to have an inhibitory
effect on the target cell’s response. If the inhibition is purely
divisive, then it does not generate a measurable effect as long
as the target cell is inactive. This divisive, or silent, inhibition
effect is driven by the surround region defining the pool of
cells to normalize the cell activities governed by the outer
surround region.
In all, the extended circuit constitutes the so-called nor-
malization model of cortical cell responses. It is important
to clarify the individual contributions of the input activities.
The net excitatory and inhibitory input is thought to be
generated by the filtering mechanism at the initial stage of
the cascade architecture (see above). So, the input activity
feeds the excitatory and inhibitory subfields, for example,
on-center and off-surround, of a given target cell that shows
a saturation of its activity when the input is pushed to the
limits. The normalization property is controlled by the pool
of cells of a similar type like the target cell. The range of
spatial integration for the pooling is supposed to be much
larger than the spatial range of the excitatory/inhibitory
integration. As a consequence, the normalization by the
pooled activation regulates the overall activity of the cells
by keeping the total response energy approximately constant.
The dynamics is governed by the following mutually coupled
pair of equations:
τ
dv
(
t
)
dt
=−E
decay
·v
(
t
)
+
(
E
ex
−v
(
t
))
·net
ex
−
(
E
in
+ v
(
t
))
·net
in
−α ·v
(
t
)
·w
pool
(
t
)
,
6 EURASIP Journal on Advances in Signal Processing
Excitatory
input
Inhibitory
input
C
i
C
g
leak
v
i
inj
i
leak
E
leak
g
ex
i
ex
E
ex
g
in
i
in
E
in
g
shunt
i
shunt
Cells in
apool
Firing
rate
Figure 3: Circuit model to describe the dynamics of the membrane potential of a model cell. Simple single compartment models of neurons
describe the membrane as a layered patch of phospholipid molecules that separate the internal and external conducting solution acting as an
electrical capacitance. The membrane is an electrical device consisting of a capacitance, C, a specific membrane resistance, R, and a resting
potential driven by a battery (E
leak
). The model takes into account excitatory and inhibitory synaptic input currents to adaptively change the
membrane conductance denoted by g
ex
and g
in
, respectively. The regulation of the membrane conductance by silent, or shunting, inhibition,
g
shunt
, through the activity from a pool of cells is depicted by the component on the right (grey shaded region). See text for further details
and discussion.
τ
pool
dw
pool
(
t
)
dt
=−w
pool
(
t
)
+
E
pool
ex
−w
pool
(
t
)
×
v
(
t
)
∗Λ
pool
(7)
with Λ
pool
denoting the integration kernel for the pooling
of activities and α is a constant amplification. Since the
pooled activity enters the shunting inhibition mechanism,
the response property becomes nonlinear. The components
displayed in Figure 3 relate to the elements in (7) in the
following way: conductances g
ex
, g
in
,andg
shunt
are denoted
here by net
ex
,net
in
,andw
pool
,respectively(w
pool
is computed
separately in the second part of the equation); g
leak
is constant
denoted by E
decay
. The resting level for the passive decay is
assumed to be zero such that the battery E
leak
= 0. The
constant τ
= RC is defined by the membrane capacitance
and the resistance R
= 1/g
leak
.
3. Model of Motion Processing in
Cortical Architecture
3.1. Three-Level C ascade in Motion Analysis. The generic
cascade architecture as discussed in the previous section
has been specifically established for a model of motion
detection and integration along the first stages of the dorsal
cortical pathway. The core model architecture consists of
essentially two model areas, namely, area V1 and MT. A
sketch of our model architecture for motion processing is
presented in Figure 5 which consists of two main model
areas. Motion analysis in visual cortex starts with primary
visual area V1 and is subsequently followed by parietal areas
such as MT/MST and beyond. These areas communicate
with a bidirectional flow of information via feedforward and
feedback connections. The mechanisms of this feedforward
and feedback processing between model areas V1 and MT
can be described by a unified architecture of lateral inhibition
and modulatory feedback whose elements are outlined in the
previous Section 2.2. Here, we present the model dynamics
within and between model cortical areas V1 and MT involved
to realize the detection and integration of locally ambiguous
motion input signals.
In a nutshell, following the general outline in the
previous Section 2.2, the model consists of two areas with
similar architecture that implement the following mecha-
nisms (compare Figure 4).
(1) Input Filtering Stage. Feedforward motion detection
and integration is considered as a (non-) linear fil-
tering stage to process spatiotemporal input patterns
to generate the driving, or feeding, input activation
for each model area at the initial stage of the 3-
level-cascade. The activity generates the driving, or
feeding, input activities which are denoted by lines
with arrow heads in Figure 4.
(2) Modulating Feedback. Cells in model area V1 that
represent the initial motion response are modulated
by cell activations from model area MT. Cells in MT
can, in principle, also be modulated by higher areas
such as MST or attention. Since we focus here on the
two stages of V1-MT interactions, the feedback signal
path entering model area MT is set to zero. In order
to distinguish the modulating property that cannot
generate an activity without coexisting input, we
denote it by a dashed line with arrow head (Figure 4).
EURASIP Journal on Advances in Signal Processing 7
Model MT
Model V1
Figure 4: Schematic view of the model showing the interactions
of the different cortical stages that were taken into account by the
model. In essence, it is shown how initial motion is detected and
further processed at the stage of area V1. V1 activity is fed forward
(red lines with arrow heads) to be integrated by motion selective
cells in model area MT. Such cells integrate over a larger spatial
neighbourhood and thus build an increasing spatial scale. Cells in
V1 as well as in MT interact via inhibitory connections (purple
lines with round heads). Feedback from MT to V1 (red dashed lines
with arrow heads) connects cells of corresponding selectivity in the
motion feature domain.
(3) Lateral Interaction and Normalization. The final
stage of the cascade implements a center-surround
architecture with saturation property to normalize
the overall activation from the inputs. The process
can be augmented by the normalization from the
pool of neurons in the same layer of the area under
consideration. The laterally inhibitory interactions
are denoted by lines with rounded heads (Figure 4).
The model describes the interactions between several
layers processing local motion information. The state of each
layer is described by a scalar-valued function corresponding
to an activation level at each spatial position and for each
velocity (speed and direction). The model estimates the
velocity information from an input grey level video sequence
utilizing the mapping I :(x, t)
∈ Ω × R
+
→ I(x, t) ∈ R,
where x
= (x, y) denotes spatial positions in the 2D image
domain Ω and t is the time. The motion responses y in the
different stages i
∈{1, 2, 3} are denoted by the following
equation:
y
i
:
(
x, vel, t
)
∈ Ω ×Υ × R
+
−→ y
i
(
x, vel, t
)
∈
[
0, B
]
,
i
= 0, 1, 2,
(8)
where vel
= (s, φ) denotes the 2D velocity space composed of
speed and direction and i indexes the computational stage
within the 3-level cascade in a model area. The responses
y
i
at different stages are bounded to keep activations levels
between 0 and a maximum level denoted by the constant B.
In Figure 5 the hierarchy of model areas related to the initial
stages of cortical motion processing is outlined in a box-and-
arrow display. In a nutshell, the input signal is processed by
some filtering stage, for example, in order to preprocess the
input. This stage is associated with Retina and/or LGN. In
Figure 5 the filtering stages are displayed by the small icons
corresponding to the cell receptive fields and their velocity
selectivities.
The following stages define the core elements of the
computational model as proposed in this paper. The initial
motion-selective filtering in model area V1 is realized
by a spatiotemporal correlation scheme. We employed an
extended Reichardt detector (compare [14]) but have also
utilized spatiotemporal filtering mechanisms in order to deal
with spatial and temporal scales (compare [37]). The initial
motion estimation mechanism is detailed in the following.
The mechanisms for further processing of detected motion
signals and their integration are associated with areas V1
and MT. Figure 5 displays this by indicating the first stage
of representations with direction selective units and the cells
in the next area with much larger receptive field sizes. The
different relative receptive field sizes have been measured
experimentally and the values range from 1 : 5 up to 1 : 10
[28, 38]. In the model simulations we typically used a
parameterization at the lower size range, namely, 1 : 5 for
V1 : MT filter sizes. Motion contrasts can be detected by
mechanisms utilizing a center-surround region, for example,
with opposite direction selectivity. Such opponent-velocity
selective motion sensitive cells have been reported to occur
in area MT as well as in the ventral division of area MST,
MSTv [29]. The mechanisms of feedforward filtering and
signal enhancement, modulatory feedback signal processing,
and activity normalization will be discussed as follows.
3.2. Local Motion Estimation. The input processing stage for
initial motion detection is divided into two steps. The first
concerns cells selective to static oriented contrasts at different
spatial frequencies and independent of contrast polarity to
resemble model complex cells. The filtering mechanism is
implemented by the following equation:
dc
0
(
x, θ, t
)
dt
=−0.01 ·c
0
(
x, θ, t
)
+
∂
2
x,θ
Λ
σ
∗I
(
x, t
)
−
c
0
(
x, θ, t
)
·
Λ
σ
∗
Φ
∂
2
x,φ
Λ
σ
∗I
(
x, t
)
dφ
,
(9)
which is solved at equilibrium. Eight orientations (θ)were
used for the simulations, “
∗” denotes the convolution
operator, Λ
σ
is a spatial weighting function (Gaussian with
size parameter σ), and ∂
2
x,θ
Λ
σ
denotes the second directional
derivative along θ. The response of the filtering stage is
normalized by responses in a spatial neighbourhood to
yield contrast dependent activity c
0
. The normalization is
computed by integrating the contrast responses over all
orientations φ (over the domain Φ).
The second stage considers direction-selective cells, to
compute motion energy from spatiotemporal correlations
for opposite motions between two consecutive image frames.
8 EURASIP Journal on Advances in Signal Processing
Retina
/LGN
V1 MT MSTv
Detection Integration Contrast
Figure 5: Box-and-arrow representation presenting an overview of neural connection and interaction scheme based on different cortical
areas. Input images are fed forward from LGN into model area V1, where they undergo a filtering with a bank of orientation selective filters
to extract local structure in an image frame. Performing a spatiotemporal correlation with these local response energies generates an initial
motion signal which is forwarded to model area MT. In area MT a population code is generated to encode motion speed and direction. This
integrated motion signal is further delivered to model area MSTv that may detect discontinuities in the flow field of motion vectors. The
modelling framework presented here focuses on the interactive processing of motion information at the level of areas V1 and MT. We have
highlighted this by the dashed grey box in the center of the figure. See text for further details.
Local motion is measured by testing a range of distinct
velocities at each location, denoted by shifts Δx
= (Δx, Δy)
around x in the subsequent image frame, using properly
tuned modified elaborated Reichardt detectors (ERDs; sim-
ilar to [39]). (Spatial bandpass filtering of the input images
to generate c
0
responses reduces spatial aliasing effects.
Sampling along the temporal axis using only two consecutive
frames may introduce temporal aliasing which could be
prevented by temporal smoothing. In our experiments using
synthetic as well as realistic test sequences we did not observe
any harmful aliasing effects such that we utilized the simple
approach here.) The resulting activity is denoted by c
1
:
c
( →)
1
(
x, Δx, t
)
=
Λ
σ
∗
Φ
c
0
x, φ, t
·
c
0
x + Δx, φ, t +1
dφ
c
(←)
1
(
x, Δx, t
)
=
Λ
σ
∗
Φ
c
0
x + Δx, φ, t
·c
0
x, φ, t +1
dφ
,
(10)
pooling over all orientation-selective cells at different time
steps. The final output motion response c
1
is calculated to
build a population code of directional responses utilizing
opponent subtractive and shunting inhibition, namely,
dc
( →)
2
(
x, Δx, t
)
dt
=−c
( →)
2
(
x, Δx, t
)
+
c
( →)
1
(
x, Δx, t
)
+
−
0.5+c
( →)
2
(
x, Δx, t
)
·
c
(←)
1
(
x, Δx, t
)
+
,
(11)
and the corresponding response for the opposite direction
c
(←)
2
(x, Δx, t), both of which were solved at equilibrium. The
operator [x]
+
= max(x, 0) denotes half-wave rectification.
The resulting activities c
(•)
2
(x, Δx, t)fordifferent velocities
(encoded by Δx)atdifferent locations (x) indicate unam-
biguous motion at corners and line endings, ambiguous
motion along contrasts, and no motion for homogeneous
regions. The rectified activities generate positive feeding
input for the subsequent motion processing stage as sketched
below.
3.3. Motion Detection and Feedforward/Feedback Processing
in Model Area V1. Thecorecomponentsofthemodel
highlighted in Figure 5 are model areas V1 and MT. Once
again, each model area is defined by a three-level cascade
of processing steps as outlined in Figure 2 In particular, we
define the response properties for model area V1 as follows.
The initial filtering stage is fed by the initial motion detection
as outlined above. Thus this step is governed by the simple
linear processing:
τ
dy
V1
0
(
x, v, t
)
dt
=−α
V1
· y
V1
0
(
x, v, t
)
+ β
V1
0
· f
V1
(
c
2
(
x, v, t
))
,
(12)
with the first term
−α
V1
· y
V1
1
(x, v, t) denoting the activity
decay with rate α
V1
when driving input has been switched
off, β
V1
0
is a scaling constant, and f
V1
(x) = x
2
defines a non-
linear signal enhancement for the initial motion detection
stage. The velocity code v is generated from the offset Δx
and the directional coding denoted by “
→”and“←” in the
previous stage of initial spatiotemporal correlation. These
initial motion responses define the feeding input to the
stage of model V1. This activity is subsequently enhanced
by feedback signals delivered by neurons from higher-order
stages, such as area MT in our case. As outlined above, we
propose a modulating enhancement, or soft-gating, mech-
anism that enhances feeding inputs when corresponding
EURASIP Journal on Advances in Signal Processing 9
feedback activity is available. The signal enhancement stage
reads
τ
dy
V1
1
(
x, v, t
)
dt
=−α
V1
· y
V1
1
(
x, v, t
)
+ β
V1
1
1 − y
V1
1
(
x, v, t
)
·
y
V1
0
(
x, v, t
)
·
1+κ
V1
FB
· y
MT
3
(
x, v, t
)
.
(13)
The r.h.s. of this equation is composed of components
that realize the modulatory enhancement of activities in a
dynamic equation. Again, the first term
−α
V1
· y
V1
1
(x, v, t)
denotes the activity decay. The second term is composed
of three multiplicative components. Here, the term β
V1
1
(1 −
y
V1
1
(x, v, t)) regulates the saturation of the model cell mem-
brane (compare with the excitatory membrane conductance
in (2)). The term y
V1
0
(x, v, t) · (1 + κ
V1
FB
· y
MT
3
(x, v, t)) realizes
the modulatory signal enhancement, or linking, mechanism
as discussed in the previous section. Referring to the table in
step 2 of the cascade as depicted in Figure 2 we can observe
the logic of this linking mechanism. Feeding input activation,
y
V1
0
(x, v, t), is required to generate a nonzero output. In other
words, y
V1
0
gates the feedback activation that is generated by
a higher-level stage of processing. The feedback signal itself
consists of a tonic input level that is superimposed by the
activity, y
MT
3
(x, v, t), that is delivered by the output stage of
model MT (see the following). The feedback activation is
amplified by a constant denoted by κ
V1
FB
.
The final, or output, stage of the cascade is defined by
a center-surround mechanism as discussed in the previous
section. We suggest a generic stage of competition that can
be parameterized properly in order to study the influence of
different model mechanisms. The activity at the competitive
stage reads
τ
dy
V1
2
(
x, v, t
)
dt
=−α
V1
· y
V1
2
(
x, v, t
)
+
β
V1
2
−δ
V1
2
· y
V1
2
(
x, v, t
)
·
y
V1
1
(
x, v, t
)
−
λ
V1
2
+ y
V1
2
(
x, v, t
)
·
Λ
V1,surr
σ
x
∗
vel
y
V1
1
(
x, v
, t
)
dv
−
δ
V1
2
· y
V1
2
(
x, v, t
)
·
Λ
V1,pool
σ
x
∗
vel
y
V1
2
(
x, v
, t
)
dv
.
(14)
The r.h.s. of this equation is again composed by several
components to realize the center-surround competition
corresponding to the sketch of the biophysical membrane
equation depicted in Figure 3. Again, as in the previous
equations, the first term
−α
V1
· y
V1
2
(x, v, t) denotes the rate
of passive activity decay. The next two terms specify the
feedforward on-center/off-surround mechanism driven by
the activity from the previous stage in the hierarchy. In
particular, we get +(β
V1
2
− δ
V1
2
· y
V1
2
(x, v, t)) · y
V1
1
(x, v, t) −
(λ
V1
2
+ y
V1
2
(x, v, t)) ·{Λ
V1,surr
σ
x
∗
vel
y
V1
1
(x, v
, t)dv
},with
Λ
surr
σ
that denotes the spatial weighting kernel for the
surround inhibition (the kernel is parameterized by a scaling
constant σ). The terms in brackets, namely, (β
V1
2
− δ
V1
2
·
y
V1
2
(x, v, t)) and (λ
V1
2
+ y
V1
2
(x, v, t)), denote the membrane
properties for the excitatory and inhibitory driving inputs,
respectively. The parameters β
V1
2
, δ
V1
2
,andλ
V1
2
control the
different types of center-surround interaction. For example,
δ
V1
2
= 0 will drive the center term by a purely additive input
(scaled by β
V1
2
). The constant λ
V1
2
, in turn, controls whether
the inhibition has a subtractive influence on the center. The
multiplicative term y
V1
2
(x, v, t), again, constitutes the divisive
influence of the surround inhibition which is determined
by the weighted integration of the activities in velocity
space at each spatial location over a circular neighbourhood
in the space-domain. In addition, the last inhibitory term
δ
V1
2
· y
V1
2
(x, v, t) ·{Λ
V1,pool
σ
x
∗
vel
y
V1
2
(x, v
, t)dv
} determines
the integration of neuronal activations y
V1
2
(x, v, t)from
the pool of cells in the output stage of model V1 in the
neighbourhood of the target cell and over all velocities.
Here, the kernel Λ
V1,pool
σ
determines the spatial weighting
kernel for the pooling region. The spatial neighbourhood
of the pool of neurons is thought to be much larger than
those of the surround of the feeding inputs (compare [36]),
such that the parameterization fulfils σ
V1,pool
σ
V1,surr
.
Please note that in the final stage of competitive interaction
and activity normalization the dynamical competition has
been lumped into one equation and, thus, simplifies the
mechanism outlined in (7).Inordertodoso,weassumethat
the integration from pooling the cell activations leads to a
quick response, such that the separate components of (7)can
be combined into one.
It should be further noted here that the separate
equations to denote the individual stages of the processing
hierarchy can be combined to yield a reduced description
of the system of equations. For example, if we assume that
the responses of the initial stages of filtering and feedback
modulation quickly equilibrate, then both equations can be
fused into one to yield
τ
dy
V1
1
(
x, v, t
)
dt
=−α
V1
· y
V1
1
(
x, v, t
)
+ β
V1
1
1 − y
V1
1
(
x, v, t
)
·
f
V1
c
(•)
2
(
x, v, t
)
·
1+κ
V1
FB
· y
MT
3
(
x, v, t
)
(15)
assuming proper rescaling and adjustment of constants.
Furthermore, under the assumption of quick equilibration of
activities, the activity for y
V1
1
(x, v, t) can be directly plugged
into the equation that denotes the final competitive stage
for center-surround normalization. In sum, by simplifiying
over details in the exact dynamic behavior the computational
simulation of the familiy of equations can be rather sim-
plified in order to speed up processing and to simplify the
analysis of the response properties of the layered architecture
of mutually coupled neuronal sheets of model neurons. In
order to prevent any negative activation levels y
2
responses
are half-wave rectified before they are fed forward to model
area MT cells.
10 EURASIP Journal on Advances in Signal Processing
3.4. Motion Integration in Model Area MT. As already
pointed out in the previous section, we propose that each
model area is composed of essentially the same three-level
cascade of computational stages. The function of the input
changes in accordance with the desired functionality of the
stage of processing. Thus, filter functions, sampling rates,
and individual parameterization of the individual stages
change properly. Other than that, the structure of processing
along the individual stages, therefore, looks almost similar
in model area MT. We outline the stages in a step-by-step
fashion.
The initial filtering stage is fed by the output of model
area V1 and integrates over a larger spatial neighbourhood a
range of different velocities. This processing step is governed
by the following equation:
τ
dy
MT
0
(
x, v, t
)
dt
=−α
MT
· y
MT
0
(
x, v, t
)
+
1 − β
MT
0
· y
MT
0
(
x, v, t
)
·
f
MT
Λ
MT
σ
x,vel
∗ y
V1
2
(
x, v, t
)
.
(16)
The first term of the r.h.s. of this equation,
−α
MT
·
y
MT
0
(x, v, t) denotes the rate of passive activity decay. The sec-
ond term, like in model V1, denotes the activity integration
that is modulated by the activity, (1
− β
MT
0
· y
MT
0
(x, v, t)).
The feeding input activity for the velocity selective target
cell is integrated over a space-velocity neighbourhood as
depicted by
{Λ
MT
σ
x,vel
∗ y
V1
2
(x, v, t)}.Thefunction f
MT
(x),
again, is used to nonlinearly transform the input signal
by, for example, a squaring operation. The second stage
again implements a modulating enhancement mechanism
that enhances feeding inputs by feedback signals. This reads
τ
dy
MT
1
(
x, v, t
)
dt
=−α
MT
· y
MT
1
(
x, v, t
)
+
1 − β
MT
1
· y
MT
1
(
x, v, t
)
·
y
MT
0
(
x, v, t
)
·
1+κ
MT
FB
· y
high
3
(
x, v, t
)
.
(17)
Again, the first term of the r.h.s. of this equation
−α
MT
·
y
MT
1
(x, v, t) denotes the rate of activity decay. The second
term is composed of three multiplicative components, like
in the equation for model V1, with (1
−β
MT
1
· y
MT
1
(x, v, t)) to
regulate the saturation property of the model cell membrane.
If one wishes to linearly integrate the integrated filter
responses, the shunting term can be eliminated by setting
β
MT
1
= 0. The term y
MT
0
(x, v, t) · (1 + κ
MT
FB
· y
high
3
(x, v, t))
allows further modulatory input from other stages in the
visual hierarchy of processing. For example, as outlined
in Figure 5, input can be incorporated that computes the
presence of motion discontinuities and these signals can be
utilized to enhance the representation of motion at the stage
of model MT (compare [37]). Also, attention signals can
be incorporated to bias the competition at the output stage
(compare [40]). In this case, either spatial attention signals
may be incorporated that enhance the activities at given
spatial locations, or, feature attention signals may enhance
the presence of specific features irrespective of their location.
In the computational framework presented here, we assume
no modulating input from any higher-order stages, such that
κ
MT
FB
= 0. As a consequence, the bottom-up feeding input is
simply fed forward without major changes, namely,
τ
dy
MT
1
(
x, v, t
)
dt
=−α
MT
· y
MT
1
(
x, v, t
)
+
1 − β
MT
1
· y
MT
1
(
x, v, t
)
·
y
MT
0
(
x, v, t
)
.
(18)
For parameter settings of α
MT
= 1andβ
MT
1
= 0
the equation reduces to an identity transform of the input
activations y
MT
0
(x, v, t). Finally, the output stage of the
cascade is again defined by a center-surround mechanism
of the same generic structure as above. The activity at the
competitive stage reads
τ
dy
MT
2
(
x, v, t
)
dt
=−α
MT
· y
MT
2
(
x, v, t
)
+
β
MT
2
−δ
MT
2
· y
MT
2
(
x, v, t
)
·
y
MT
1
(
x, v, t
)
−
λ
MT
2
+ y
MT
2
(
x, v, t
)
·
Λ
MT,surr
σ
x
∗
vel
y
MT
1
(
x, v, t
)
dv
−
δ
MT
2
· y
MT
2
(
x, v, t
)
·
Λ
MT,pool
σ
x
∗
vel
y
MT
2
(
x, v, t
)
dv
.
(19)
The r.h.s. of this equation realizes the center-surround
competition that considers the surround inhibition for the
feeding input as well as the normalization by the pool of
neurons in the same layer. The first term
−α
MT
· y
MT
2
(x, v, t)
denotes the rate of passive activity decay. The next two terms
specify the feedforward on-center/off-surround mechanism
driven by the feeding input activation from the previous
processing stage in model MT, namely, y
MT
1
(x, v, t) for the
center activity and
{Λ
MT,surr
σ
x
∗
vel
y
MT
1
(x, v, t)dv} for
the surround. Both input components serve as variable
conductance excitatory and inhibitory input, respectively,
which are modulated by the leading terms in brackets.
The symbol Λ
MT,surr
σ
denotes the spatial weighting kernel
for the surround inhibition in model area MT. Again, the
parameters β
MT
2
, δ
MT
2
,andλ
MT
2
control the different types
of center-surround interaction. For example, δ
MT
2
= 0will
drive the center term by a purely additive input (scaled
by β
MT
2
). The constant λ
MT
2
, in turn, controls whether the
inhibition has a subtractive influence on the center, and the
multiplicative term y
MT
2
(x, v, t), again, defines the divisive
influence of the surround inhibition (from weighted inte-
gration of activities in velocity space over a circular spatial
EURASIP Journal on Advances in Signal Processing 11
neighbourhood). In addition, the inhibitory term δ
MT
2
·
y
MT
2
(x, v, t) ·{Λ
MT,pool
σ
x
∗
vel
y
MT
2
(x, v, t)dv} determines
the integrated activities over a pool of cells of y
MT
2
(x, v, t)
neurons. The kernel Λ
MT,pool
σ
defines the spatial weighting
kernel for the pooling region which is much larger than the
surround kernel for the feeding inputs, such that σ
MT,pool
σ
MT,surr
holds.
A similar consideration as for modelling V1 responses
also applies to model MT cell responses. As already pointed
out above, we do not consider any modulatory input to
model MT cells which leads to an identity stage of processing,
given proper parameter adjustments. Since the initial stage
of filtering at the input to the MT cascade integrates over
spatial position and velocities of the V1 motion detection
input, this step can also be directly summarized into the last
equation. As a consequence, the dynamic MT processing can
be formulated by one equation that defines the MT activity,
namely,
τ
dy
MT
2
(
x, v, t
)
dt
=−y
MT
2
(
x, v, t
)
+
β
MT
− y
MT
2
(
x, v, t
)
·
f
MT
Λ
MT
σ
x,vel
∗ y
V1
2
(
x, v, t
)
−
λ
MT
+ y
MT
2
(
x, v, t
)
·
Λ
MT,surr
σ
x
∗
vel
f
MT
Λ
MT
σ
x,vel
∗ y
V1
2
(
x, v, t
)
−
y
MT
2
(
x, v, t
)
·
Λ
MT,pool
σ
x
∗
vel
y
MT
2
(
x, v, t
)
dv
,
(20)
utilizing here parameter settings α
MT
= δ
MT
2
= 1. (The
summarizedactivityinmodelMTisexpressedbyone
equation by lumping the individual stages of the cascade.
In order to keep the nomenclature used so far we choose
to assign the response level to the output of the model
area. Thus the resulting activity is indexed with the final
level corresponding to y
2
.) In this combined equation
(20) saturation levels β
MT
and λ
MT
occur that have the
same computational roles as in the separate equations (see
Section 2 for the general description). In order to avoid
confusion we omitted indices here.
These model equations in the simplified form were sub-
sequently used to simulate the motion responses to various
input sequences. In order to emphasize the explanatory
power of the approach to explain biological information
processing, we demonstrate how the model can cope with
input that were used in various experimental settings in
animal studies (neurophysiology) and human behavioural
investigations (psychophysics). In order to demonstrate
the potential of the approach to deal with realistic input
sequences from various technical application domains, we
also show results for selected benchmark test sequences and
data that have been acquired in an application-oriented
project scenario.
4. Simulation Results
In this section we present results of computational investi-
gations using the model framework as outlined above. The
results are grouped to first demonstrate the capability of
the model to explain experimental findings from perceptual
psychophysics and physiology. In the second part we show
several results for realistic image sequences from benchmark
data repositories and data related to application projects.
Before presenting the details of the simulation results
we summarize few details that are common to all compu-
tational experiments, such as the parameterization of the
computational stages and the display of results. The extended
Reichardt detector scheme as outlined in Section 3.1 has
been utilized in all experiments for initial motion estimation.
The initial responses are transferred through a square non-
linearity f(
·) to generate y
V1
0
(x, v, t). The feedforward center-
surround mechanisms at the stages of model area V1 and
MT to generate y
V1
2
(x, v, t)andy
MT
2
(x, v, t) activities, respec-
tively, utilize a small component for subtractive inhibition:
λ
V1
2
> 0, λ
MT
2
> 0. All experiments, except for the comparison
study shown in Figures 8 and 9, only use feedforward
surround inhibition, thus δ
MT
2
= 0. In the case shown
in Figure 9 the effects of feedforward surround inhibition
in the output stage of model MT are compared against
the modulatory surround normalization from the pool of
neurons. The results of processing are shown in a color code
that has been taken from [13]. Here, the hue component
encodes the direction (compare the color wheel presented as
a legend in the figures) while the color saturation encodes
speed. In addition to this Baker-style visualization, color
transparency levels were set in accordance with confidence
as computed from the overall motion energy activation
calculated at each position. In addition, the flow direction
is depicted with black triangles symbolizing vectors with
direction and length parameterized in accordance with the
local velocity. The model used a fixed set of parameter
settings. These are listed in a separate table that is included
in the newly incorporated appendix.
The simulations were run by using a library of C++
software that has been developed by the authors of this
paper. The implementation uses graphic card technology
and the CUDA programming environment to accelerate
computation of mathematical and image processing opera-
tions. In cases indicated we utilized steady-state equations
as outlined in Section 3 to further speed up processing. We
got a performance to process about one image frame per
second with a spatial resolution of 320
× 240 pixels. The
full dynamic equations have been numerically integrated
for model variants when steady-state solutions could not be
used, for example, for pooling the activities in the output
stage of a model area to normalize activations. Numerical
integration used Euler’s one-step method.
4.1. Results for Data Sets Used in Animal and Human Exper-
iments. In this section we have particularly focused on the
processing that aims at explaining empirical results obtained
in experimental studies such as in psychophysics and animal
physiology. We show three example results, namely, the
12 EURASIP Journal on Advances in Signal Processing
Initial After 5 steps After 10 steps
(a)
20
30
40
50
60
70
Direction (◦)
2 4 6 8 10 12 14 16 18
Time steps
Integrated motion direction
Measured at hor. edges
Measured at vert. edges
True motin direction
(b)
Figure 6: This example shows a moving square with elongated boundaries and homogeneous surface layout (image size is 320 × 240
pixels). Motion direction is 38.7
◦
in clockwise direction measured against the horizontal axis (down-right) at a speed of (Δx, Δy) =
(4.0, 5.0) px/frame. Image frames have been lowpass filtered to avoid aliasing. Motion correspondences are tested in the range of Δ =±7
px/frame along the horizontal and vertical directions, respectively. The local average motion activity is displayed by a vector and a color code
presented in the palette on the right. The true motion direction can only be measured initially (first frame) at the four corners while along
the 1D edges only the normal flow components orthogonal to the contrasts are detected (aperture problem). Feedforward and feedback
interactions between model areas V1 and MT ensure that the true object motion signals are integrated and further propagated along the
outline boundary of the object to disambiguate locally ambiguous estimates (see second and third frames on the top). The initial direction
error decreases over time until the true object motion is achieved at all parts of the object and a coherent motion representation has been built
over time. The temporal resolution of the aperture problem has been measured in neurophysiological experiments [41] and demonstrates
that MT cells adapt to the true velocity over time, just as in these simulations.
dynamic solution of the aperture problem, a hysteresis effect
in the temporal update of the motion representation given
contradicting evidence for motion direction, and the motion
interpretation for configurations seen through an occluding
window.
4.1.1. Temporal Resolution of the Motion Aperture Problem.
Pack and Born [41] have demonstrated that monkey MT
cells resolve the aperture problem over time. Initially, cells
measure normal flow for extended surface outlines but signal
correct velocities at localized image features, such as corners.
Over time depending on the distance of the contour location
from the position of localized features (along the same
boundary) neurons in MT change their direction selectivity.
Over a time course of approximately 80 milliseconds the peak
selectivity changes to signal the true motion direction. In
the computational experiment we used a square region that
moved with constant speed rightwards along the downward
diagonal. The motion estimates are displayed for different
temporal steps showing the initial signaling of normal
flow along the boundary of the square. Over time the
initially correct motion estimated at the localized corners
is propagated by feedforward and feedback interactions
such that the uncertainty is resolved after approximately 8
time steps (results were shown for the 5th and the 10th
steps, Figure 6(a)). The results and their changing direction
selectivity are shown for the different edge orientations for
all steps (Figure 6(b)).
4.1.2. Hysteresis Effect for Motion Interpretation. In the next
experiment a cloud of random dots is moving towards the
right (100% dots moving coherently). Over time, for each
frame two percent of the dots (at random positions) switch
their movement direction into the opposite, namely, to the
left. After 25 frames of the video sequence 50% of the dots
are moving to the right while 50% are moving to the left.
Forevenlongerdurationmoreandmoredotsmoveto
the left until finally all dots are moving to the left. The
challenge of the demonstration is that perceptually it takes
time before suddenly the observer notices an abrupt switch
in motion direction. Such displays have been observed to
induce perceptual hysteresis which indicates an interaction
between sensory processing and a short-term memory [42].
A simple linear motion integration mechanism, such as the
spatiotemporal motion energy filters, predicts almost linear
response behaviour. The response strength of a cell that is
EURASIP Journal on Advances in Signal Processing 13
0
0.2
0.4
0.6
0.8
1
Cells activities (sum)
indicating rightwards motion (%)
00.20.40.60.81
MT responses with feedback
Left to right
Right to left
50%
(a)
0
0.2
0.6
0.8
1
Cells activities (sum)
indicating rightwards motion (%)
00.20.40.60.81
MT responses with feedback
Left to right
Right to left
50%
(b)
Figure 7: This example demonstrates the inertia of the dynamic feedforward and feedback interaction causing a perceptual hysteresis effect.
The proportion of MT cell activities indicating rightward motion (Σactivities
right
/Σactivities
left
) is plotted for each frame, processing two
random dot kinematograms (the sequence shows 60 moving dots and consists of 60 frames with 40
× 40 px/frame). Random dots are
initialized at random positions and a horizontal velocity of 3 px/frame. All dots are initially moving in the same direction (in the first
sequence (solid line) dots have rightward motion; in the second sequence (dashed line) dots have leftward motion). In each frame of a
sequence one moving dot switches from the initial direction to now move in the opposite direction. Over time the percentage of dots still
moving into the initial direction decreases linearly as the number of dots moving in the opposite direction increases in the same way. (a)
Feedback processing disambiguates the signal and generates a directional hysteresis effect that indicates the inertia generated by locking in
the prediction from top-down feedback of a motion direction measured over time. Initially estimated motion is slightly ambiguous (80%
correct and 20% incorrect motion) since the correlation detectors confound local dot correspondences. This uncertainty is resolved after
few iterations by model MT cells such that coherent motion is signaled. The response for the sequence that started with 60 dots moving
to the right (solid line) switches the sensed motion from dominant rightward to leftward motion when 60% up to 75% of the dots have
switched their initial motion direction. Thus the network responses still keep their represented motion activity beyond the condition when
half of the dots move in opposite directions (in our case 30 dots moving to the right and 30 dots moving to the left). This behavior is
influenced by the history of previous activities since shifting the point of perceptual decision depends on whether the sequence started with
100% rightward motion or 100% leftward motion (hysteresis). (b) Without feedback, no hysteresis is generated. The sum of cell activities
indicating rightward motion is proportional to the relative number of dots moving to the right (solid line). The initial ambiguity of 80%
correct and 20% incorrect motion is not resolved. With each frame when more and more incoherence occurs due to the dots that switch their
motion direction, the estimated motion responses linearly reduce their response amplitude. This behavior is symmetric for both test cases
starting with coherent dot motion to the right or to the left, respectively. As predicted in this case when half of the dots move in opposite
directions, the motion signal reduced to 50% of the maximum. The figure is reprinted with permission from Bayerl and Neumann [14].
tuned to rightward motion will decline in proportion to the
number of dots moving in the preferred direction. This is
demonstrated for MT cells if the feedback connection to
V1 cells is extinguished such that the cells merely average
the input activations from motion detectors (Figure 7(a)).
When the feedback loop is closed, the MT responses show a
hysteresis effect in that a cell selective to rightward motion
keeps its response for quite a long period when initially
probed by 100% dot motion in the preferred direction.
Only when the opposite motion becomes overwhelming, the
response quickly drops such that the decision is now for the
opposite direction of motion (Figure 7(b)).
4.1.3. Perceptual Motion Benchmark. In a joint effort we
have developed a framework for benchmarking biologi-
cally inspired motion mechanisms, similar in the spirit as
proposed in the computer vision community. Briefly, we
attempt to build up a repository of classic motion stimuli
that have been used in studies of visual psychophysics and
physiology. For those sequences resolution, luminance, and
contrast levels, object speed, and stimulus size are all known
and can be controlled. The general idea is that different
biologically inspired models, as well as computer vision
approaches that claim to incorporate biological plausible
computational steps, can evaluate their models on a data set
14 EURASIP Journal on Advances in Signal Processing
(a)
180
◦
135
◦
90
◦
Block matching
Lucas and kanade (1981)
Horn and schunk (1981)
Our model
(b)
Figure 8: The biologically motivated mechanisms for motion processing demonstrate their capability to process test data used in
perceptual experiments. The results were compared against the responses generated by computer vision algorithms that have been tuned
to mathematical precision and optimality. We tested a classical block matching scheme often used in simple video encoders as well as more
elaborate mechanisms for least-squares optimization of local flow (Lucas and Kanade [44]) and a regularization scheme that imposes a
first-order smoothing constraint to minimize the total change in flow field gradient [2]. One example test case is the barberpole illusion
(a). Humans perceive a horizontal motion for the stimulus with a moving grating behind a horizontal aperture. Classical computer vision
approaches are biased in their global estimation by the normal motion direction for the extended bars. This is indicated by the upward
motion at the smaller edges of the aperture which is shown by the mean velocity direction (b).
that is provided at a website and can be downloaded. It is
beyond the scope of the contribution here, but we present
a result for a selected sequence (the so-called barberpole
illusion) that is from the benchmark repository. Details of
the benchmark and website information can be found in
[43]. We present the results here in order to demonstrate
that the biologically inspired modelling framework leads to
superior performance in comparison with computational
vision methods and that the new results are comparable with
human performance.
The barberpole sequence is presented for a horizontally
elongated rectangular window and a luminance grating that
is moving to the left and upward along the normal flow
direction (see Figure 8). The challenge is that the perceptual
judgement of the object motion is biased by the elongation of
the window. It has been argued that the numbers of termina-
tors moving along the horizontal direction outnumber those
for the vertical direction and thus cause a bias. However,
this alone cannot fully account for the percept of horizontal
figure motion since a simple integration mechanism would
predict a weighted average; the more extended the window is,
the more the average velocity tends towards the horizontal.
This is essentially what classical computer vision models
compute. While the block matching achieves only a minor
bias, the least square optimization approach by Lucas and
Kanade [4] and the regularization approach of [2]produce
similar results to get a strong bias due to the smoothness
constraint that is propagated over the rectangular region. The
neural model proposed here, however, is able to compute
the true velocity. This is achieved through the feedforward
and feedback interaction where the majority of feature flow
generates a strong bias for the horizontal direction which, in
turn, overwhelms the low evidence generated at line ends in
favor of vertical flow (see Figure 8).
4.2. Results for Real-World Sequences. In this section we now
focus on processing real-world data in order to demonstrate
that the neural mechanism can also cope with test images
from realistic scenarios and do not only present lab artifacts
that cannot handle realistic image data. We show two
example results, namely, the processing of an image sequence
from the benchmark database developed by Baker et al. [13]
and some results of processing different video sequences
taken from surveillance test cases acquired in a soccer
stadium.
4.2.1. Computer Vision Benchmark Data. Baker et al. [13]
have proposed a video benchmark database with motion
sequences to challenge available approaches for computer
vision motion detection and integration algorithms. Here,
we demonstrate the computational competency of the neural
model mechanisms by showing results of processing for
the RubberWhale test sequence (Figure 9(a)). For all test
sequences the ground truth data is available such that the
overall error of estimated flow can be evaluated. We aim
here to demonstrate that the model is capable of reliably
processing complex image sequences. We have computed
different error measures, namely, the angular error between
true and estimated flow as well as the end-point error that
takes into account the contributions of speed and direction
(see [13] for details). We have displayed heat maps with the
differenterrormeasuresinordertogetabetterimpression
how the strength and position of errors are arranged in
the scene of moving objects. Also we have calculated error
distributions for the estimated errors to better judge the error
likelihoods and variations that occur in the test cases (see
Figures 9(b) and 9(c)). We compare two simulation results
where the model selectively switches between the model
EURASIP Journal on Advances in Signal Processing 15
(a)
350
300
250
200
150
100
50
0
0 100 200 300 400 500
Angular error (AE)
histogram (deg)
AE
350
300
250
200
150
100
50
0
0 100 200 300 400 500
Angular error (EE)
histogram (deg)
EE
1
2
3
4
5
6
×10
4
0 20 40 60 80 100 120
Mean AE: 13.59
Median AE: 8.45
1
2
3
4
5
6
7
×10
4
0123456
Mean EE: 0.51
Median EE: 0.41
(b)
350
300
250
200
150
100
50
0
0 100 200 300 400 500
Angular error (AE)
histogram (deg)
AE
350
300
250
200
150
100
50
0
0 100 200 300 400 500
Angular error (EE) histogram
EE
1
2
3
4
5
6
7
×10
4
0 20 40 60 80 100 120 140
Mean AE: 14.27
Median AE: 12.73
2
4
6
8
10
12
×10
4
01234567
Mean EE: 0.51
Median EE: 0.47
(c)
Figure 9: The proposed biologically inspired motion processing scheme has also been applied to realistic natural images sequences recently
proposed to benchmark state-of-the-art computer vision algorithms [13]. (a) One frame of the RubberWhale sequence from the Baker et
al. image sequence database. (b and c) In the top row of each subfigure, the ground truth optic flow (left) and simulation results for model
MT neurons (right) are shown. The bottom row shows the angular error (AE) as well as the endpoint error (EE). The center row shows the
errors as a heat map while in the bottom row the error distribution is shown. The error values shown only incorporate those pixel positions
that were defined in the ground truth, and nondefined occlusion regions were excluded from the statistics. On the left (b) a variant of the
model without recurrent normalization from pooling neuronal activity in area MT (δ
MT
2
= 0) is used whereas in the figures on the right (c)
a parameterization with δ
MT
2
> 0 produces results with higher accuracy for homogeneous regions, while error measures increase at motion
discontinuities. Considering the error distributions for the different measures in the bottom row shows that the spread is reduced for the
pool normalization. However, those errors remaining deviate from zero and thus generate an overall weaker performance. These errors are
focused mainly around discontinuities as indicated by the heat map representations.
components at the final stage of processing in the model
areas, namely, the center-surround competition for contrast
enhancement and activity normalization. In Figure 9(b) the
results have been generated for feedforward center-surround
competition as in the previous computational experiments,
whereas in Figure 9(c) the shunting inhibition is fed by the
pool of neurons in order to normalize the response at the
target cell. On a first glance the model in Figure 9(c) seems
to show improved performance in comparison to model
variant in Figure 9(b) in terms of the overall angular and
endpoint error, respectively, since the error distributions for
pool normalization are greatly reduced in spread. However,
a closer look at the data distribution as well as a look
at the mean and median values indicates that the overall
judgement must be more differentiated. Those errors that
remain in the case of Figure 9(c) peak at values which
deviate from zero such that the median also has a maximum
around this value. In the case of Figure 9(b) the peak
occurs closer at zero so that the median (as well as the
mean) values are smaller—although the error variation is
larger. Considering the heat maps in Figure 9 the errors
for the pool normalization are mainly localized around
16 EURASIP Journal on Advances in Signal Processing
Figure 10: Optical flow has been estimated using the proposed neural architecture to process sample image sequences from video
surveillance scenario acquired in a soccer stadium. Here, movement of single persons and groups of people is detected and integrated
for different typical scenarios, such as single persons entering the stadium (top left), groups of people leaving the seating area (top right),
the classification of salient events like flag waving (bottom left), and the flow estimation for a group of jumping people (bottom right). The
motion is again displayed in the direction color code of the palette given in the center.
motion discontinuities generated by surface occlusions. If
these regions would be excluded from the analysis, the
overall performance of the model variant that utilizes the
pool normalization at the output stage of the processing
cascade in model MT would outperform the model variant
in (b).
4.2.2. Image Sequences from Surveillance Datasets. In a recent
project biologically inspired model mechanisms have been
evaluated using different sequences of motion generated by
crowded scenes of people. These video sequences have been
acquired in a soccer stadium and show different types of
motion behaviour. For these sequences there is no ground
truth available. We show four different sequences and the
estimated flow. The variety of image content and complex
flow patterns impose a challenge since the objects (persons,
flags, groups of people) were observed from a distance with
varying spatial resolution. For example, the image frame
in the upper left as compared to the one at the bottom
right (Figure 10) shows different levels of zooming into
the scene showing people at different spatial detail and
resolution. The model mechanisms automatically deal with
these size variations though its iterative computation and the
integration of fine- and coarse-grain detail in the respective
scenes.
5. Discussion
In this contribution, we present a computational frame-
work of motion processing that has been derived from
neuroscience data and is also capable of processing real-
istic image sequences. Both available key findings and
the modeling framework have been briefly presented. The
modeling approach has been developed in the course of
the interpretation of the empirical findings from anatomy,
physiology, and behavioral data. The main contributions of
the modeling framework are as follows.
(i) A framework for hierarchical motion processing is
proposed that consists of layered sheets of inter-
connected model neurons to implement generic
components as building blocks for cortical model
areas,
(ii) We suggest that feedforward and feedback processes
interact in order to implement a hierarchically
organized scheme of motion feature processing for
detection and integration. Feedback signals act as
reentrant modulators that can selectively enhance
those feeding input activations that match the larger
contextual signal representation that is built, for
example, by stages higher up in the processing
hierarchy.
EURASIP Journal on Advances in Signal Processing 17
(iii) Reentrant mechanisms for modulatory signal en-
hancement together with subsequent feature compe-
tition using center-surround mechanisms for activity
normalization implement a framework to bias the
competition of distributed feature activities. The net
effect of such combined processing in the feature
processing cascade implements the selective ampli-
fication of salient features and the inhibition of
responses due to clutter.
The scheme thus allows assembling more complex
processing mechanisms into a network of computational
building blocks by incorporating hierarchical sweeps of
feature processing and modulating interactions along the
reverse hierarchy of feedback processing.
In the following, we will discuss the biological plausibility
of the model and give a brief assessment in comparison
to other existing models of motion processing, both from
biology and technical computer vision approaches.
5.1. Relevance and Biological Plausibility. There is both
structural and functional evidence for the mechanisms and
layered organization of our model. Anatomical and phys-
iological studies suggest inter- and intra-areal connections
also used in our model [11, 45]. Motion-sensitive cells
can be found in MT as well as in V1 [46]. Physiological
studies [47] have shown that cells in V1 are sensitive to
component motion (motion along oriented contrasts) while
cells in MT are less sensitive to oriented components but
signal pattern motion during the course of their temporal
activation. Recent physiological evidence suggests that V1
cells can partially encode pattern motion (thus, motion
independent of the orientation). Pack et al. [48] showed that
the time course of a subpopulation of V1 cells is similar to
the time course of cells in MT solving the aperture problem
near line endings. This is consistent with the prediction
of our model that cells in V1 and MT are disambiguated
simultaneously as a consequence of feedback and local
competitive interaction.
The proposed modulatory feedback mechanism is sup-
ported by recent physiological investigations of feedback
connections between early visual areas (V1, V2, and V3) and
MT [32, 49]. For example, Hup
´
e et al. [32] show that cell
activities in V1 are highly affected by feedback from MT in
an excitatory manner shortly after stimulus onset. This is
consistent with our model, in which only excitatory feedback
modulation is used to enhance activities by increasing their
gain. As a result of recurrent processing, and consistent
with physiological recordings of the time course of MT
neurons [41], our model disambiguates the motion signal
shortly after stimulus onset. Here, the time to establish the
final percept is influenced by the strength of the feedback
connections, the RF field size ratio between V1 and MT,
and, as a prediction of our model, the spatial extension of
the region of ambiguous motion. The time course of MT
cell populations was also investigated by Pack and Born [41]
for different bar lengths (2–8 degrees). Consistent with our
results, the time required to disambiguate such stimuli was
roughly proportional to the bar length.
5.2. Comparison with Other Models of Motion Processing.
The computational mechanisms and different stages in a
processing cascade as utilized by the presented model were
also used in other biologically inspired as well as computer
vision models.
5.2.1. Feedforward Models and Optimization Approaches.
Simoncelli and Heeger [50] proposed a model of detecting
motion energy in areas V1 and MT using linear spatiotem-
poral filters. Individual motion estimates are normalized by
dividing individual responses through the average response
of activity in a spatial neighborhood. Such a center-surround
mechanism has also been employed in our model. We achieve
such normalization of activity by an antagonistic mechanism
that involves shunting inhibition for the net feeding input
as well as the shunting inhibition generated by the average
activity in the pool of cells surrounding the target cell. The
net effect leads to a divisive inhibition at individual locations
by average neuron activities integrated over a neighbourhood
in the space-velocity domain. Unlike Simoncelli and Heeger,
we have incorporated a mechanism of modulatory feedback
allowing the reentry of signals from stages and representation
higher up in the hierarchy that disambiguates the motion
signal and spreads activities over longer distances. It is worth
mentioning that their filtering mechanisms in V1 and MT
couldalsobeusedinourmodel,butinordertofocusonthe
influence of feedback processing, we omitted any additional
parameters.
Nowlan and Sejnowski [51, 52] described a model of
motion integration that utilized an explicit selection signal
that is computed to determine the regions in the visual
field where velocity estimations are most reliable. Motion-
sensitive cells are then gated by this signal to produce
the final estimate. Note that the way they learn how to
compute the selection signal is an elegant method that
may be applied to learn a normalization process like the
one described by Simoncelli and Heeger [50]. Our model
differs in several ways from Nowlan’s approach. While their
approach utilizes a feedforward scheme, our model combines
feedforward estimates with feedback integration and predic-
tion. As a consequence, initial rough estimates are integrated
and disambiguated over time within a recurrent loop of
matching velocities and motion predictions generated in
area MT. As a by-product, the determination of reliable
motion estimates is computed implicitly in our model
instead of explicitly generating a decision-like selection
signal.
Several algorithms have been proposed in the framework
of least-squares optimization [4] and regularization by
incorporating a model smoothness (or prior) term to impose
necessary constraints on the solution. The least-squares
approach to motion estimation assumes locally constant
motion patches to gather enough local motion measures
over a small neighbourhood to disambiguate local motion
estimates by an intersection-of-constraints (IOC) approach.
Unlike the Lucas-Kanade (LK) approach the model architec-
ture proposed here does not assume local constant motion
18 EURASIP Journal on Advances in Signal Processing
over a predetermined neighbourhood. Instead, the continu-
ous smoothing, subsequent amplification (through feedback
signals), and the competitive interaction and normalization
enhance arrangements of salient motion configurations in
a stimulus adaptive fashion. Depending on the density of
motion estimates the activity will be enhanced or lowered
to keep the overall motion energy balanced. An IOC
solution is computed when strong localized features will be
detected in the signal and further enhanced and tracked
over time. The stage of motion integration at the input
stage of model area MT is similar to the approach of
velocity summation or velocity averaging (VA). Together,
the proposed network smoothly blends several properties
of IOC, VA, and feature tracking to arrive at a proper
motion response. Regularization approaches, on the other
hand, utilize constant regularizers [2]oremploymodel
dependent inhomogeneous smoothness priors [9]inorder
to yield coherent estimations of the input object motion.
In many cases, such mechanisms tend to smooth the
velocity field in an undesired fashion, since the smoothness
constraints are controlled by localized mechanisms only. In
our proposal, we demonstrate how context information can
be delivered to selectively enhance (or gate) the bottom-up
motion signals to incorporate intermediate interpretations
of scenic motion patterns. Thus we claim that the proposed
feedforward and feedback architecture provides a powerful
processing framework for motion analysis and feature inte-
gration.
In a similar fashion (like IOC) Weiss and Fleet [5]and
Weiss et al. [6] estimated the velocity of a moving object
using a Bayesian approach. Here, the coherent motion of a
moving shape is determined by maximizing the posterior
probability of noisy, thus uncertain, velocity votes giving
the detected image motions. Simoncelli [7] extended this
approach to model different noise contributions in the
estimation process. This formulation leads to a probability
representation in velocity space for all measures of single
moving objects. In the spirit of IOC computation, all proba-
bility distributions are multiplicatively combined, assuming
independence of individual motion estimates, to arrive at
the likelihood density of a priori motion estimates given
the underlying image motions. In addition a giving prior
of expected velocities in the scene can be employed by
multiplying the likelihood density. The motion estimation
is solved by maximizing the posterior from all individual
measures. In our model, we do not directly combine all initial
estimates, since this requires a priori knowledge about which
moving parts in the stimulus belong together. Instead, we
allow initial motion signals to be modulated by a predictive
signal from the higher processing stage of area MT, which
serves as a local prior that is adaptive over time. In order to
achieve a global consistent estimate, this process is iterated
to allow propagation of disambiguated motion signals along
extended shape boundaries. Again, we also still do not
assume that the motion is composed of local piecewise
constant velocity of patches. Rather, the motion can vary
smoothly in homogeneous regions whereas in the case of
discontinuities enhances the motion signals along extended
boundaries.
5.2.2. Models Using Feedback Mechanisms and Recurrent
Interaction. Grossberg et al. [53] and Mingolla [54]pre-
sented a model of motion integration and segmentation
in MT and MST based on inputs from the form path-
way (modelled as the FACADE framework—Form-And-
Color-And-DEpth) [55]. Berzhanskaya et al. [56] further
extended this mechanism to distinguish between intrinsic
and extrinsic terminator signals that occur in the case
of several moving surfaces that mutually occlude each
other. Such terminators resemble two-dimensional changes
in the spatiotemporal profile of the intensity distribution.
Grossberg and coworkers studied how motion signals from
partly occluded patterns can be integrated and segregated
in a recurrent fashion. In contrast to our approach, their
feedback signals (from MST) inhibit MT activities and
have a more global character due to the RF size of MST
cells (depending on the stimulus, these RFs cover 50%
up to 100% of the entire stimulus). In their model MST
cells compete in a winner-takes-all fashion such that their
responses that signal the most prominent motion direction
will be selected. The authors suggest that such a mechanism
of feedback inhibition and selection also helps to solve the
aperture problem using a decision-like mechanism through
the inhibitory influence of global context information as
delivered by large-spanning kernels [53, 54, 57]. Castet
et al. [58] demonstrated that perceived speed varies as a
function of line length and orientation which has been
successfully simulated by Chey et al. [57] as an instantaneous
property in the momentary speed representation. At a given
orientation increasing the line length reduces the apparent
speed as measured by the ratio between speed measures
in direction orthogonal to line orientation versus actual
speed in (horizontal) motion direction. Reference [59], on
the other hand, investigated the deviations in pursuit eye
movement performance when elongated bars of varying
lengths were presented which should be tracked by eye.
The direction selectivity of MT cells changes over time to
compensate for the initial error in the pursuit signal. We
predict that the resolution of uncertainty for the aperture
problem in the representation at model MT should be largely
independent of the length of the bar stimulus. We predict
that this size invariance provides a means to handle shapes
thatappearatdifferent images sizes—other things being
equal. This property is due to the ability of establishing
robust feature motion signals (e.g., at corners or line ends)
which can help to disambiguate locally ambiguous signals
in the spatial neighbourhood of localized features. Three
functional components establish this functionality, namely,
(i) by utilizing different spatial resolutions (in different
model areas) to build a pyramid structure for integrating
input activities from previous processing stages, (ii) through
recurrent interaction of cells in different areas (MT and V1
in this case) having different receptive field sizes, and (iii)
by propagating disambiguated feature responses (velocities)
along extended boundaries to fill-in salient motion represen-
tations. This can be observed with the stimulus shown in
Figure 6 such that the time for resolving the disambiguous
motion for the moving rectangle varies with its image
size.
EURASIP Journal on Advances in Signal Processing 19
Lid
´
en and Pack [60]proposedamodelofrecurrent
lateral motion interactions, which is able to produce a
traveling wave of motion activation to solve the aperture
problem. Like the model framework outlined here they use
the normalization similar to the mechanism described by
Simoncelli and Heeger [50] to emphasize salient motion
estimates. In contrast to our model scheme their nor-
malization mechanism is not isotropic in velocity space.
The propagation is done by recurrent lateral excitation
leading to an unbounded filling-in process, which has to
be constrained by long-range inhibition of motion cells of
different directional selectivity and by a separately processed
motion boundary signal. In the absence of concurrent
motion signals from multiple objects, their model leads to
completely filled-in motion fields, which must be gated by
multiplying the input signal in order to display only relevant
motion patterns. Conversely, our model implements a kind
of “soft gating” by biasing the input signal during feedback
processing and therefore produces spatially restricted motion
estimates at all time steps without an explicit computation of
motion or form boundaries.
Koechlin et al. [61] describe a model of motion inte-
gration along the V1-MT pathway that utilizes mechanisms
of recurrent lateral interactions. Their model utilizes a
multiplicative combination of feedforward input and the
result of lateral integration. Salient motion features are
emphasized through a stage of normalization, and the
results of recurrent lateral modulation (gating) are used to
propagate these features. Though these mechanisms seem to
be rather similar compared to those proposed in our model,
their realization and behaviour differ in many respects. For
example, their gating process leads to strong inhibition of
the input signal once the model has focused on one specific
velocity while the stimulus changes to another velocity. Such
lateral multiplication intensifies the winner-takes-all charac-
teristic of their model [61]andmakesitmorevulnerable
to outliers. Our model follows a gradual prediction-and-
correction philosophy realized by an excitatory modulation
of feedforward input through feedback signals followed by a
center-surround competitive mechanism to realize a biased
competition. Essential to our model is the decoupling of
processes into different areas with different RF sizes. This,
in turn, provides an extended context sampled by the higher
visual area and the ability to correct (bias) and disambiguate
cell activities at earlier stages (that operate on higher spatial
accuracy). Our proposed architecture is demonstrated to deal
with large varieties of shape or object surface appearance
providing a mechanism of size invariant motion integration.
5.3. Further Extensions of the Model Framework. The model
framework outlined in this contribution has been developed
over several years and has also been extended by the authors
along several directions in order to improve the network
functionality as well as the capability to explain experimental
data. For example, one of the strengths of the modelling
framework is the ability to incorporate other processing-
streams into one common framework. For example, we
have independently pursued several lines of investigation to
combine form and motion streams for feature integration
and segregation. In particular, Tlapale and coworkers have
proposed a combined motion integration mechanism that
is modulated by a gated diffusion mechanism based on
luminance continuity [15]. In brief, a simplified channel
for form processing has been employed here that utilizes
bilateral filtering to adapt the spatial weighting functions
depending on the continuity of the input luminance image.
The concept of bilateral filtering has been proposed in the
computer vision community for implementing a specific
variant for adaptive and anisotropic diffusion filtering for
denoising [62]. In the work of Tlapale et al. [15] the bilateral
filtering mechanism is adopted to steer the integration
of motion signals at the stage of model MT. Here, the
kernel for motion integration
{Λ
MT
σ
x,vel
∗ y
V1
2
(x, v, t)} that is
employed for generating the input activity y
MT
0
(x, v, t)after
initial filtering at the stage of model MT is modulated by
orientation selective form information. In order to achieve
such a stimulus adaptive mechanism a steering kernel is
incorporated to yield
Ω
Λ
MT
σ
(
x
−x
)
·Ψ
(
θ − ∠
(
x, x
))
·Λ
V2
σ
(
I
(
x
)
−I
(
x
))
· y
V1
2
(
x
, v, t
)
dx
,
(21)
where Ψ(θ
− ∠(x, x
)) penalizes deviations in orientation of
the virtual line between target location and the position in
the surround from the axis of an oriented integration kernel,
while Λ
V2
σ
(I(x) − I(x
)) measures photometric differences
that are indicative of different surface patches.
Beck and Neumann [16]investigatedadifferent route
by using modulating input (at stage 2 of the cascade)
that is generated by activity from long-range integration of
boundaries in the form-sensitive pathway of areas V1 and V2
interactions. Similar to Berzhanskaya et al. [56] the model
considers the functional role of the interaction between the
motion and the form pathway of visual cortex. The extended
model shows how the distributed representations of visual
features motion, disparity, and form in areas V1, V2, and
MT mutually interact to arrive at a coherent representation
of moving surface patches. The issue of 2D extrinsic motion
cues generated at occlusions is considered that have to be
treated differently from 2D intrinsic motion features of
the same object. The model by Beck and Neumann [16]
suggests that junctions that are detected in the form pathway
are necessary to generate a correct percept in the motion
pathway.
In different attempt, the core architecture proposed in
this paper has been extended to successfully deal with the
problem of robust representation and segregation of trans-
parent motion. Transparent and semitransparent motion
occurs whenever multiple motions are presented in the
same part of visual space moving in different directions or
with different speeds. The model of Raudies and Neumann
[17] investigates the necessary mechanisms underlying initial
motion detection, the required representations for velocity
coding, and the integration and segregation of motion
stimuli to account for the perception of transparent motion.
20 EURASIP Journal on Advances in Signal Processing
6. Summary and Conclusion
We presented a model of motion processing in areas V1
and MT capable of handling synthetic as well as artificial
image sequences. The model incorporates several key prop-
erties, namely, initial detection of raw flow information,
temporal spreading of reliable motion signals to gradually
correct uncertain flow estimates, and the ability to sharply
segregate regions of individual visual motion. The model
architecture thus makes several new contributions to develop
an architecture of general purpose motion processing that is
inspired by the architecture and function of the visual system
in primates. First, we propose a model of cortical feedforward
and feedback processing in the dorsal pathway of motion
integration implementing a neural hypothesis-test cycle of
computation. Most importantly, the feedback mechanism
is part of top-down modulatory enhancement of initial
activities that match signal properties at a higher processing
stage. Second, the disambiguation of initial estimates is
solved by the interplay between top-down modulation and
subsequent lateral competition. Consequently, the network
dynamics propagate disambiguated motion signals along
shape boundaries, thus realizing a guided filling-in process
[63]. This mechanism is important in that it provides a
meanstoprocessobjectsofdifferent sizes in an invari-
ant fashion. Third, the model serves as a link between
physiological recordings (e.g., [41]) and psychophysical
investigations of perceptual motion integration [42]. Beyond
this, the model is able to process real-world stimulus
sequences to yield accurate motion estimations. We believe
that this further justifies the explanatory competence of
key computational elements of the model, as most other
biologically inspired models do not compare the quality
of their results against other technical or nontechnical
models.
In all, the proposed model provides further evidence
for key computational principles that are involved in the
cortical computation of sensory stimuli, their integration,
and segregation. These key principles have been developed
to explain mechanisms of form processing in boundary
grouping and texture segregation [24, 25]. Here, we now
propose the same core mechanisms to account for the
processing of temporally varying stimuli in the cortical
motion pathway. Given the evidence gathered from our
computational experiments, we claim that the early pro-
cessing stages in visual cortex along the ventral and the
parietal pathway are organized in a homologous fashion.
Modulatory feedback and subsequent divisive inhibition
realize a mechanism of biased competition already at an
early stage with a similar behavior as the one proposed
by [40] for attention mechanisms to filter out irrelevant
information. We have proposed a concept of feedback as part
of a layered structure and representation and presented an
implementation of multiple loops of recurrent interaction
whose dynamics realize multilevel cortical hypothesis testing
cycles. The architecture has demonstrated its usefulness
in that several improvements and model extensions have
been proposed. As a consequence we suggest that the
core mechanisms as presented in this paper can be used
Table 1: Parameter settings for the constants and kernel sizes used
in the neural computational model.
κ
V1
FB
10
α
V1/MT
0.015
β
V1/MT
2
1
δ
V1/MT
2
20
λ
V1/MT
2
0.25
V1 :MT 5 :1
Λ
V1,surr
σ
1
2π4
2
exp(−(x
2
/2 ·4
2
))
Λ
MT,surr
σ
1forx = 0
as basic building blocks that are already powerful to
explain a wealth of empirical data and are also capable
to process realistic sequences in technical applications. It
is thus conceivable that other investigators interested in
biologically inspired technology may start from this point
in order to further develop mechanisms in this frame-
work.
Appendix
Ta bl e 1 is included to display the parameters settings used for
the computational simulations conducted in Section 5.
The range of velocities tested for the correlation-based
matching in the initial motion estimation have been limited
to a range of
±(7, 7) pix.
Acknowledgments
The authors would like to express their gratitude to
the two anonymous reviewers for their thorough reading
and constructive criticism on the first version of the
manuscript. Their comments were very helpful to improve
the manuscript. This joint research has been supported by
the European Community in the 7th framework program
ICT-project no. 215866-SEARISE. P.Kornprobst further
acknowledges funding support by the R
´
egion Provence Alpes
C
ˆ
ote d’Azur. H.Neumann and J.D.Bouecke are further sup-
ported by the Transregional Collaborative Research Center
SFB/TRR 62 “Companion-Technology for Cognitive Tech-
nical Systems” funded by the German Research Foundation
(DFG).
References
[1] H. R. Wilson, V. P. Ferrera, and C. Yo, “A psychophysically
motivated model for two-dimensional motion perception,”
Visual Neuroscience, vol. 9, no. 1, pp. 79–97, 1992.
[2] B. K. P. Horn and B. G. Schunck, “Determining optical flow,”
Artificial Intelligence, vol. 17, no. 1–3, pp. 185–203, 1981.
[3] E.H.AdelsonandJ.A.Movshon,“Phenomenalcoherenceof
moving visual patterns,” Nature, vol. 300, no. 5892, pp. 523–
525, 1982.
EURASIP Journal on Advances in Signal Processing 21
[4] S. Baker and I. Matthews, “Lucas-Kanade 20 years on: a
unifying framework, part 1,” Carnegie-Mellon Univ., Robotics
Institute, CMU-RI-TR-02-16, 2002, />cgi-bin/tech
reports.cgi.
[5] Y. Weiss and D. J. Fleet, “Velocity likelihoods in biological and
machine vision,” in Probabilistic Models of the Brain: Perception
and Neural Function,R.P.N.Rao,B.A.Olshausen,andM.S.
Lewicki, Eds., pp. 81–100, MIT Press, Cambridge, Mass, USA,
2001.
[6] Y. Weiss, E. P. Simoncelli, and E. H. Adelson, “Motion illusions
as optimal percepts,” Nature Neuroscience,vol.5,no.6,pp.
598–604, 2002.
[7] E. P. Simoncelli, “Bayesian multi-scale differential optical
flow,” in Handbook of Computer Vision and Applications,B.
J
¨
ahne, H. Haussecker, and P. Geissler, Eds., vol. 2, chapter 14,
pp. 297–422, Academic Press, New York, NY, USA, 1999.
[8] M. Del Viva and M. C. Morrone, “Motion analysis by feature
tracking,” Vision Research, vol. 38, no. 22, pp. 3633–3653,
1998.
[9] H. H. Nagel, “On the estimation of optical flow: relations
between different approaches and some new results,” Artificial
Intelligence, vol. 33, no. 3, pp. 299–324, 1987.
[10] E. C. Hildreth, “Computations underlying the measurement
of visual motion,” Artificial Intelligence, vol. 23, no. 3, pp. 309–
354, 1984.
[11] D. C. Van Essen and J. L. Gallant, “Neural mechanisms of form
and motion processing in the primate visual system,” Neuron,
vol. 13, no. 1, pp. 1–10, 1994.
[12] J. L. Barron, D. J. Fleet, and S. S. Beauchemin, “Performance
of optical flow techniques,” International Journal of Computer
Vision, vol. 12, no. 1, pp. 43–77, 1994.
[13] S. Baker, S. Roth, D. Scharstein, M. J. Black, J. P. Lewis, and R.
Szeliski, “A database and evaluation methodology for optical
flow,” in Proceedings of the 11th IEEE International Conference
on Computer Vision (ICCV ’07), October 2007.
[14] P. Bayerl and H. Neumann, “Disambiguating visual motion
through contextual feedback modulation,” Neural Computa-
tion, vol. 16, no. 10, pp. 2041–2066, 2004.
[15]
´
E. Tlapale, G. S. Masson, and P. Kornprobst, “Modelling the
dynamics of motion integration with a new luminance-gated
diffusion mechanism,” Vision Research, vol. 50, no. 17, pp.
1676–1692, 2010.
[16] C. Beck and H. Neumann, “Interactions of motion and form
in visual cortex—a neural model,” Journal of Physiology Paris,
vol. 104, no. 1-2, pp. 61–70, 2010.
[17] F. Raudies and H. Neumann, “A model of neural mechanisms
in monocular transparent motion perception,” Journal of
Physiology Paris, vol. 104, no. 1-2, pp. 71–83, 2010.
[18] M. Carandini, D. J. Heeger, and J. A. Movshon, “Linearity and
normalization in simple cells of the macaque primary visual
cortex,” Journal of Neuroscience, vol. 17, no. 21, pp. 8621–8644,
1997.
[19] A. V. M. Herz, T. Gollisch, C. K. Machens, and D. Jaeger,
“Modeling single-neuron dynamics and computations: a
balance of detail and abstraction,” Science, vol. 314, no. 5796,
pp. 80–85, 2006.
[20] P. Dayan and L. F. Abbot, Theoretical Neuroscience, MIT Press,
Cambridge, Mass, USA, 2001.
[21] S. J. Thorpe, “Localized versus distributed representations,” in
The Handbook of Brain Theory and Neural Networks,M.A.
Arbib, Ed., MIT Press, Cambridge, Mass, USA, 2nd edition,
2003.
[22] A. K. Engel, P. R. Roelfsema, P. Fries, M. Brecht, and W.
Singer, “Role of the temporal domain for response selection
and perceptual binding,” Cerebral Cortex, vol. 7, no. 6, pp. 571–
582, 1997.
[23] S. Grossberg, “Nonlinear neural networks: principles, mech-
anisms, and architectures,” Neural Networks,vol.1,no.1,pp.
17–61, 1988.
[24] H. Neumann and W. Sepp, “Recurrent V1-V2 interaction in
early visual boundary processing,” Biological Cybernetics, vol.
81, no. 5-6, pp. 425–444, 1999.
[25] A. Thielscher and H. Neumann, “Neural mechanisms of
cortico-cortical interaction in texture boundary detection: a
modeling approach,” Neuroscience, vol. 122, no. 4, pp. 921–
939, 2003.
[26] A. Thielscher and H. Neumann, “A computational model
to link psychophysics and cortical cell activation patterns
in human texture processing,” Journal of Computational
Neuroscience, vol. 22, no. 3, pp. 255–282, 2007.
[27] P. R. Roelfsema, V. A. F. Lamme, H. Spekreijse, and H.
Bosch, “Figure-ground segregation in a recurrent network
architecture,” Journal of Cognitive Neuroscience, vol. 14, no. 4,
pp. 525–537, 2002.
[28] A. Angelucci, J. B. Levitt, E. J. S. Walton, J. M. Hup
´
e, J. Bullier,
and J. S. Lund, “Circuits for local and global signal integration
in primary visual cortex,” Journal of Neuroscie nce , vol. 22, no.
19, pp. 8633–8646, 2002.
[29] R. T. Born and D. C. Bradley, “Structure and function of visual
area MT,” Annual Review of Neuroscience, vol. 28, pp. 157–189,
2005.
[30] R. Eckhorn, H. J. Reitboeck, M. Arndt, and P. W. Dicke, “Fea-
ture linking via synchronization among distributed assem-
blies: simulations of results from cat visual cortex,” Neural
Computation, vol. 2, pp. 293–307, 1990.
[31] K. Zipser, V. A. F. Lamme, and P. H. Schiller, “Contextual
modulation in primary visual cortes,” Journal of Neuroscience,
vol. 16, pp. 7376–7389, 1996.
[32] J. M. Hup
´
e, A. C. James, P. Girard, S. G. Lomber, B. R.
Payne, and J. Bullier, “Feedback connections act on the
early part of the responses monkey visual cortex,” Journal of
Neurophysiology, vol. 85, no. 1, pp. 134–145, 2001.
[33] J. Bullier, “Hierarchies of Cortical Areas,” in The Primate
Visual System,J.H.KaasandC.E.Collins,Eds.,chapter8,
pp. 181–204, CRC Press, Boulder, Colo, USA, 2003.
[34] D. D. Stettler, A. Das, J. Bennett, and C. D. Gilbert, “Lateral
connectivity and contextual interactions in macaque primary
visual cortex,” Neuron, vol. 36, no. 4, pp. 739–750, 2002.
[35] G. Sperling, “Model of visual adaptation and contrast detec-
tion,” Perception & Psychophysics, vol. 8, pp. 143–157, 1970.
[36] M. Carandini and D. J. Heeger, “Summation and division by
neurons in primate visual cortex,” Science, vol. 264, no. 5163,
pp. 1333–1336, 1994.
[37] M. J. Escobar, G. S. Masson, T. Vieville, and P. Kornprobst,
“Action recognition using a bio-inspired feedforward spiking
network,” International Journal of Computer Vision, vol. 82, no.
3, pp. 284–301, 2009.
[38] T. D. Albright and R. Desimone, “Local precision of visuotopic
organization in the middle temporal area (MT) of the
macaque,” Experimental Brain Research, vol. 65, no. 3, pp. 582–
592, 1987.
[39] E. H. Adelson and J. R. Bergen, “Spatiotemporal energy
models for the perception of motion,” JournaloftheOptical
Society of America A, vol. 2, no. 2, pp. 284–299, 1985.
22 EURASIP Journal on Advances in Signal Processing
[40] R. Desimone and J. Duncan, “Neural mechanisms of selective
visual attention,” Annual Review of Neuroscience, vol. 18, pp.
193–222, 1995.
[41] C. C. Pack and R. T. Born, “Temporal dynamics of a neural
solution to the aperture problem in visual area MT of macaque
brain,” Nature, vol. 409, no. 6823, pp. 1040–1042, 2001.
[42] D. Williams and G. Phillips, “Cooperative phenomena in the
perception of motion direction,” Journal of the Optical Society
of America A, vol. 4, no. 5, pp. 878–885, 1987.
[43]
´
E. Tlapale, P. Kornprobst, J. D. Bouecke, H. Neumann, and G.
S. Masson, “Towards a bio-inspired evaluation methodology
for motion estimation models,” INRIA Rapport de recherch
´
e
7317, June 2010.
[44] B. Lucas and T. Kanade, “An iterative image registration
technique with an application to stereo vision,” in Proceedings
of the 7th International Joint Conference on Artificial Intelligence
(IJCAI ’81), pp. 674–679, Vancouver, BC, Canada, August
1981.
[45] J. H. R. Maunsell, “The brain’s visual world: representation of
visual targets in cerebral cortex,” Science, vol. 270, no. 5237,
pp. 764–769, 1995.
[46] J. H. R. Maunsell and D. C. Van Essen, “Functional properties
of neurons in middle temporal visual area of the macaque
monkey. I. Selectivity for stimulus direction, speed, and
orientation,” Journal of Neurophysiology, vol. 49, no. 5, pp.
1127–1147, 1983.
[47] J. A. Movshon, E. H. Adelson, M. S. Gizzi, and W. T.
Newsome, “The analysis of moving visual patterns,” in Pattern
Recognition Mechanisms, C. Chagas, R. Gattass, and C. R.
Gross, Eds., pp. 117–151, Vatican Press, Vatican City, 1985.
[48] C. C. Pack, M. S. Livingstone, K. R. Duffy,andR.T.Born,
“End-stopping and the aperture problem: two-dimensional
motion signals in macaque V1,” Neuron,vol.39,no.4,pp.
671–680, 2003.
[49] K. J. Friston and C. B
¨
uchel, “Attentional modulation of effec-
tive connectivity from V2 to V5/MT in humans,” Proceedings
of the National Academy of Sciences of the United States of
America, vol. 97, no. 13, pp. 7591–7596, 2000.
[50] E. P. Simoncelli and D. J. Heeger, “A model of neuronal
responses in visual area MT,” Vision Research, vol. 38, no. 5,
pp. 743–761, 1998.
[51] S. J. Nowlan and T. J. Sejnowski, “Filter selection model for
motion segmentation and velocity integration,” Journal of the
Optical Society of America A, vol. 11, no. 12, pp. 3177–3200,
1994.
[52] S. J. Nowlan and T. J. Sejnowski, “A selection model for motion
processing in area MT of primates,” Journal of Neuroscience,
vol. 15, no. 2, pp. 1195–1214, 1995.
[53] S. Grossberg, E. Mingolla, and L. Viswanathan, “Neural
dynamics of motion integration and segmentation within and
across apertures,” Vision Research, vol. 41, no. 19, pp. 2521–
2553, 2001.
[54] E. Mingolla, “Neural models of motion integration and
segmentation,” Neural Networks, vol. 16, no. 5-6, pp. 939–945,
2003.
[55] S. Grossberg, “3-D vision and figure-ground separation by
visual cortex,” Perception and Psychophysics,vol.55,no.1,pp.
48–121, 1994.
[56] J. Berzhanskaya, S. Grossberg, and E. Mingolla, “Laminar
cortical dynamics of visual form and motion interactions
during coherent object motion perception,” Spatial Vision, vol.
20, no. 4, pp. 337–395, 2007.
[57] J. Chey, S. Grossberg, and E. Mingolla, “Neural dynamics of
motion grouping: from aperture ambiguity to object speed
and direction,” Journal of the Optical Society of America A, vol.
14, no. 10, pp. 2570–2594, 1997.
[58] E.Castet,J.Lorenceau,M.Shiffrar,andC.Bonnet,“Perceived
speed of moving lines depends on orientation, length, speed
and luminance,” Vision Research, vol. 33, no. 14, pp. 1921–
1936, 1993.
[59]R.T.Born,C.C.Pack,C.R.Ponce,andSI.Yi,“Temporal
evolution of 2-dimensional direction signals used to guide eye
movements,” Journal of Neurophysiology, vol. 95, no. 1, pp.
284–300, 2006.
[60] L. Lid
´
en and C. Pack, “The role of terminators and occlusion
cues in motion integration and segmentation: a neural
network model,” Vision Research, vol. 39, no. 19, pp. 3301–
3320, 1999.
[61] E. Koechlin, J. L. Anton, and Y. Burnod, “Bayesian inference
in populations of cortical neurons: a model of motion inte-
gration and segmentation in area MT,” Biological Cybernetics,
vol. 80, no. 1, pp. 25–44, 1999.
[62] C. Tomasi and R. Manduchi, “Bilateral filtering for gray and
color images,” in Proceedings of the 6th IEEE International
Conference on Computer Vision, pp. 839–846, Bombay, India,
January 1998.
[63] H. Neumann, “Completion phenomena in vision: a compu-
tational approach,” in Filling-in—From Perceptual Completion
to Cortical Reorganization, L. Pessoa and P. De Weerd, Eds., pp.
151–173, Oxford University Press, New York, NY, USA, 2003.