The Unofficial Guide to Real Estate Investing by Spencer Strauss and Martin Stone_4 docx
Bạn đang xem bản rút gọn của tài liệu. Xem và tải ngay bản đầy đủ của tài liệu tại đây (196.8 KB, 23 trang )
&20321(1762)5(7851
land and the existing structure that sits on it. Naturally, this drives
prices up. Rural areas, on the other hand, tend to have plenty of va-
cant land available. This greater availability of land makes it pretty
simple to find willing sellers; the end result is lower prices for real
estate in these areas.
Transferability refers to the ease of buying and selling any com-
modity. As you know, investments such as stocks and bonds are
fairly liquid because you can transfer them from one owner to an-
other pretty quickly. Real estate, on the other hand, can’t trade
hands nearly so fast. This is usually related to the number of poten-
tial buyers and the ability, or lack thereof, to find adequate financ-
ing. There may be many buyers and hundreds of lenders for the
modest two-bedroom/one bath home you are trying to sell, but how
many buyers and lenders would be interested or qualified to buy the
Chrysler Building? Significantly fewer.
Utility refers to the usability of property. With real estate, the
value of a property is directly related to its highest and best use. For
example, a small parcel of land in a residential area will probably
be limited by the potential value of the home that can be built on
it. A large commercial lot close to a highway entrance or a shipyard,
however, could be an extremely valuable location to build a manu-
facturing plant. According to this principle, the greater the utility
value, the greater the price of the property.
Finally, the demand principle of appreciation results from the
upward desirability of the property. This is the same phenomenon
that affects the price of tickets to any major event that sells out at a
moment’s notice. Think about the scalpers that roam the parking
lot of the Super Bowl or a Bruce Springsteen concert, for example;
the reason they are able to get top dollar for their tickets is because
the demand for their product is so great. If these scalpers were
hawking tickets to see a clown making balloon animals, odds are
they wouldn’t attract many top-dollar buyers.
6(&85(<285),1$1&,$/)8785(,19(67,1*,15($/(67$7(
General trends in the economy also play a significant role in
changes in demand. Many investors move from one investment
vehicle to another based on the investment’s ability to produce a
buck. When stocks are up, their money is there. When bond yields
increase, the stocks are sold for bonds. When real estate is moving,
they start buying. This sends the message to all the small investors
that it is time to buy. The end result is an increased demand for a
product that is in limited supply. In times like these, appreciation
rates naturally increase.
To give an example of how appreciation affects price, let’s
make an estimate using our example property. Remember, we
bought the example property for $279,000. We’ll assume the appre-
ciation rate is 5 percent per year. At that price, and with that appre-
ciation rate, the return looks like this:
We can calculate the percentage return for the first year of
ownership by dividing the appreciation by the down payment:
Appreciation $13,950 ÷ Down payment $8,370 = 166% Return
Yes, a 166 percent return isn’t half bad. Remember, we put
only 3 percent of the purchase price down to purchase this prop-
erty and the bank financed the balance. Therefore, leverage was
the reason we achieved such a phenomenal result. As you can see,
this modest appreciation rate of just 5 percent translated into a tre-
mendous return on our investment.
Price of Property $279,000
Appreciation Rate × 5%
Total Return $213,950
&20321(1762)5(7851
7$; %(1(),76
The fourth and final component of return is tax-sheltered ben-
efits. These benefits are the paper losses you can deduct from the
taxable income you receive from the property. Because you are the
owner of an investment property, the Internal Revenue Service
allots you an annual depreciation allowance to deduct against your
income. The premise is that this deduction will be saved up and
used to replace the property at the end of its useful life. For most
businesses, this is a necessary deduction because equipment like
fax machines and computers wears out after time. But when it
comes to real estate, most property owners don’t live long enough,
or keep their buildings long enough, for them to wear out. There-
fore, the tax saving from the deduction is a profit that is added to
your overall financial return.
There are a few different methods that you can use to deter-
mine your annual depreciation allowance. The most common
method relies on using the land-to-improvement ratios found on
your property tax bill. Don’t be concerned if the actual dollar
amount shown on the tax bill doesn’t mesh with what you’re pay-
ing for the property; it is the ratio we are looking for. The idea is to
use the ratio numbers to get the percentage you need to determine
the value of the improvements. To do this, use the following calcu-
lation:
Assessed improvement value ÷ Total assessed value
= % Value of improvements
Once you know the percentage value of the improvements,
you then multiply that by the sales price to get the amount of depre-
ciable improvements:
6(&85(<285),1$1&,$/)8785(,19(67,1*,15($/(67$7(
% Value of improvements × Price = Depreciable improvements
Keep in mind that you don’t have to establish your deprecia-
tion schedule until you file your tax return. In most cases, there will
usually be sufficient time between the property closing and the tax
filing deadline to discuss the method you want to use with your tax
professional.
02',),('$&&(/(5$7('&2675(&29(5<
6<67(0
(
0$&56
The tax code change in 1986 established the Modified Accel-
erated Cost Recovery System
(
MACRS). This code established the
recovery period, or useful life, of assets to be depreciated. Like
much of the government’s tax code, these periods usually bear no
correlation to reality with regard to the useful life of an asset. None-
theless, in the case of improved property there are two classes of
property and two recovery periods that were established. They are:
Note that it doesn’t matter what the true age of your property
is; if your property is residential, you use 27.5 years. If your prop-
erty is categorized as nonresidential, you use 39 years. Additionally,
when using this method of depreciation, you will have the same
amount of annual depreciation expense over the entire useful life
of the building. To arrive at the annual expense, you simply divide
the value of the depreciable improvements by the recovery period,
which gives you your deduction.
Type of Property Recovery Period/Useful Life
Residential 27.5 Years
Nonresidential 39 Years
&20321(1762)5(7851
Now let’s take a look at the calculation using the example
property. First we find the value of the improvements and then
divide that value by the recovery period. We are paying $279,000
for the property and are using the land and improvement ratios
from the tax bill as described earlier. The tax bill shows the
improvements assessed at $40,000 and the total assessed value of
the property at $65,000. We would then calculate the depreciation
allowance as follows:
$40,000 Improvements ÷ $65,000 Total assessed
value = 61.5% Improvements
We would then multiply the sales price by the improvement
percentage to get the amount of depreciable improvements:
$279,000 × 61.5% = $171,585 Depreciable improvements
Finally, to determine our annual appreciation allowance, we
divide the depreciable improvements by the recovery period:
$171,585 ÷ 27.5 = $6,239 Annual depreciation allowance
Before we can determine what kind of savings our deprecia-
tion allowance gives us, we first need to review two other code
changes made in the tax reform of 1986. They are important be-
cause these changes limit your ability to use the excess depreciation
to shelter the income from your other job.
The first new code change classifies real estate investors into
either “active” or “passive” investors. Passive investors are defined
as those who buy property as limited partners or with a group of
more than ten other partners. As a passive investor, you can use the
depreciation deduction to shelter any profit from the property. Any
excess write-off must be carried forward to be used as the profit
6(&85(<285),1$1&,$/)8785(,19(67,1*,15($/(67$7(
from the building increases. The theory is that this money is like
having a savings account of tax benefits that can be drawn on to
cover future profits.
An active investor is one who buys the property alone or with
just a couple of partners who are “materially participating” in the
management of the building. By materially participating, the IRS
means that you have a say in how the building runs. Even if you have
hired management to care for day-to-day operations, you materially
participate in the property and are an “active investor,” according
to the IRS, if the buck stops with you.
Additionally, the IRS has categorized investors into two differ-
ent types:
1. Those who invest in real estate in addition to their regular
career
2. Those who consider real estate investing and management
as their primary career
Most investors fall into the category in which real estate is
something they do in addition to their regular career. If this de-
scribes you, then your real estate losses will be limited to $25,000.
For example, your adjusted gross income before real estate deduc-
tions is $50,000 and your losses from property are $30,000. In this
scenario, you would only be able to deduct $25,000 of the $30,000.
But don’t fret; you don’t lose the remaining $5,000. Instead, it would
go into that tax-sheltered bank account mentioned earlier. What
this deduction means is that instead of paying tax on $50,000 of in-
come, you only pay tax on $25,000. And because the tax you save is
a profit, it is therefore included in the overall return from your in-
vestment.
From a realistic perspective, assuming your properties run at a
break-even cash flow or better, this threshold of $25,000 takes a
&20321(1762)5(7851
long time to reach. In fact, with the MACRS depreciation and an im-
provement ratio of 70 percent, you would have to own almost
$1,000,000 worth of property to reach $25,000 of excess deprecia-
tion. As your properties become more profitable, you can use more
of the depreciation to shelter the property income and have less to
shelter your regular career income.
Another code change from the Tax Reform Act of 1986 limits
your ability to use the losses from your real estate against the earn-
ings from your regular career. This limit applies when your earnings
exceed $100,000, after which you will lose $1 of deduction for
every $2 you earn over $100,000. This would mean that at $150,000
you would have no deduction against your income. But remember,
these are not lost; they are just saved for future use.
Now, knowing all that, let’s go back to our two-unit example
and calculate your tax benefit. We will assume you are an active
investor in the 28 percent federal tax bracket. To calculate your tax
savings, we need to first shelter the taxable profit from the prop-
erty. As you will recall, you have a taxable cash flow of $12 and a
taxable equity growth from loan reduction of $2,668 per year. We
calculate the carryover loss as follows:
The tax savings is calculated by multiplying the tax bracket by
the sheltered benefit:
Depreciation Allowance $6,239
Less Cash Flow – $6,212
Less Equity Growth – $2,668
Tax-sheltered Benefit $3,559
Tax-Sheltered Benefit $3,559
Tax Rate × 28%
Tax Savings $3,997
6(&85(<285),1$1&,$/)8785(,19(67,1*,15($/(67$7(
Besides federal taxes, many states require you to pay state
income tax. Their rules are usually similar to the federal rules when
it comes to deductions and depreciation. If you live in a state with
a tax, you will receive an additional savings, and you can use this
same formula to estimate those figures.
3877,1*,7$//72*(7+(5
Now let’s look at the total annual tax-deferred return combin-
ing all four components. You have a cash flow of $12, equity growth
from loan reduction of $2,668, equity growth from appreciation of
$13,950, and tax savings of $997. The calculation looks like this:
Because you only put $8,370 down with your FHA loan to pur-
chase the property, we can compute the total return as follows:
Total return $17,627 ÷ Down payment $8,370
= 210% Return on investment
At this point you probably doubt our sanity because of the
astronomical 210 percent return. One of our goals was to show that
it was possible to create some real wealth with a down payment
that is affordable to most people. Again, the reason we were able to
pull off such a feat is because we used leverage to buy the property
(
3 percent of your money, 97 percent of the bank’s money
)
. Note
that if you had put 20 percent down, the percentage return would
have been less—still significant but less than the 210 percent return
demonstrated above.
Cash Flow $13,212
Loan Reduction $12,668
Appreciation $13,950
Tax Savings + $13,997
Total Return $17,627
&20321(1762)5(7851
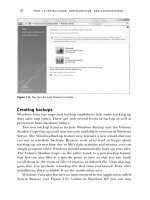
To save some arithmetic, there are many computer-generated
systems for calculating this return. Some are proprietary systems
written by their firms, and many are just modified spreadsheet sys-
tems. If you have access to one of these systems it will save time,
but having an automated system is not necessary. The worksheet in
Figure 5.1 will help you calculate the return yourself. All you need
is a calculator.
FIGURE 5.1
3523(57<$1$/<6,6:25.6+((7
Address:
Basic Return
1. Value of Property ______________
2. Loans on Property ______________
3. Equity in Property (Line 2 – Line 3)
4. Gross Income _________ Month
×
12 = ______________
5. Expenses _________ Month
×
12 = ______________
6. Loan Payments _________ Month
×
12 = ______________
7. Interest ( _________ Loan Amount
×
_______ %) = ______________
8. Loan Payoff (Line 6 – Line 7) = ______________
9. Cash Flow (Line 4 – Line 5 – Line 6) = ______________
10. Depreciation Deduction ______________
11. Tax Shelter (Line 10 – Line 9 – Line 8) ______________
12. Tax Savings (Tax Bracket _______ %
×
Line 11) = ______________
13. Building Profit (Line 8 + Line 9 + Line 12) = ______________
14. Basic Return (Line 13 ÷ Line 3) = ______________
Return on Equity
15. Cash Flow (Line 9) ______________
16. Loan Payoff (Line 8) ______________
17. Tax Savings (Line 12) ______________
18. Appreciation _______ %
×
Line 1 ______________
19. Total Investment Return (Lines 15 + 16 + 17 + 18) ______________
20. Return on Equity (Line 19 ÷ Line 3) ______________
CHAPTER 6
<285:,11,1*
/27 727,&.(7
“Long-range planning does not deal with future decisions,
but with the future of present decisions.”
² 3(7(5'58&.(5 $87+25
$
s you’ve noticed by now, our approach to real estate invest-
ing is pretty conservative. We’ve based our example property not
on helping you get rich but rather on trying to give you insight into
how a relatively small real estate purchase now could fund a safe
and plentiful life for you later. In fact, securing that kind of trouble-
free peace of mind is the primary reason so many Americans play
the lottery week after week. In Chapter 6, we’ll show you specifi-
cally why investing in real estate is akin to winning your own lot-
tery and, second, how to plan ahead so the numbers you choose
will come in.
<285:,11,1*180%(56
In the real world it’s no secret that it takes money to make
money. If you don’t have any money to invest, it’s going to be tough
to make a profit. That’s probably why the lottery is so popular; it
6(&85(<285),1$1&,$/)8785(,19(67,1*,15($/(67$7(
gives anyone with a buck a chance to be a millionaire. We don’t
have the magic solution for everyone; however, if you can manage
to save just enough to get started investing, at least you’ll give your-
self a fighting chance at retirement.
6+$5,1*7+(6(&5(76
Albert Einstein was once asked what the most powerful force
in the universe was; without hesitation, he answered, “Compound
interest.” Years before, Ben Franklin called compound interest “the
stone that will turn lead into gold.” Combine compound interest
with leverage and you get the two components that launch real
estate investing into a stratosphere all its own.
Whether we know it or not, compound interest is a fairly well-
known principle. If you put money in the bank, the bankers refer
to the amount of money you will earn in terms of the “yield.” Your
yield will be higher than the interest rate quoted on your account.
This is because the bank assumes you will be leaving the profit
(
interest
)
in the bank along with the original amount you invested.
The idea is you will earn interest on the interest. In the end, this
process raises the amount you earn on your original investment by
leaps and bounds.
A math lesson might help. Here is the formula for calculating
how much compound interest will increase your return:
FV = PV
(
1 + I
)
n
Don’t panic; this math really isn’t as overwhelming as it looks.
What’s more, most calculators have this formula built in so it’s a
snap for the average person to work out. Nonetheless, so you can
impress your friends and family, the components of the compound
interest algorithm translate this way:
FV =
F
uture
V
alue of the investment you make
<285:,11,1*/27727,&.(7
PV =
P
resent
V
alue of that investment
I = Average
I
nterest rate you earn on the investment
n = The
n
umber of years you keep your money invested
Simply, this formula will give you an estimate of what the
money you have today
(
PV
)
will be worth in the future
(
FV
)
. This
estimate is based on the percentage you earn
(
I
)
over the years
(
n
)
you have your money invested.
For example, if you had $10,000 to invest and could earn just
5 percent on it for the next 20 to 25 years, here’s how your money
would grow because of the effects of compound interest.
$10,000 @ 5% for 20 years = $26,533
$10,000 @ 5% for 25 years = $33,863
Pretty nice, isn’t it? But the story gets even better. To see the
real advantage to real estate investing we need to add the second
wealth-building concept into this equation: leverage. According to
Merriam Webster, leverage is defined as “an increased means of
accomplishing some purpose.” When it comes to investing, our
definition is “Making money using someone else’s money.” You’ve
probably heard this concept loosely referred to as “other people’s
money” or “OPM” for short.
What’s great is that the entire real estate industry is built around
encouraging the use of other people’s money to fund these types of
investments. The biggest proponent of the concept is the federal
government via the Federal Housing Administration
(
FHA
)
and the
Department of Veterans Affairs
(
VA
)
. The FHA and VA encourage
home ownership by offering financing for homebuyers with low or
no down payment programs. The purpose is to encourage people to
own their own home. These FHA and VA loans are nothing more
6(&85(<285),1$1&,$/)8785(,19(67,1*,15($/(67$7(
than loans designed to take advantage of leverage—leverage that is
encouraged by your government.
What’s amazing is that so many people take advantage of using
borrowed money to buy a home but never take advantage of this
idea to make any additional real estate investments that could se-
cure their future for good. These same homeowners marvel at how
much their home appreciates over the years, but when it comes to
long-term planning, this lightbulb always stays dim. So let’s get out
of the dark.
As you learned in the previous chapter, one of the great advan-
tages of real estate is that it offers several types of return. The cash
flow gives you something to spend today, yet the appreciation cre-
ates the big-time wealth for your future via the use of leverage. To
demonstrate the effect of leverage, let’s talk about just this one com-
ponent of return from real estate: value appreciation.
The value of property increases in most areas of the country
because of inflation and demand. Bread, milk, and gas seem to cost
more every year and, thankfully for real estate investors, so does
the price of housing. We call that value appreciation. Appreciation
rates vary all over the country, but regardless of where you live,
most areas always seem to have some steady increase in value as the
years go on.
(
Recall the value appreciation that took place in four
separate areas of the country in Chapter 4.
)
To demonstrate how
this will work to your benefit we’ll use a rate of 5 percent appreci-
ation for the following example. If you own a property worth
$100,000, this means that it will go up 5 percent in price every
year. If you paid all cash for your house, that means you earn 5 per-
cent on your $100,000, which is $5,000.
Paying all cash for a property, however, isn’t what makes real
estate investors money. Rather, it’s using leverage to its full advan-
tage that creates their real wealth. The idea is to use a little bit of
your own money, lots of someone else’s, and then reap the rewards
of 100 percent of the investment. Here’s an illustration of a return
<285:,11,1*/27727,&.(7
after one year of ownership assuming two different down payment
options. We’ll use a 20 percent down payment
(
the amount it
would take with a conventional loan
)
and a 3 percent down pay-
ment
(
offered on many properties through FHA
)
and factor in the
same modest 5 percent appreciation rate as before. Here is what is
possible:
As you can see, a return of 167 percent isn’t anything to scoff
at. Especially when you compare it to the meager returns you can
get on your money at the bank or credit union. Even the 25 percent
return from the 20 percent down payment scenario looks great
compared to most other investments. And remember, value appre-
ciation is only one component of return from an investment in real
estate. This investment, as you know, will help you make money
three other ways
(
cash flow, loan reduction, and tax benefits
)
, and
it’s the combination of all the returns that creates the kind of
money needed to fund a retirement worth smiling about.
For the pièce de résistance, let’s work that compound interest
formula again by adding leverage
(
your money + the borrowed
money
)
into the mix. Even though our example showed a 25 per-
cent return from appreciation alone, we will be ultraconservative
and scale back to just a 20 percent return.
$10,000 @ 20% for 20 years = $383,367
$10,000 @ 20% for 25 years = $953,962
Down Payment Appreciation
Percentage Return
on Down Payment
$20,000 $5,000 125%
$13,000 $5,000 167%
6(&85(<285),1$1&,$/)8785(,19(67,1*,15($/(67$7(
Yes, you read those numbers right. Amazing isn’t it? Though
we used the same $10,000 initial investment, our return this time
shot through the roof! In fact, so much so that you could fund a
pretty great future on those kinds of figures—all due to using com-
pound interest and its best friend, leverage.
Now that you can see how to hit the lottery, let’s learn how to
put together a plan so you can actually do it for yourself.
&20321(1762)<2853/$1
Although good investment plans do not start out in minute
detail, you should put your ideas down on paper from day one. To
get things started, buy yourself a sturdy three-ring binder to put
your plan in. This way, you can change the contents easily as you
make purchases and progress over the years. Divide your planning
binder into the following four sections:
1. Goals
2. General plan
3. Detailed plan
4. Follow-up and goal review
In the remainder of this chapter we will go over each of these
sections of your plan in detail.
*2$/6
This section of your plan is its lifeblood. Here you will lay out
your long-term investment goals and the time frame you have
<285:,11,1*/27727,&.(7
scheduled for their achievement. The goals section of your invest-
ment plan should be divided into the following five subsections:
1. Cash-flow requirements
2. Net-worth projections
3. Tax-sheltered benefits required
4. Cash withdrawal from plan
5. Other goals
Let’s look at each of these subsections one at a time.
&$6+ )/2:5(48,5(0(176
The cash-f low require-
ments refer to your cash-flow projections during and after comple-
tion of the plan. If you make enough money at your day job, you may
not need any cash flow from your real estate. If so, that would be
great as you’ll be able to plow any cash flow you create right back
into your buildings. On the other hand, a little bit of extra cash each
month might be just what you need. Your retirement fund will suf-
fer a bit, but your day-to-day existence will be all the better for it.
The point at which you will begin to achieve a significant cash
flow depends on two things:
1. The initial amount of cash you invest in the plan
2. How well you manage your plan
Cash flow is generated from a property in two ways. The first
is by looking at what remains after you pay all the expenses and out-
standing loans each month. This cash flow should increase yearly
as you increase rents. By the time you retire, this cash f low can be
considerable, depending on the amount of financing you have left
on your buildings.
6(&85(<285),1$1&,$/)8785(,19(67,1*,15($/(67$7(
The second source of cash flow comes from the eventual sale
of the building and carrying your equity as a note against the prop-
erty. As a general rule, the cash flow at that time will be equal to
the going rate of interest multiplied by the net equity of your prop-
erty. For many retirees, selling their buildings and carrying some
(
or all
)
of the paper will give them a much higher return on their
nest eggs as compared to the typical savings account, certificate of
deposit, or other investment.
Another benefit is that by carrying the financing on a prop-
erty, you postpone the capital gains taxes due. Uncle Sam says that
as long as you’re receiving interest only and not getting any princi-
pal payments, your capital gains tax will be postponed because the
government considers this an installment sale.
<285)8785(1(7:257+
Your net - worth projection
is the amount of money you want to be worth at the end of a given
period of time. If your lump-sum gap from Chapter 2 showed that
you were $500,000 short for retirement, your net-worth projection
might look like this:
“Attain a net worth of $500,000 for retirement at the
end of a 15-year real estate investment plan.”
As we have shown, net worth and cash flow are related. In
cases where your investment plan is set up as a retirement vehicle,
your net-worth projections will probably be 10 to 12 times your
net annual cash-flow requirements. This assumes that at the time
of retirement you will be able to locate savings investments that
offer yields of from 8 to 10 percent per annum. Based on the avail-
able returns for the past 10 to 20 years, this is a pretty reasonable
assumption.
You may wish to set your net-worth projections for reasons
other than just cash-flow requirements. Remember all the extras
<285:,11,1*/27727,&.(7
we thought up at the end of Chapter 2, things such as cabins, boats,
and college tuition for grandchildren? This is where you declare
that those things will happen—by factoring the necessary money
into your projection. By putting it down on paper today, you’ll set
the stage for it to come true tomorrow.
7$;% (1(),76
In this section of your planning binder you
should write out what kinds of tax benefits you plan to achieve.
Tax-sheltered benefits in real estate investments are complicated
and can vary widely. Therefore, we have devoted an entire chapter
later in this book to this subject. For now, we will provide a few
necessary guidelines for you to keep in mind:
We don’t recommend that you buy real estate for tax benefits
only. Even though there are lots of great tax advantages to
owning investment real estate, many of them have been
diluted with the tax law changes in the late 1980s.
It is important to consider the amount of depreciable
improvements when making your final decision on which
building to purchase. Remember that the property with the
highest land-to-improvement ratio will give you the highest
write-off and, thus, the best return.
If necessary, consider using installment sales to create cash
flow during the life of your plan.
Use 1031 tax-deferred exchanges to grow your nest egg.
Given these guidelines, a reasonable tax goal might be as fol-
lows:
“Maximize tax benefits on real estate purchases, and
use 1031 tax-deferred exchange and installment sales
when available.”
6(&85(<285),1$1&,$/)8785(,19(67,1*,15($/(67$7(
&$6+:,7+'5$:$/
It’s important to plan in advance for
periods when you may want or need to take cash out of your plan.
This will give you the opportunity to make provisions for planned
expenditures long before you ever need to come up with the money
to pay for them. You could put aside money for your children’s edu-
cation, the trip to Australia you’ve always wanted to take, buying a
sailboat, or building that vacation home on the lot you own in the
desert. Building in perks for yourself is one of the most important
parts of a successful plan and a great way to stay connected to your
plan’s ultimate success.
Sometimes you may have enough money in your property
accounts to pay for the things you want. If that’s the case, then
you’ll be able to keep the status quo on your buildings and still dip
in for some of the things you want. Alternatively, significant cash
withdrawals can occur in two ways:
1. By selling your property
2. By refinancing your property
27+(5*2$/6
This section covers other things you would
like to accomplish with some of the earnings from your real estate
investments. These could involve donations to charity or help to
family and friends. Examples of these types of goals are:
Buying a time-share condominium as a wedding present for
the kids when they get married.
Donating 10 percent of the expected proceeds from the sale
of the Lawndale duplex to Notre Dame’s scholarship fund.
Purchasing a new theater curtain for the local playhouse.
<285:,11,1*/27727,&.(7
7+(*(1(5$/3/$1
Your general plan will spell out in one sentence how you will
achieve your goals over the period of time set forth in your plan. As
we have already seen, setting future net worth at a given interest
rate also sets future cash flow. Therefore, we will concentrate most
of our discussion of the general plan on achieving a given future
net worth.
Here is the template for your general plan:
“I am going to invest $ ____________________ for
_________ years in real estate investments at a sustained
rate of return of _______ % and be worth $ _____________
at the end of the plan term.”
The first step in developing this general plan is figuring out
what you can reasonably expect to earn. We teased you with what
is possible earlier and now we will show you the real numbers in
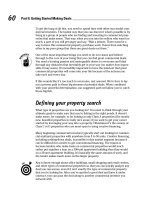
earnest. The chart in Figure 6.1 shows various combinations of the
compound interest formula. It will quickly give you an idea of the
kind of future equities you might expect at various times with dif-
fering investment amounts.
Going down the left column
(
Present Value
)
, locate the amount
you originally plan to invest in real estate; let’s say it’s $10,000. Move
over one column to the right to locate the number of years you plan
on being invested
(
n
)
; for this example we’ll say it will be 20. The
columns to the right of that number are the future values
(
FV
)
based
on the interest you will be earning
(
I
)
. Here we are being pretty con-
servative and projecting an average return of 20 percent for your
real estate investments. This gives us a final value at the end of 20
years of $383,376. These numbers don’t lie—feel free to do the math
and see for yourself how they add up. What’s more, go ahead and
make copies of this chart and post them above your bed, for these
are the numbers that will help you quit your day job for good.
6(&85(<285),1$1&,$/)8785(,19(67,1*,15($/(67$7(
Now that you can see how compound interest will be your
best friend, let’s pull all this work together and set your general
plan. There are three steps in the process:
1. Determine how much cash you have available to invest
comfortably.
2. Set the achievability of your future net worth.
FIGURE 6.1
3UHVHQW 9DOXH)XWXUH 9DOXH&KDUW
Present
Value
Number
of Years
Interest =
10%
Interest =
20%
Interest =
30%
Interest =
40%
$10,000 5 $216,105 $2,224,883 $16,737,129 $16,753,782
10 $225,937 $2,261,917 $50,137,858 $50,289,255
15 $241,772 $2,154,070 $50,511,859 $21,555,681
20 $267,275 $2,383,376 $21,900,496 $28,366,826
$20,000 5 $232,210 $2,249,766 $16,774,259 $50,107,565
10 $251,875 $2,123,835 $50,275,717 $50,578,509
15 $283,545 $2,308,140 $21,023,718 $23,111,362
20 $134,550 $2,766,752 $23,800,993 $16,733,651
$30,000 5 $248,315 $2,274,650 $50,111,388 $50,161,347
10 $277,812 $2,185,752 $50,413,575 $50,867,764
15 $125,317 $,2462,211 $21,535,577 $24,667,043
20 $201,825 $1,150,128 $25,701,489 $25,100,477
$40,000 5 $264,420 $2,299,533 $50,148,517 $50,215,130
10 $103,750 $2,247,669 $50,551,434 $21,157,019
15 $167,090 $2,616,281 $22,047,436 $26,222,724
20 $269,100 $1,533,504 $27,601,986 $33,467,302
$50,000 5 $280,526 $2,124,416 $50,185,647 $50,268,912
10 $129,687 $2,309,587 $50,689,292 $21,446,273
15 $208,862 $2,770,351 $22,559,295 $27,778,405
20 $336,375 $1,916,880 $29,502,482 $41,834,128
$60,000 5 $296,631 $2,149,299 $50,222,776 $50,322,694
10 $155,625 $2,371,504 $50,827,151 $21,735,528
15 $250,635 $2,924,421 $23,071,154 $29,334,086
20 $403,650 $2,300,256 $11,402,978 $50,200,953
<285:,11,1*/27727,&.(7
FIGURE 6.2
75$16$&7,21$/326,7,21:25.6+((7² %/$1.
Starting Year ________
Transactional Position for Real Estate Retirement Plan
Yea r
of
Plan
Market
Value
Total
Equity Income
Oper’g
Exp’s
Total
Interest
Amorti-
zation
Cash
Flow
Appre-
ciation
Tax
Rebate
Return
on
Equity
(ROE)
%
Avg.
Return
on
Equity
%
Actual Actual
__%
×
Yea rly
Increase
__%
×
Yea rly
Increase Actual Actual Actual
__%
×
Market
Value Actual
21
______ ______ ______ ______ ______ ______ ______ ______ ______ ______ ______
12
______ ______ ______ ______ ______ ______ ______ ______ ______ ______ ______
13
______ ______ ______ ______ ______ ______ ______ ______ ______ ______ ______
14
______ ______ ______ ______ ______ ______ ______ ______ ______ ______ ______
15
______ ______ ______ ______ ______ ______ ______ ______ ______ ______ ______
16
______ ______ ______ ______ ______ ______ ______ ______ ______ ______ ______
17
______ ______ ______ ______ ______ ______ ______ ______ ______ ______ ______
18
______ ______ ______ ______ ______ ______ ______ ______ ______ ______ ______
19
______ ______ ______ ______ ______ ______ ______ ______ ______ ______ ______
10
______ ______ ______ ______ ______ ______ ______ ______ ______ ______ ______
11
______ ______ ______ ______ ______ ______ ______ ______ ______ ______ ______
12
______ ______ ______ ______ ______ ______ ______ ______ ______ ______ ______
13
______ ______ ______ ______ ______ ______ ______ ______ ______ ______ ______
14
______ ______ ______ ______ ______ ______ ______ ______ ______ ______ ______
15
______ ______ ______ ______ ______ ______ ______ ______ ______ ______ ______
16
______ ______ ______ ______ ______ ______ ______ ______ ______ ______ ______
17
______ ______ ______ ______ ______ ______ ______ ______ ______ ______ ______
18
______ ______ ______ ______ ______ ______ ______ ______ ______ ______ ______
19
______ ______ ______ ______ ______ ______ ______ ______ ______ ______ ______
20
______ ______ ______ ______ ______ ______ ______ ______ ______ ______ ______