Trade secrets at the market of Forex_3 pot
Bạn đang xem bản rút gọn của tài liệu. Xem và tải ngay bản đầy đủ của tài liệu tại đây (207.5 KB, 14 trang )
TRADE SECRETS
28
Housing Starts and New and Existing Home Sales. These
reports provide another gauge of consumers’ willingness to spend and
the increasingly significant effect that housing has on the economy.
People have to feel pretty comfortable and confident in their financial
position to buy a home. More housing means more demand for raw
materials such as lumber or copper and for appliances and all the
other items needed to build and maintain a home. Sales of all those
items affect economic growth and, in turn, the course of the U.S. dollar.
Durable Goods Orders. With increases in new housing and home sales
comes the need to furnish those houses with refrigerators, washers, dryers,
other appliances, carpets, couches, and other big-ticket items. Orders
for these “durable goods” provide an indication of how busy factories
will be and how much money they will have to feed into the economy.
Construction Spending. This report analyzes spending for office
buildings, shopping malls, and other business purposes. As with
the housing market and consumer confidence, the amount of build-
ing construction reflects how confident business owners are about
the economy. They are likely to build new facilities or factories
only if they think business will be good enough to justify expansion.
Institute of Supply Management (ISM) Index. This is one of the first
reports each month that provides a composite index of national manu-
facturing conditions. Generally, analysts view index readings above
50% as an indication of an expanding factory sector and readings below
50% as a sign of a contracting manufacturing sector. Often, as manu-
facturing goes, so goes employment, which can have a major effect on
other components of economic health. ISM reports are also available for
various sectors and regions of the country, with the Chicago Purchasing
Manager Index regarded as an early indicator of the national figure.
Industrial Production and Capacity Utilization. Industrial pro-
duction measures the physical output of the nation’s factories, mines,
29
FOREX TRADING USING INTERMARKET ANALYSIS
and utilities while capacity utilization estimates how much of factory
capacity is actually being used. The manufacturing sector accounts for
about a quarter of the U.S. economy. Factories would naturally like to
maximize their usage, but if the rate of capacity utilization rises above
85 percent, analysts begin to worry that it could indicate an economy
that is getting “over heated” and could lead to inflationary pressures.
Factory Orders. This report combines the dollar level of new orders for
both durable and non-durable goods and also reflects the health of the man-
ufacturing sector and, in turn, its effect on the job market and other areas.
Business Inventories. Once a factory produces goods, they have
to be sold to businesses and consumers to produce profits. What is
left on the shelves of manufacturers, wholesalers, and retailers is
an indication of how strong or weak economic demand is and pro-
vides clues about the direction of factory production in the future.
Personal Income and Personal Spending. Comparing the estimated
dollar amount of income received with the amount of dollars spent on
durable and non-durable goods and services provides a good clue about
whether consumers will be able to spend more or less in the future. If
spending exceeds income, buying will naturally slow, perhaps leading to
a downturn in the economy. If consumers have a surplus of income over
spending, they will have money to buy more goods or bid up prices or
put into investments such as stocks or savings accounts. Following the
money trail is a good way to monitor a country’s economic well-being.
INTERNATIONAL WATCH LIST
Because of the dominant role of the U.S. dollar in forex trading, the
U.S. reports and events listed above tend to get much of the atten-
tion in the financial press. Forex traders also must keep an eye on
developments in other nations with major currencies in the world’s
forex markets.
TRADE SECRETS
30
JAPAN
The Ministry of Finance (MoF) is probably the single most important
political and monetary institution in Japan and, in fact, the world
when it comes to guiding forex policy. It may take just a statement
from a MoF official about the economy or the value of the yen to drive
the forex market. Japan has been the most active country in using
intervention or threats of intervention to protect against undesirable
appreciation/depreciation of the yen.
The Bank of Japan (BoJ), Japan’s central bank, has considerable inde-
pendence for some aspects of monetary policy such as the overnight
call rate for short-term interbank rates. The BoJ uses the call rate
to signal monetary policy changes, which impact the currency. The
BoJ also buys ten-year and twenty-year Japanese Government Bonds
(JGBs) every month to inject liquidity into the monetary system. The
yield on the benchmark ten-year JGB serves as a key indicator of
long-term interest rates. The difference between ten-year JGB yields
and those on U.S. ten-year Treasury notes is an important driver of the
USD/JPY exchange rates.
Another Japanese government institution that has an impact on the
forex market is the Ministry of International Trade and Industry
(MITI). MITI looks after the interests of Japanese industry and defends
the international trade competitiveness of Japanese corporations. It
formerly played a bigger role than now in forex markets.
In addition to the normal stream of data (i.e., GDP, trade numbers) that
affect most currencies, perhaps the most important economic report
from Japan is the quarterly Tankan survey of business sentiment and
expectations.
31
FOREX TRADING USING INTERMARKET ANALYSIS
EUROPE
The single most important financial agency in Europe is the European
Central Bank (ECB), which sets interest rates to maintain an eco-
nomic growth rate of about 2 percent. In light of votes by several
countries to reject a common constitution for the European Union, the
authority and role of the ECB is not as clear as that of, say, the U.S.
Federal Reserve.
Europe is comprised of a number of diverse economies and nations,
which are still trying to work through the process of forming the
European Union. A forex trader may be able to look at composite eco-
nomic statistics for Europe but also has to keep in mind the numbers
for Germany, France, Italy, and a number of other individual nations.
What may help one nation could hurt another and vice versa.
Although the effect of some policies and decisions by European offi-
cials in Brussels may not be so clear, ECB actions in setting interest
rates and determining other financial matters seem to be more accepted
by financial traders. As a result, the euro has already become a major
factor in the forex market although it was only launched on January
1, 1999. Even with its short history, the euro is considered by more
countries as a possible reserve currency in place of, or in addition to,
the U.S. dollar. It is one of the most actively traded currencies today.
ENGLAND
The Bank of England (BoE) is the central bank that sets monetary
policy to achieve price stability for that nation, with an objective of
maintaining the Treasury’s inflation target at 2.5% of annual growth in
the Retail Prices Index (RPI-X), excluding mortgages. The BoE has
a monetary policy committee that makes decisions on the minimum
lending rate (base interest rate), which it uses to send clear signals on
TRADE SECRETS
32
monetary policy changes during the first week of every month. Changes
in the base rate usually have a large impact on sterling.
The spread between the yield on ten-year government bonds, known
as gilt-edged securities or just gilts, and the yield on the ten-year
U.S. Treasury note usually impacts the exchange rate. The difference
between futures contracts on three-month eurodollar and eurosterling
deposits is an essential variable in determining GBP/USD expecta-
tions. The spread differential between gilts and German bunds is also
important because of its effect on the EUR/GBP exchange rate, natu-
rally the most important cross-rate because of the United Kingdom’s
close relationship with developments in Europe.
SWITZERLAND
The Swiss National Bank (SNB) sets monetary and exchange rate
policy. The SNB sets its targets for the Swiss franc based on annual
inflation rates. However, the Swiss franc is unique among curren-
cies in that it is often considered a safe-haven investment in times of
international turmoil and geopolitical tension. Forex traders may flock
into the Swiss franc at the expense of other currencies as a way to ride
temporarily through some international crisis, depending on traders’
views about the seriousness of the situation.
The Swiss franc has historically enjoyed an advantageous role as a
“safe” asset due to the SNB’s independence in preserving monetary
stability, secrecy of the nation’s banking system, and the neutrality
of Switzerland’s political position, whether the world is at war or at
peace. In addition, the SNB is known to have large gold reserves that
contribute to the franc’s solidity. Because of the proximity of the Swiss
economy to the Eurozone (specifically Germany), the Swiss franc tends
to be highly correlated with the euro, providing one of the most aligned
currency pairs in the forex market.
33
FOREX TRADING USING INTERMARKET ANALYSIS
HOW CAN TRADERS KEEP UP?
When you look back over the preceding list of fundamental factors—
the known and the unknown, the events and reports—you have to
conclude that forex traders trading on the basis of fundamentals have
an enormous amount of information to monitor and digest, especially
if they are involved in more than one or two forex markets. There is a
way that you can include all of these fundamentals in your trading by
observing just one thing: price, which is covered in Chapter 4.
4
Traders may find the long list of fundamentals that affect forex trading
introduced in Chapter 3 somewhat daunting. That is why many traders
tend to prefer technical analysis, a study of price action that can be
applied to any market.
Technical analysis combines the influence of all the fundamentals
affecting a market into one element, the current price. Rather than
keeping up with all the fundamentals, traders can analyze price move-
ments on a chart, knowing that the price synthesizes every factor
known to the market at the present time—at least, in the perception of
traders. Price is the visible reflection of all underlying market forces,
much like limbs and branches are the visible parts of a tree while fun-
damentals are the roots that feed and nourish the tree’s growth.
The information that forex traders really need for their technical analy-
sis boils down to the answers to the following four questions:
• Inwhichdirectionisthemarketheading?
• Howstrongwillthemovebe?
• Whenwillthecurrenttrendloseitsstrength,creatinga
top or a bottom?
• Whatwilltomorrow’shigh/lowtradingrangebe?
APPLYING
TECHNICAL
ANALYSIS TO
FOREX
35
TRADE SECRETS
36
Fundamental analysis alone cannot provide these answers, especially
when traders are looking at only one market at a time.
In an effort to find the answers to these questions, new traders seem to
follow the same path. After attempting to analyze and understand the
fundamentals of a market, they realize that it is virtually impossible for
individual traders to match their knowledge of the fundamentals with
the professionals in the marketplace. Even for one market there are
just too many fundamental factors with which to keep up in a timely
manner.
STARTING WITH CHART ANALYSIS
Many traders start with basic chart analysis such as trendlines and
chart patterns. Perhaps they were enticed by the if-you-bought-here-
and-then-sold-there arrows in a promotional piece that showed them
how they could become independently wealthy based on a hypotheti-
cal track record. Such tempting “pitches” may spur them into reading
introductory books or magazine articles or viewing a video trading
course. Much of the basic charting educational material today has
not changed in more than thirty years except for the updated charts,
graphs, and revised hypothetical track records.
Traders new to technical analysis are usually first advised to find the
price trend. This is a particularly important tip for the forex trader as
long-term trends tend to persist in currencies as compared to many
other markets because government policies and economic develop-
ments usually do not change that dramatically overnight. So forex trad-
ers should always have in mind one of the technical analyst’s favorite
phrases, “The trend is your friend.”
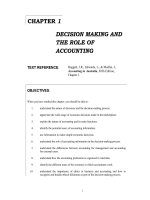
However, identifying the trend is not as easy as it sounds as a look at
the chart of the Canadian dollar in Figure 4.1 illustrates. Looking back
at the price action from the right side of the chart, the downtrend from
37
FOREX TRADING USING INTERMARKET ANALYSIS
March until late May and the uptrend from mid-May to August seem
rather obvious. However, viewing the chart from the left side as the
price action unfolds daily, where would a trendline be placed? That is
a subjective decision technical traders have to make.
If the trendline is placed too tightly along the tops or bottoms and trad-
ing decisions are based on penetrations of the trendline, traders are
likely to be in and out of positions several times, which could prove
costly. If the trendline is placed too far above or below the unfolding
price action, this could also be harmful to a trader’s account. In this
case, a trendline along the initial lows in May, long before an uptrend
was evident, would have meant the highs in July and August were well
over three full points or $3,000 above the trendline. This means trad-
ers would have surrendered a large potential profit if they waited for
prices to fall and penetrate the trendline to exit a long position.
Fi g u r e 4.1.
Source: VantagePoint Intermarket Analysis Software (www.TraderTech.com)
where should a trendline go? it may seem Clear where a trendline
should be drawn in hindsight on this Canadian dollar Chart, but the
teChniCal trader’s Challenge is deCiding where to plaCe a trendline as
priCe aCtion unfolds.
TRADE SECRETS
38
ART, NOT SCIENCE
With such erratic up and down price movement, it usually does not
take long for many traders to realize that chart analysis is a lot more art
than science. This is evident with other chart patterns as well.
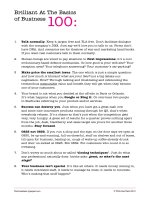
One popular chart formation that gets a lot of attention is the head-
and-shoulders bottom or top (Figure 4.2). Traditional technical analy-
sis says that a break of the neckline projects an additional move from
the neckline equal to the distance from the top of the head to the
neckline—in this case, roughly four points between the head and the
neckline on the EUR/USD chart. Added to the neckline, the projected
target is about 127. Is this really a head-and-shoulders bottom after
prices kicked back below the neckline to test that breakout point? It
is too early to jump to that conclusion on this chart. Meanwhile, the
trader is left in a quandary about the market’s prospects for becoming
an uptrend.
Source: VantagePoint Intermarket Analysis Software (www.TraderTech.com)
Chart patterns suCh as “head-and-shoulders” provide priCe Clues. it may
be a subjeCtive observation on this euro Chart, but this is a head-and-
shoulders, a Chart formation popular in traditional teChniCal analysis
that helps traders spot breakout points and potential priCe targets.
Fi g u r e 4.2.
39
FOREX TRADING USING INTERMARKET ANALYSIS
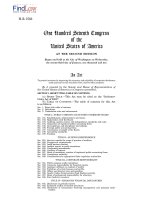
The USD/CHF pair in Figure 4.3 provides a few more examples of
chart patterns. First is the flag, a brief correction in the uptrend that
traditional analysis suggests is the halfway point of the move. At the
time the flag occurs, that is not known, of course, but in this case that
market axiom did turn out to be a correct assessment of the situation.
The next pattern in Figure 4.3 is the double top or M top (turn the
formation upside down, and you have a double bottom or W bottom).
The market hits a high, backfills, and then makes a new run at that
high, which proves to be tough resistance. With the M top, the second
high is usually lower than the first high. When prices drop below the
interim low, the top is confirmed, and a downtrend is expected. As with
the head-and-shoulders pattern above, prices do not exactly cooper-
ate, rallying back to the breakout line on this chart. Such is the fickle
nature of chart patterns.
Source: VantagePoint Intermarket Analysis Software (www.TraderTech.com)
Fi g u r e 4.3.
Chart formations Come in many forms. this Chart of the usd/Chf pair
features several Common teChniCal analysis patterns—a flag forma-
tion that sometimes oCCurs at the midpoint of a trending move, an m
top that suggests sell when the interim low is broken, and a 50 perCent
retraCement of a prior move that often aCts as a support level.
TRADE SECRETS
40
The third technical analysis point to note on Figure 4.3 is a 50%
retracement of the upmove, which technical analysts traditionally see
as a strong support area. In this case, it was. Prices bounced off that
support on schedule, just as analysts who look for that type of retrace-
ment would have expected. It is one of several retracement areas that
analysts project by using Fibonacci numbers and ratios.
Having prices perform as technical analysts expect them to is far from
a sure thing. Spotting trendline breaks and top or bottom formations
tends to be quite subjective, relying on the eye of the beholder. Chart
signals usually are not as obvious as they might seem when you look
at the price action with the benefit of hindsight. Even if you recognize
a chart pattern, interpreting what it projects and then making a trading
decisions based on that analysis are just as subjective. Because the
chart pattern aspect of technical analysis is so subjective, back-testing
is not really possible, so there is no way to measure the accuracy of
this method of analysis.
ADDING TECHNICAL INDICATORS
Traders then typically start to look for something more quantitative on
which to base their analysis. In looking beyond basic chart patterns,
many traders turn to technical indicators, which may be able to detect
changes in market momentum or strength or weakness that are not
obvious when looking at a price chart. Many of today’s analytical soft-
ware packages usually include dozens of built-in indicators that are
just a click of a mouse away so you do not have to do the calculations
yourself or even comprehend how they were computed. Although these
indicators can be back-tested and can be helpful in market analysis,
they do share some general shortcomings:
• First, most are based on only one thing: past prices. As
a result, they are all lagging indicators and not forward-
looking indicators.
41
FOREX TRADING USING INTERMARKET ANALYSIS
• Second, using several indicators together may improve trad-
ers’ perspective, but because they are looking at basically
the same thing, adding more indicators does not necessar-
ily result in better analysis. In fact, it may lead to another
technical analyst’s catch phrase, “Paralysis by analysis,”
which may cause traders to “freeze” and actually make it
harder to make a trading decision.
• Third, it is easy to curve-fit or over-optimize the parameters
of an indicator to the past price action. When traders exam-
ine historical price data, they may adjust the parameters to
find those that performed best in the past, only to discover
that they do not work quite so well in actual trading.
• Finally, no matter what traders may see in promotional
material, no one indicator is the elusive Holy Grail for
traders, because there just is no such thing as the Holy
Grail.
MOMENTUM OR TREND-FOLLOWING?
Technical indicators can be broken down into two broad categories:
• Momentum oscillator types that attempt to spot market
turns in the early stages and are typically based on a scale
from 0 to 100. These indicators include stochastics, %R,
relative strength index, rate of change, and a number of
others.
• Trend-following types that attempt to detect the trend and
the strength or weakness of the trend. These indicators
include moving averages, moving average convergence
divergence (MACD), and directional movement index
including the ADX indicator, which measures the trendi-
ness of a market. Moving average crossovers can also be