Full List of Management Accounting for Decision Makers_3 pptx
Bạn đang xem bản rút gọn của tài liệu. Xem và tải ngay bản đầy đủ của tài liệu tại đây (995.85 KB, 33 trang )
CHAPTER 2 RELEVANT COSTS FOR DECISION MAKING
42
A business is considering making a bid to undertake a contract. Fulfilment of the con-
tract will require the use of two types of raw material. Quantities of both of these mater-
ials are held by the business. If it chose to, the business could sell the raw materials
in their present state. All of the inventories of these two raw materials will need to be
used on the contract. Information on the raw materials concerned is as follows:
Inventories item Quantity Historic cost Sales value Replacement cost
(units)(£/unit)(£/unit)(£/unit)
A1 500 5 3 6
B2 800 7 8 10
Inventories item A1 is in frequent use in the business on a variety of work.
The inventories of item B2 were bought a year ago for a contract that was aban-
doned. It has recently become obvious that there is no likelihood of ever using this raw
material if the contract currently being considered does not proceed.
Management wishes to deduce the minimum price at which the business could
undertake the contract without reducing its wealth as a result. This can be used as the
baseline in deducing the bid price.
How much should be included in the minimum price in respect of the two invent-
ories items detailed above?
The relevant costs to be included in the minimum price are:
Inventories item: A1 £6 × 500 = £3,000
B2 £8 × 800 = £6,400
We are told that the item A1 is in frequent use and so, if it is used on the contract, it will
need to be replaced. Sooner or later, the business will have to buy 500 units (currently
costing £6 a unit) additional to those which would have been required had the contract not
been undertaken.
We are told that item B2 will never be used by the business unless the contract is
undertaken. Thus, if the contract is not undertaken, the only reasonable thing for the busi-
ness to do is to sell the B2. This means that if the contract is undertaken and the B2 is
used, it will have an opportunity cost equal to the potential proceeds from disposal, which
is £8 a unit.
Note that the historic cost information about both materials is irrelevant and this will
always be the case.
Activity 2.4
M02_ATRI3622_06_SE_C02.QXD 5/29/09 10:34 AM Page 42
Real World 2.2 gives an example of how opportunity costs can affect student
demand for MBA courses.
RELEVANT COSTS: OPPORTUNITY AND OUTLAY COSTS
43
HLA Ltd is in the process of preparing a quotation for a special job for a customer. The
job will have the following material requirements:
Units currently held in inventories
Material Units Quantity Historic cost Sales value Replacement cost
required held (£/unit)(£/unit)(£/unit)
P 400 0 – – 40
Q 230 100 62 50 64
R 350 200 48 23 59
S 170 140 33 12 49
T 120 120 40 0 68
Material Q is used consistently by the business on various jobs.
The business holds materials R, S and T as the result of previous overbuying. No
other use (apart from this special job) can be found for R, but the 140 units of S could
be used in another job as a substitute for 225 units of material V that are about to be
purchased at a price of £10 a unit. Material T has no other use, it is a dangerous mater-
ial that is difficult to store and the business has been informed that it will cost £160 to
dispose of the material currently held.
If it chose to, the business could sell the raw materials already held in their present
state.
What is the relevant cost of the materials for the job specified above?
The relevant cost is as follows:
£
Material P
This will have to be purchased at £40 a unit (400 × £40). 16,000
Material Q
This will have to be replaced, therefore the relevant price is (230 × £64). 14,720
Material R
200 units of this are held and these could be sold. The relevant price of
these is the sales revenue forgone (200 × £23). 4,600
The remaining 150 units of R would have to be purchased (150 × £59). 8,850
Material S
This could be sold or used as a substitute for material V.
The existing inventories could be sold for £1,680 (140 × £12); however,
the saving on material V is higher and therefore should be taken as the
relevant amount (225 × £10) 2,250
The remaining units of material S must be purchased (30 × £49) 1,470
A saving on disposal will be made if material T is used (160)
Total relevant cost 47,730
Activity 2.5
M02_ATRI3622_06_SE_C02.QXD 5/29/09 10:34 AM Page 43
A sunk cost is simply another way of referring to a past cost and so the terms ‘sunk
cost’ and ‘past cost’ can be used interchangeably. A committed cost is also, in effect, a
past cost to the extent that an irrevocable decision has been made to incur the cost
because, for example, a business has entered into a binding contract. As a result, it is
more or less a past cost despite the fact that the cash may not be paid in respect of it
until some point in the future. Since the business has no choice as to whether it incurs
the cost or not, a committed cost can never be a relevant cost for decision-making
purposes.
It is important to remember that, to be relevant, a cost must be capable of varying
according to the decision made. If the business is already committed by a legally bind-
ing contract to a cost, that cost cannot vary with the decision.
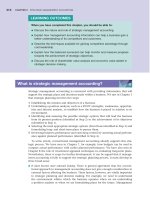
Figure 2.1 summarises the relationship between relevant, irrelevant, opportunity,
outlay and past costs.
Sunk costs and committed costs
CHAPTER 2 RELEVANT COSTS FOR DECISION MAKING
44
‘
‘
Past costs are irrelevant costs. Does this mean that what happened in the past is
irrelevant?
No, it does not mean this. The fact that the business has an asset that it can deploy in the
future is highly relevant. What is not relevant is how much it cost to acquire that asset. This
point was examined in the discussion that followed Activity 2.1.
Another reason why the past is not irrelevant is that it generally – though not always –
provides us with our best guide to the future. Suppose that we need to estimate the cost
of doing something in the future to help us to decide whether it is worth doing. In these
circumstances our own experience, or that of others, on how much it has cost to do the
thing in the past may provide us with a valuable guide to how much it is likely to cost in
the future.
Activity 2.6
REAL WORLD 2.2
MBA
==
massive bonuses absent
By 2008, the slowdown in business in the City (of London) had an effect on the level of
recruitment on MBA (Master of Business Administration) courses. When business in the
City is booming, many of the people who might be attracted to undertake an MBA feel that
the cost of doing so is too great.
When financial markets slow down, the demand for MBA courses tends to pick up.
According to Professor Alan Morrison of the Said Business School, University of Oxford,
when city bonuses fall, ‘the opportunity cost of doing an MBA is reduced’.
Source: Tieman, R., ‘Demand hots up despite cool market’, Financial Times, 16 June 2008.
FT
M02_ATRI3622_06_SE_C02.QXD 5/29/09 10:34 AM Page 44
Though businesses must look closely at the obvious financial effects when making
decisions, they must also consider factors that are not directly economic. These are
likely to be factors that have a broader, but less immediate, impact on the business.
Ultimately, however, these factors are likely to have economic effects – that is, to affect
the wealth of the business.
Qualitative factors of decisions
QUALITATIVE FACTORS OF DECISIONS
45
Summary of the relationship between relevant and irrelevant
costs
Figure 2.1
Note in particular that future outlay costs may be either relevant or irrelevant costs depending
on whether they vary with the decision. Future opportunity costs and outlay costs which vary
with the decision are relevant; future outlay costs which do not vary with the decision, and all
past costs, are irrelevant.
Activity 2.3 was concerned with the cost of putting a car into a marketable condition.
Apart from whether the car could be sold for more than the relevant cost of doing this,
are there any other factors that should be taken into account in making a decision as
to whether or not to do the work?
We can think of three points:
l Turning away another job in order to do the engine replacement may lead to customer
dissatisfaction.
l On the other hand, having the car available for sale may be useful commercially for the
garage, beyond the profit that can be earned from that particular car sale. For example,
having a good range of second-hand cars for sale may attract potential customers
wanting to buy a car.
Activity 2.7
‘
M02_ATRI3622_06_SE_C02.QXD 5/29/09 10:34 AM Page 45
It is important to consider ‘qualitative’ factors carefully. There is a risk that they may
be given less weight by managers because they are virtually impossible to assess in
terms of their ultimate economic effect. This effect can nevertheless be very significant.
CHAPTER 2 RELEVANT COSTS FOR DECISION MAKING
46
l There is also a more immediate economic point. It has been assumed that the only
opportunity cost concerns labour (the charge-out rate for the seven hours concerned).
In practice, most car repairs involve the use of some materials and spare parts. These
are usually charged to customers at a profit to the garage. Any such profit from a job
turned away would be lost to the garage, and this lost profit would be an opportunity
cost of the engine replacement and should, therefore, be included in the calculation of
the minimum price to be charged for the sale of the car.
You may have thought of additional points.
Activity 2.7 continued
JB Limited is a small specialist manufacturer of electronic components. Makers of aircraft,
for both civil and military purposes, use much of its output. One of the aircraft makers has
offered a contract to JB Limited for the supply, over the next 12 months, of 400 identical
components. The data relating to the production of each component are as follows:
(i) Material requirements:
3 kg of material M1 (see Note 1 below)
2 kg of material P2 (see Note 2 below)
1 bought-in component (part number 678) (see Note 3 below)
Note 1: Material M1 is in continuous use by the business; 1,000 kg are currently held
by the business. The original cost was £4.70/kg, but it is known that future purchases
will cost £5.50/kg.
Note 2: 1,200 kg of material P2 are currently held. The original cost of this material
was £4.30/kg. The material has not been required for the last two years. Its scrap
value is £1.50/kg. The only foreseeable alternative use is as a substitute for material
P4 (in constant use) but this would involve further processing costs of £1.60/kg. The
current cost of material P4 is £3.60/kg.
Note 3: It is estimated that the components (part number 678) could be bought in for
£50 each.
(ii) Labour requirements: Each component would require five hours of skilled labour and
five hours of semi-skilled. A skilled employee is available and is currently paid
£14/hour. A replacement would, however, have to be obtained at a rate of £12/hour
for the work which would otherwise be done by the skilled employee. The current rate
for semi-skilled work is £10/hour and an additional employee could be appointed for
this work.
(iii) General manufacturing costs: It is JB Limited’s policy to charge a share of the general
costs (rent, heating and so on) to each contract undertaken at the rate of £20 for each
machine hour used on the contract. If the contract is undertaken, the general costs
are expected to increase as a result of undertaking the contract by £3,200.
Self-assessment question 2.1
M02_ATRI3622_06_SE_C02.QXD 5/29/09 10:34 AM Page 46
To end the chapter, Real World 2.3 describes another case where the decision makers,
quite correctly, ignored past costs and just concentrated on future options for the busi-
ness concerned.
SUMMARY
47
Spare machine capacity is available and each component would require four machine
hours. A price of £200 a component has been offered by the potential customer.
Required:
(a) Should the contract be accepted? Support your conclusion with appropriate figures
to present to management.
(b) What other factors ought management to consider that might influence the decision?
The answer to this question can be found in Appendix B at the back of the book.
REAL WORLD 2.3
Pound shop
In 2006 Merchant Equity Partners (MEP), a private equity group, bought the retail arm of
MFI (the furniture business) for just £1. MEP planned to revive the loss-making furniture
chain and sell it on for up to £500 million in around 2011. MFI management felt at the time
that having it taken over by MEP might avoid the retail arm slipping further into financial
difficulties.
The buy-out agreement included an arrangement that MFI would pay a ‘dowry’ of
£75 million over three years to encourage MEP to take it off MFI’s hands. MFI felt that it
would then be able to concentrate on the profitable part of its business, Howden Joinery,
which sold kitchen cabinets to the building trade.
In the event, MEP’s plans for MFI retail were overtaken by the downturn in furniture
sales and MEP allowed the business to be taken over by a group of its managers in 2008.
Source: Taken from Callan, E., ‘MFI furniture retail arm bought for £1’, ft.com, 12 July 2006, and Braithwaite, T., ‘Favell buy-out
rescues MFI from administration’, Financial Times, 28 September 2008.
FT
The main points in this chapter may be summarised as follows:
Cost = amount of resources, usually measured in monetary terms, sacrificed to
achieve a particular objective.
Relevant and irrelevant costs
l Relevant costs must
– relate to the objective being pursued by the business
– differ from one possible decision outcome to the next.
l Relevant costs therefore include
– opportunity costs
– differential future outlay costs.
SUMMARY
M02_ATRI3622_06_SE_C02.QXD 5/29/09 10:34 AM Page 47
l Irrelevant costs therefore include
– all past (or sunk) costs
– all committed costs
– non-differential outlay costs.
Qualitative factors of decisions
l Financial/economic decisions almost inevitably have qualitative aspects that finan-
cial analysis cannot really handle, despite their importance.
If you would like to explore the topics covered in this chapter in more depth, we recommend the
following books:
Atkinson, A., Banker, R., Kaplan, R., Young, S. M. and Matsumura, E., Management Accounting, 5th
edn, Prentice Hall, 2007, chapter 6.
Drury, C., Management and Cost Accounting, 7th edn, Cengage Learning, 2007, chapter 9.
Hilton, R., Managerial Accounting, 6th edn, McGraw-Hill Irwin, 2005, chapter 14.
Horngren, C., Foster, G., Datar, S., Rajan, M. and Ittner, C., Cost Accounting: A Managerial
Emphasis, 13th edn, Prentice Hall International, 2008, chapter 11.
Further reading
CHAPTER 2 RELEVANT COSTS FOR DECISION MAKING
48
Cost p. 38
Historic cost p. 38
Opportunity cost p. 38
Relevant cost p. 39
Irrelevant cost p. 39
Past cost p. 40
Outlay cost p. 40
Sunk cost p. 44
Committed cost p. 44
Key terms
‘
M02_ATRI3622_06_SE_C02.QXD 5/29/09 10:34 AM Page 48
Answers to these questions can be found in Appendix C at the back of the book.
To be relevant to a particular decision, a cost must have two attributes. What are they?
Distinguish between a sunk cost and an opportunity cost.
Define the word ‘cost’ in the context of management accounting.
What is meant by the expression ‘committed cost’? How do committed costs arise?
2.4
2.3
2.2
2.1
Exercises 2.7 and 2.8 are more advanced than 2.1 to 2.6. Those with coloured numbers
have answers in Appendix D at the back of the book. If you wish to try more exercises, visit
the students’ side of the Companion Website at www.pearson.co.uk/atrillmclaney.
Lombard Ltd has been offered a contract for which there is available production capacity. The
contract is for 20,000 identical items, manufactured by an intricate assembly operation, to be
produced and delivered in the next few months at a price of £80 each. The specification for one
item is as follows:
Assembly labour
4 hours
Component X 4 units
Component Y 3 units
There would also be the need to hire equipment, for the duration of the contract, at an out-
lay cost of £200,000.
The assembly is a highly skilled operation and the workforce is currently underutilised. It is
the business’s policy to retain this workforce on full pay in anticipation of high demand next
year, for a new product currently being developed. There is sufficient available skilled labour to
undertake the contract now under consideration. Skilled workers are paid £15 an hour.
Component X is used in a number of other subassemblies produced by the business. It is
readily available, and 50,000 units of Component X are currently held in inventories. Lombard
Ltd made a special purchase of Component Y in anticipation of an order that did not in the end
materialise. It is, therefore, surplus to requirements and the 100,000 units that are currently held
may have to be sold at a loss. An estimate of various values for Components X and Y provided
by the materials planning department is as follows:
Component XY
£/unit £/unit
Historic cost 4 10
Replacement cost 5 11
Net realisable value 3 8
It is estimated that any additional relevant costs associated with the contract (beyond the
above) will amount to £8 an item.
2.1
EXERCISES
49
REVIEW QUESTIONS
EXERCISES
M02_ATRI3622_06_SE_C02.QXD 5/29/09 10:34 AM Page 49
Required:
Analyse the information and advise Lombard Ltd on the desirability of the contract.
The local authority of a small town maintains a theatre and arts centre for the use of a local
repertory company, other visiting groups and exhibitions. Management decisions are taken by
a committee that meets regularly to review the financial statements and to plan the use of the
facilities.
The theatre employs a full-time, non-performing staff and a number of artistes at total costs
of £9,600 and £35,200 a month, respectively. The theatre mounts a new production every month
for 20 performances. Other monthly costs of the theatre are as follows:
£
Costumes 5,600
Scenery 3,300
Heat and light 10,300
A share of the administration costs of local authority 16,000
Casual staff 3,520
Refreshments 2,360
On average the theatre is half full for the performances of the repertory company. The capac-
ity and seat prices in the theatre are:
200 seats at £24 each
500 seats at £16 each
300 seats at £12 each
In addition, the theatre sells refreshments during the performances for £7,760 a month. Pro-
gramme sales cover their costs, and advertising in the programme generates £6,720 a month.
The management committee has been approached by a popular touring group, which would
like to take over the theatre for one month (25 performances). The group is prepared to pay the
local authority half of its ticket income as a fee for the use of the theatre. The group expects to
fill the theatre for 10 nights and achieve two-thirds capacity on the remaining 15 nights. The
prices charged are £2 less than normally applies in the theatre.
The local authority will, as normal, pay for heat and light costs and will still honour the con-
tracts of all artistes and pay the non-performing employees who will sell refreshments, pro-
grammes and so on. The committee does not expect any change in the level of refreshments or
programme sales if they agree to this booking.
Note: The committee includes the share of the local authority administration costs when
making profit calculations. It assumes occupancy applies equally across all seat prices.
Required:
(a) On financial grounds should the management committee agree to the approach from the
touring group? Support your answer with appropriate workings.
(b) What other factors may have a bearing on the decision by the committee?
Andrews and Co. Ltd has been invited to tender for a contract. It is to produce 10,000 metres
of an electrical cable in which the business specialises. The estimating department of the busi-
ness has produced the following information relating to the contract:
l Materials: The cable will require a steel core, which the business buys in. The steel core is
to be coated with a special plastic, also bought in, using a special process. Plastic for the
covering will be required at the rate of 0.10 kg/metre of completed cable.
l Direct labour: Skilled: 10 minutes/metre; Unskilled: 5 minutes/metre.
The business already holds sufficient of each of the materials required to complete the
contract. Information on the cost of the inventories is as follows:
2.3
2.2
CHAPTER 2 RELEVANT COSTS FOR DECISION MAKING
50
M02_ATRI3622_06_SE_C02.QXD 5/29/09 10:34 AM Page 50
Steel core Plastic
£/metre £/kg
Historic cost 1.50 0.60
Current buying-in cost 2.10 0.70
Scrap value 1.40 0.10
The steel core is in constant use by the business for a variety of work that it regularly under-
takes. The plastic is a surplus from a previous contract where a mistake was made and an
excess quantity ordered. If the current contract does not go ahead, this plastic will be scrapped.
Unskilled labour, which is paid at the rate of £7.50 an hour, will need to be taken on speci-
fically to undertake the contract. The business is fairly quiet at the moment which means that
a pool of skilled labour exists that will still be employed at full pay of £12 an hour to do
nothing if the contract does not proceed. The pool of skilled labour is sufficient to complete
the contract.
Required:
Indicate the minimum price at which the contract could be undertaken, such that the business
would be neither better nor worse off as a result of doing it.
SJ Services Ltd has been asked to quote a price for a special contract to render a service that
will take the business one week to complete. Information relating to labour for the contract is
as follows:
Grade of labour Hours required Basic rate/hour
Skilled 27 £12
Semi-skilled 14 £9
Unskilled 20 £7
A shortage of skilled labour means that the necessary staff to undertake the contract would
have to be moved from other work that is currently yielding an excess of sales revenue over
labour and other costs of £8 an hour.
Semi-skilled labour is currently being paid at semi-skilled rates to undertake unskilled work.
If the relevant members of staff are moved to work on the contract, unskilled labour will have to
be employed for the week to replace them.
The unskilled labour actually needed to work on the contract will be specifically employed for
the week of the contract.
All labour is charged to contracts at 50 per cent above the rate paid to the employees, so
as to cover the contract’s fair share of the business’s general costs (rent, heating and so on). It
is estimated that these general costs will increase by £50 as a result of undertaking the contract.
Undertaking the contract will require the use of a specialised machine for the week. The business
owns such a machine, which it depreciates at the rate of £120 a week. This machine is currently
being hired out to another business at a weekly rental of £175 on a week-by-week contract.
To derive the above estimates, the business has had to spend £300 on a specialised study.
If the contract does not proceed, the results of the study can be sold for £250.
An estimate of the contract’s fair share of the business’s rent is £150 a week.
Required:
Deduce the minimum price at which SJ Services Ltd could undertake the contract such that it
would be neither better nor worse off as a result of undertaking it.
A business in the food industry is currently holding 2,000 tonnes of material in bulk storage. This
material deteriorates with time, and so in the near future it needs to be repackaged for sale or
sold in its present form.
The material was acquired in two batches: 800 tonnes at a price of £40 a tonne and 1,200
tonnes at a price of £44 a tonne. The current market price of any additional purchases is £48 a
2.5
2.4
EXERCISES
51
M02_ATRI3622_06_SE_C02.QXD 5/29/09 10:34 AM Page 51
tonne. If the business were to dispose of the material, it could sell any quantity but only for £36
a tonne; it does not have the contacts or reputation to command a higher price.
Processing this material may be undertaken to develop either Product A or Product X. No
weight loss occurs with the processing, that is, one tonne of material will make one tonne of A
or X. For Product A, there is an additional cost of £60 a tonne, after which it will sell for £105 a
tonne. The marketing department estimates that 500 tonnes could be sold in this way.
With Product X, the business incurs additional costs of £80 a tonne for processing. A market
price for X is not known and no minimum price has been agreed. The management is currently
engaged in discussions over the minimum price that may be charged for Product X in the cur-
rent circumstances. Management wants to know the relevant cost per tonne for Product X so
as to provide a basis for negotiating a profitable selling price for the product.
Required:
Identify the relevant cost per tonne for Product X, given sales volumes of X of:
(a) up to 1,500 tonnes
(b) over 1,500 tonnes, up to 2,000 tonnes
(c) over 2,000 tonnes.
Explain your answer.
A local education authority is faced with a predicted decline in the demand for school places in
its area. It is believed that some schools will have to close in order to remove up to 800 places
from current capacity levels. The schools that may face closure are referenced as A, B, C and
D. Their details are as follows:
l School A (capacity 200) was built 15 years ago at a cost of £1.2 million. It is situated in a
‘socially disadvantaged’ community area. The authority has been offered £14 million for the
site by a property developer.
l School B (capacity 500) was built 20 years ago and cost £1 million. It was renovated only two
years ago at a cost of £3 million to improve its facilities. An offer of £8 million has been made
for the site by a business planning a shopping complex in this affluent part of the area.
l School C (capacity 600) cost £5 million to build five years ago. The land for this school is
rented from a local business for an annual cost of £300,000. The land rented for School C is
on a 100-year lease. If the school closes, the property reverts immediately to the owner. If
School C is not closed, it will require a £3 million investment to improve safety at the school.
l School D (capacity 800) cost £7 million to build eight years ago; last year £1.5 million was
spent on an extension. It has a considerable amount of grounds, currently used for sporting
events. This factor makes it popular with developers, who have recently offered £9 million for
the site. If School D is closed, it will be necessary to pay £1.8 million to adapt facilities at
other schools to accommodate the change.
In the accounting system, the local authority depreciates non-current assets based on 2 per
cent a year on the original cost. It also differentiates between one-off, large items of capital
expenditure or revenue, and annually recurring items.
The local authority has a central staff, which includes administrators for each school costing
£200,000 a year for each school, and a chief education officer costing £80,000 a year in total.
Required:
(a) Prepare a summary of the relevant cash flows (costs and revenues, relative to not making
any closures) under the following options:
(i) closure of D only
(ii) closure of A and B
(iii) closure of A and C.
Show separately the one-off effects and annually recurring items, rank the options open to
the local authority, and briefly interpret your answer.
Note: Various approaches are acceptable provided that they are logical.
2.6
CHAPTER 2 RELEVANT COSTS FOR DECISION MAKING
52
M02_ATRI3622_06_SE_C02.QXD 5/29/09 10:34 AM Page 52
(b) Identify and comment on any two different types of irrelevant cost contained in the infor-
mation given in the question.
(c) Discuss other factors that might have a bearing on the decision.
Rob Otics Ltd, a small business that specialises in building electronic-control equipment, has
just received an order from a customer for eight identical robotic units. These will be completed
using Rob Otics’s own labour force and factory capacity. The product specification prepared by
the estimating department shows the following material and labour requirements for each
robotic unit:
Component X 2 per unit
Component Y 1 per unit
Component Z 4 per unit
Other miscellaneous items see below
Assembly labour 25 hours per unit (but see below)
Inspection labour 6 hours per unit
As part of the costing exercise, the business has collected the following information:
l Component X. This item is normally held by the business as it is in constant demand. The 10
units currently held were invoiced to Rob Otics at £150 a unit, but the sole supplier has
announced a price rise of 20 per cent effective immediately. Rob Otics has not yet paid for
the items currently held.
l Component Y. 25 units are currently held. This component is not normally used by Rob Otics
but the units currently held are because of a cancelled order following the bankruptcy of a
customer. The units originally cost the business £4,000 in total, although Rob Otics has
recouped £1,500 from the liquidator of the bankrupt business. As Rob Otics can see no use
for these units (apart from the possible use of some of them in the order now being consid-
ered), the finance director proposes to scrap all 25 units (zero proceeds).
l Component Z. This is in regular use by Rob Otics. There is none in inventories but an order
is about to be sent to a supplier for 75 units, irrespective of this new proposal. The supplier
charges £25 a unit on small orders but will reduce the price to £20 a unit for all units on any
order over 100 units.
l Other miscellaneous items. These are expected to cost £250 in total.
Assembly labour is currently in short supply in the area and is paid at £10 an hour. If the order
is accepted, all necessary labour will have to be transferred from existing work, and other orders
will be lost. It is estimated that for each hour transferred to this contract £38 will be lost (calcu-
lated as lost sales revenue £60, less materials £12 and labour £10). The production director
suggests that, owing to a learning process, the time taken to make each unit will reduce, from
25 hours to make the first one, by one hour a unit made.
Inspection labour can be provided by paying existing personnel overtime which is at a pre-
mium of 50 per cent over the standard rate of £12 an hour.
When the business is working out its contract prices, it normally adds an amount equal to
£20 for each assembly hour to cover its general costs (such as rent and electricity). To the
resulting total, 40 per cent is normally added as a profit mark-up.
Required:
(a) Prepare an estimate of the minimum price that you would recommend Rob Otics Ltd to
charge for the proposed contract such that it would be neither better nor worse off as a
result. Provide explanations for any items included.
(b) Identify any other factors that you would consider before fixing the final price.
A business places substantial emphasis on customer satisfaction and, to this end, delivers its
product in special protective containers. These containers have been made in a department
2.8
2.7
EXERCISES
53
M02_ATRI3622_06_SE_C02.QXD 5/29/09 10:34 AM Page 53
within the business. Management has recently become concerned that this internal supply of
containers is very expensive. As a result, outside suppliers have been invited to submit tenders
for the provision of these containers. A quote of £250,000 a year has been received for a vol-
ume that compares with current internal supply.
An investigation into the internal costs of container manufacture has been undertaken and
the following emerges:
(a) The annual cost of material is £120,000, according to the stores records maintained, at
actual historic cost. Three-quarters (by cost) of this represents material that is regularly
stocked and replenished. The remaining 25 per cent of the material cost is a special foam-
ing chemical that is not used for any other purpose. There are 40 tonnes of this chemical
currently held. It was bought in bulk for £750 a tonne. Today’s replacement price for this
material is £1,050 a tonne but it is unlikely that the business could realise more than £600
a tonne if it had to be disposed of owing to the high handling costs and special transport
facilities required.
(b) The annual labour cost is £80,000 for this department; however, most workers in the depart-
ment are casual employees or recent starters, and so, if an outside quote was accepted,
little redundancy would be payable. There are, however, two long-serving employees who
would each accept as a salary £15,000 a year until they reached retirement age in two
years’ time.
(c) The department manager has a salary of £30,000 a year. The closure of this department
would release him to take over another department for which a vacancy is about to be
advertised. The salary, status and prospects are similar.
(d) A rental charge of £9,750 a year, based on floor area, is allocated to the containers depart-
ment. If the department were closed, the floor space released would be used for ware-
housing and, as a result, the business would give up the tenancy of an existing warehouse
for which it is paying £15,750 a year.
(e) The plant cost £162,000 when it was bought five years ago. Its market value now is £28,000
and it could continue for another two years, at which time its market value would have fallen
to zero. (The plant depreciates evenly over time.)
(f) Annual plant maintenance costs are £9,900 and allocated general administrative costs
£33,750 for the coming year.
Required:
Calculate the annual cost of manufacturing containers for comparison with the quote using
relevant figures for establishing the cost or benefit of accepting the quote. Indicate any assump-
tions or qualifications you wish to make.
CHAPTER 2 RELEVANT COSTS FOR DECISION MAKING
54
M02_ATRI3622_06_SE_C02.QXD 5/29/09 10:34 AM Page 54
Cost–volume–profit analysis
LEARNING OUTCOMES
This chapter is concerned with the relationship between volume of activity, cost and
profit. Broadly, cost can be analysed between that element that is fixed, relative to
the volume of activity, and that element that varies according to the volume of
activity. We shall consider how we can use knowledge of this relationship to make
decisions and to assess risk, particularly in the context of short-term decisions. This
will help the business to work towards its strategic objectives. This continues the
theme of Chapter 2, but in this chapter we shall be looking at situations where a
whole class of cost – fixed cost – can be treated as being irrelevant for decision-
making purposes.
INTRODUCTION
3
When you have completed this chapter, you should be able to:
l Distinguish between fixed cost and variable cost and use this distinction to
explain the relationship between cost, volume and profit.
l Prepare a break-even chart and deduce the break-even point for some
activity.
l Discuss the weaknesses of break-even analysis.
l Demonstrate the way in which marginal analysis can be used when making
short-term decisions.
M03_ATRI3622_06_SE_C03.QXD 5/29/09 3:30 PM Page 55
We saw in the previous chapter that cost represents the resources that have to be
sacrificed to achieve a business objective. The objective may be to make a particular
product, to provide a particular service, to operate an IT department and so on. The
costs incurred by a business may be classified in various ways and one important way
is according to how they behave in relation to changes in the volume of activity. Costs
may be classified according to whether they
l remain constant (fixed) when changes occur to the volume of activity, or
l vary according to the volume of activity.
These are known as fixed cost and variable cost respectively. Thus, for example, in the
case of a restaurant, the manager’s salary would normally be a fixed cost while the
unprepared food would be a variable cost.
As we shall see, knowing how much of each type of cost is associated with a par-
ticular activity can be of great value to the decision maker.
The way in which fixed cost behaves can be shown by preparing a graph that plots the
fixed cost of a business against the level of activity, as in Figure 3.1. The distance 0F
represents the amount of fixed cost, and this stays the same irrespective of the volume
of activity.
Fixed cost
Cost behaviour
CHAPTER 3 COST–VOLUME–PROFIT ANALYSIS
56
‘
Graph of fixed cost against the volume of activity
Figure 3.1
As the volume of output increases, the fixed cost stays exactly the same (0F).
M03_ATRI3622_06_SE_C03.QXD 5/29/09 3:30 PM Page 56
Staff salaries (or wages) are often assumed to be a variable cost but in practice they
tend to be fixed. Members of staff are not normally paid according to volume of out-
put and it is unusual to dismiss staff when there is a short-term downturn in activity.
Where there is a long-term downturn, or at least it seems that way to management,
redundancies may occur, with fixed-cost savings. This, however, is true of all types of
fixed cost. For example, management may also decide to close some branches to make
rental cost savings.
There are circumstances in which the labour cost is variable (for example, where staff
are paid according to how much output they produce), but this is unusual. Whether
labour cost is fixed or variable depends on the circumstances in the particular case
concerned.
It is important to be clear that ‘fixed’, in this context, means only that the cost is
unaffected by changes in the volume of activity. Fixed cost is likely to be affected by
inflation. If rent (a typical fixed cost) goes up because of inflation, a fixed cost will have
increased, but not because of a change in the volume of activity.
Similarly, the level of fixed cost does not stay the same irrespective of the time
period involved. Fixed cost elements are almost always time-based: that is, they vary
with the length of time concerned. The rental charge for two months is normally twice
that for one month. Thus, fixed cost normally varies with time, but (of course) not with
the volume of output. This means that when we talk of fixed cost being, say, £1,000,
we must add the period concerned, say, £1,000 a month.
FIXED COST
57
Can you give some examples of items of cost that are likely to be fixed for a hairdress-
ing business?
We came up with the following:
l rent
l insurance
l cleaning cost
l staff salaries.
These items of cost are likely to be the same irrespective of the number of customers hav-
ing their hair cut or styled.
Activity 3.1
Does fixed cost stay the same irrespective of the volume of output, even where there is
a massive rise in that volume? Think in terms of the rent cost for the hairdressing business.
In fact, the rent is only fixed over a particular range (known as the ‘relevant’ range). If the
number of people wanting to have their hair cut by the business increased, and the busi-
ness wished to meet this increased demand, it would eventually have to expand its phys-
ical size. This might be achieved by opening an additional branch, or perhaps by moving
the existing business to larger premises nearby. It may be possible to cope with relatively
minor increases in activity by using existing space more efficiently, or by having longer
opening hours. If activity continued to expand, however, increased rent charges would
seem inevitable.
Activity 3.2
M03_ATRI3622_06_SE_C03.QXD 5/29/09 3:30 PM Page 57
At lower volumes of activity, the rent cost shown in Figure 3.2 would be 0R. As the
volume of activity expands, the accommodation becomes inadequate and further
expansion requires an increase in premises and, therefore, cost. This higher level of
accommodation provision will enable further expansion to take place. Eventually,
additional cost will need to be incurred if further expansion is to occur. Elements of
fixed cost that behave in this way are often referred to as stepped fixed cost.
We saw earlier that variable cost varies with the volume of activity. In a manufactur-
ing business, for example, this would include the cost of raw materials used.
Variable cost can be represented graphically as in Figure 3.3. At zero volume of activ-
ity, the variable cost is zero. It then increases in a straight line as activity increases.
Variable cost
CHAPTER 3 COST–VOLUME–PROFIT ANALYSIS
58
‘
Graph of rent cost against the volume of activity
Figure 3.2
As the volume of activity increases from zero, the rent (a fixed cost) is unaffected. At a particu-
lar point, the volume of activity cannot increase further without additional space being rented.
The cost of renting the additional space will cause a ‘step’ in the rent cost. The higher rent cost
will continue unaffected if volume rises further until eventually another step point is reached.
Can you think of some examples of cost that are likely to be variable for a hairdressing
business?
We can think of a couple:
l lotions, sprays and other materials used;
l laundry cost to wash towels used to dry customers’ hair.
As with many types of business activity, variable cost incurred by hairdressers tends to be
low in comparison with fixed cost: that is, fixed cost tends to make up the bulk of total cost.
Activity 3.3
In practice, the situation described in Activity 3.2 would look something like Figure 3.2.
M03_ATRI3622_06_SE_C03.QXD 5/29/09 3:30 PM Page 58
The straight line for variable cost on Figure 3.3 implies that this type of cost will be
the same per unit of activity, irrespective of the volume of activity. We shall consider
the practicality of this assumption a little later in this chapter.
In some cases, cost has an element of both fixed and variable cost. It can then
be described as semi-fixed (semi-variable) cost. An example might be the electri-
city cost for the hairdressing business. Some of this will be for heating and lighting,
and this part is probably fixed, at least until the volume of activity expands to a
point where longer opening hours or larger premises are necessary. The other part
of the cost will vary with the volume of activity. An example would be power for
hairdryers.
Semi-fixed (semi-variable) cost
SEMI-FIXED (SEMI-VARIABLE) COST
59
‘
Graph of variable cost against the volume of activity
Figure 3.3
At zero activity, there is no variable cost. However, as the volume of activity increases, so does
the variable cost.
Can you suggest another cost for a hairdressing business that is likely to be semi-fixed
(semi-variable)?
We thought of telephone charges for landlines. These tend to have a rental element, which
is fixed, and there may also be certain calls that have to be made irrespective of the vol-
ume of activity involved. However, increased business would be likely to lead to the need
to make more telephone calls and so to increased call charges.
Activity 3.4
M03_ATRI3622_06_SE_C03.QXD 5/29/09 3:30 PM Page 59
From the graph we can say that the fixed element of the electricity cost is the
amount represented by the vertical distance from the origin at zero (bottom left-hand
corner) to the point where the line of best fit crosses the vertical axis of the graph. The
variable cost per unit is the amount that the graph rises for each increase in the vol-
ume of activity.
By breaking down semi-fixed cost into its fixed and variable elements in this way,
we are left with just two types of cost: fixed cost and variable cost.
Armed with knowledge of how much each element of cost represents for a particu-
lar product or service, it is possible to make predictions regarding total and per-unit
cost at various projected levels of output. Such predictive information can be very use-
ful to decision makers, and much of the rest of this chapter will be devoted to seeing
how, starting with break-even analysis.
Estimating semi-fixed (semi-variable) cost
Often, it is not obvious how much of each element a particular cost contains. However,
past experience may provide some guidance. Let us again take the example of electricity.
If we have data on what the electricity cost has been for various volumes of activity,
say the relevant data over several three-month periods (electricity is usually billed by
the quarter), we can estimate the fixed and variable portions. This may be done graphic-
ally, as shown in Figure 3.4. We tend to use past data here purely because they provide
us with an estimate of future cost; past cost is not, of course, relevant for its own sake.
Each of the dots in Figure 3.4 is the electricity charge for a particular quarter plotted
against the volume of activity (probably measured in terms of sales revenue) for the
same quarter. The diagonal line on the graph is the line of best fit. This means that this
was the line that best seemed (to us, at least) to represent the data. A better estimate
can usually be made using a statistical technique (least squares regression), which does
not involve drawing graphs and making estimates. In practice, though, it probably
makes little difference which approach is taken.
CHAPTER 3 COST–VOLUME–PROFIT ANALYSIS
60
‘
Graph of electricity cost against the volume of activity
Figure 3.4
Here the electricity bill for a time period (for example, three months) is plotted against the vol-
ume of activity for that same period. This is done for a series of periods. A line is then drawn
that best ‘fits’ the various points on the graph. From this line we can then deduce both the cost
at zero activity (the fixed element) and the slope of the line (the variable element).
M03_ATRI3622_06_SE_C03.QXD 5/29/09 3:30 PM Page 60
If, for a particular product or service, we know the fixed cost for a period and the vari-
able cost per unit, we can produce a graph like the one shown in Figure 3.5. This graph
reveals the total cost over the possible range of volume of activity.
Finding the break-even point
The bottom part of Figure 3.5 shows the fixed-cost area. Added to this is the variable
cost, the wedge-shaped portion at the top of the graph. The uppermost line represents
the total cost over a range of volume of activity. For any particular volume, the total
cost can be measured by the vertical distance between the graph’s horizontal axis and
the relevant point on the uppermost line.
Logically, the total cost at zero activity is the amount of the fixed cost. This is
because, even where there is nothing going on, the business will still be paying rent,
salaries and so on, at least in the short term. As the volume of activity increases from
zero, the fixed cost is augmented by the relevant variable cost to give the total cost.
If we take this total cost graph in Figure 3.5, and superimpose on it a line represent-
ing total revenue over the range of volume of activity, we obtain the break-even chart.
This is shown in Figure 3.6.
Note in Figure 3.6 that, at zero volume of activity (zero sales), there is zero sales rev-
enue. The profit (loss), which is the difference between total sales revenue and total
cost, for a particular volume of activity is the vertical distance between the total sales
revenue line and the total cost line at that volume of activity. Where there is no ver-
tical distance between these two lines (total sales revenue equals total cost) the volume
of activity is at break-even point (BEP). At this point there is neither profit nor loss:
that is, the activity breaks even. Where the volume of activity is below BEP, a loss will
be incurred because total cost exceeds total sales revenue. Where the business operates
at a volume of activity above BEP, there will be a profit because total sales revenue will
FINDING THE BREAK-EVEN POINT
61
‘
‘
Graph of total cost against volume of activity
Figure 3.5
The bottom part of the graph represents the fixed cost element. To this is added the wedge-
shaped top portion, which represents the variable cost. The two parts together represent total
cost. At zero activity, the variable cost is zero, so total cost equals fixed cost. As activity
increases so does total cost, but only because variable cost increases. We are assuming that
there are no steps in the fixed cost.
M03_ATRI3622_06_SE_C03.QXD 5/29/09 3:30 PM Page 61
exceed total cost. The further below BEP, the higher the loss; the further above BEP, the
higher the profit.
Deducing BEPs by graphical means is a laborious business. Since, however, the
relationships in the graph are all linear (that is, the lines are all straight), it is easy to
calculate the BEP.
We know that at BEP (but not at any other point)
Total sales revenue
==
Total cost
(At all other points except the BEP, either total sales revenue will exceed total cost or
the other way round. Only at BEP are they equal.) The above formula can be expanded
so that
Total sales revenue
==
Fixed cost
++
Total variable cost
If we call the number of units of output at BEP b, then
b × Sales revenue per unit = Fixed cost + (b × Variable cost per unit)
so
(b × Sales revenue per unit) − (b × Variable cost per unit) = Fixed cost
and
b × (Sales revenue per unit − Variable cost per unit) = Fixed cost
giving
b
==
Fixed cost
Sales revenue per unit
−−
Variable costs per unit
CHAPTER 3 COST–VOLUME–PROFIT ANALYSIS
62
Break-even chart
Figure 3.6
The sloping line starting at zero represents the sales revenue at various volumes of activity. The
point at which this finally catches up with the sloping total cost line, which starts at F, is the
break-even point (BEP). Below this point a loss is made, above it a profit.
M03_ATRI3622_06_SE_C03.QXD 5/29/09 3:30 PM Page 62
If we look back at the break-even chart in Figure 3.6, this formula seems logical. The
total cost line starts off at point F, higher than the starting point for the total sales rev-
enues line (zero) by amount F (the amount of the fixed cost). Because the sales revenue
per unit is greater than the variable cost per unit, the sales revenue line will gradually
catch up with the total cost line. The rate at which it will catch up is dependent on the
relative steepness of the two lines and the amount that it has to catch up (the fixed
cost). Bearing in mind that the slopes of the two lines are the variable cost per unit and
the selling price per unit, the above equation for calculating b looks perfectly logical.
Though the BEP can be calculated quickly and simply without resorting to graphs,
this does not mean that the break-even chart is without value. The chart shows the
relationship between cost, volume and profit over a range of activity and in a form that
can easily be understood by non-financial managers. The break-even chart can there-
fore be a useful device for explaining this relationship.
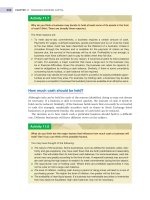
Real World 3.1 shows information on the BEPs of three well-known businesses.
FINDING THE BREAK-EVEN POINT
63
Cottage Industries Ltd makes baskets. The fixed costs of operating the workshop
for a month total £500. Each basket requires materials that cost £2. Each basket
takes one hour to make, and the business pays the basket makers £10 an hour.
The basket makers are all on contracts such that if they do not work for any rea-
son, they are not paid. The baskets are sold to a wholesaler for £14 each.
What is the BEP for basket making for the business?
Solution
The BEP (in number of baskets)
=
=
= 250 baskets per month
Note that the BEP must be expressed with respect to a period of time.
£500
£14 − (£2 + £10)
Fixed cost
(Sales revenue per unit − Variable cost per unit)
Example 3.1
REAL WORLD 3.1
BE at BA, Ryanair and easyJet
Commercial airlines seem to pay a lot of attention to their BEPs and their ‘load factors’,
that is, their actual level of activity. Figure 3.7 shows the BEP and load factor for three well-
known airlines operating from the UK. British Airways (BA) is a traditional airline. Ryanair
and easyJet are both ‘no-frills’ carriers, which means that passengers receive lower levels
of service in return for lower fares. All three operate flights within the UK and from the UK
‘
M03_ATRI3622_06_SE_C03.QXD 5/29/09 3:30 PM Page 63
CHAPTER 3 COST–VOLUME–PROFIT ANALYSIS
64
Can you think of reasons why the managers of a business might find it useful to know
the BEP of some activity that they are planning to undertake?
By knowing the BEP, it is possible to compare the expected, or planned, volume of activ-
ity with the BEP and so make a judgement about risk. If the volume of activity is expected
to only just exceed the break-even point, this may suggest that it is a risky venture. Only
a small fall from the expected volume of activity could lead to a loss.
Activity 3.5
Cottage Industries Ltd (see Example 3.1) expects to sell 500 baskets a month. The
business has the opportunity to rent a basket-making machine. Doing so would
increase the total fixed cost of operating the workshop for a month to £3,000. Using the
machine would reduce the labour time to half an hour per basket. The basket makers
would still be paid £10 an hour.
Activity 3.6
Real World 3.1 continued
Source: Based on information contained in Binggeli, U. and Pompeo, L., ‘The battle for Europe’s low-fare flyers’, The McKinsey
Quarterly, August 2005 (www.mckinseyquarterly.com). The data in the article are based on the year ended 31 March 2004.
to other countries. BA offers a much wider range of destinations than the other two air-
lines. We can see that all three airlines were making operating profits as each had a load
factor greater than its BEP.
Break-even and load factors in the airline industry
Figure 3.7
M03_ATRI3622_06_SE_C03.QXD 5/29/09 3:30 PM Page 64
In the same way as we can derive the number of units of output necessary to break
even, we can calculate the volume of activity required to achieve a particular level of
profit. We can expand the equation shown on p. 62 above so that
Total sales revenue
==
Fixed cost
++
Total variable cost
++
Target profit
Achieving a target profit
ACHIEVING A TARGET PROFIT
65
(a) How much profit would the business make each month from selling baskets
1 assuming that the basket-making machine is not rented; and
2 assuming that it is rented?
(b) What is the BEP if the machine is rented?
(c) What do you notice about the figures that you calculate?
(a) Estimated monthly profit from basket making:
Without the machine With the machine
££££
Sales revenue (500 × £14) 7,000 7,000
Materials (500 × £2) (1,000) (1,000)
Labour (500 × 1 × £10) (5,000)
(500 ×
1
/2 × £10) (2,500)
Fixed cost (500 ) (3,000)
( 6,500 ) (6,500 )
Profit 500 500
(b) The BEP (in number of baskets) with the machine
=
=
= 429 baskets a month
The BEP without the machine is 250 baskets per month (see Example 3.1).
(c) There seems to be nothing to choose between the two manufacturing strategies
regarding profit, at the estimated sales volume. There is, however, a distinct difference
between the two strategies regarding the BEP. Without the machine, the actual vol-
ume of sales could fall by a half of that which is expected (from 500 to 250) before the
business would fail to make a profit. With the machine, however, just a 14 per cent fall
(from 500 to 429) would be enough to cause the business to fail to make a profit. On
the other hand, for each additional basket sold above the estimated 500, an additional
profit of only £2 (that is, £14 − (£2 + £10)) would be made without the machine,
whereas £7 (that is, £14 − (£2 + £5)) would be made with the machine. (Note that
knowledge of the BEP and the planned volume of activity gives some basis for
assessing the riskiness of the activity.)
£3,000
£14 − (£2 + £5)
Fixed cost
Sales revenue per unit − Variable cost per unit
M03_ATRI3622_06_SE_C03.QXD 5/29/09 3:30 PM Page 65
If we let t be the required number of units of output to achieve the target profit, then
t × Sales revenue per unit = Fixed cost + (t × Variable cost per unit) + Target profit
so
(t × Sales revenue per unit) − (t × Variable cost per unit) = Fixed cost + Target profit
and
t × (Sales revenue per unit − Variable cost per unit) = Fixed cost + Target profit
giving
t
==
Fixed cost
++
Target profit
(Sales revenue per unit
−−
Variable cost per unit)
We shall take a closer look at the relationship between fixed cost, variable cost and
profit together with any advice that we might give the management of Cottage Industries
Ltd after we have briefly considered the notion of contribution.
The bottom part of the break-even formula (sales revenue per unit less variable cost
per unit) is known as the contribution per unit. Thus for the basket-making activity,
without the machine the contribution per unit is £2, and with the machine it is £7.
This can be quite a useful figure to know in a decision-making context. It is called
‘contribution’ because it contributes to meeting the fixed cost and, if there is any
excess, it then contributes to profit.
We shall see, a little later in this chapter, how knowing the amount of the contri-
bution generated by a particular activity can be valuable in making short-term deci-
sions of various types, as well as being useful in the BEP calculation.
Contribution
CHAPTER 3 COST–VOLUME–PROFIT ANALYSIS
66
‘
What volume of activity is required by Cottage Industries Ltd (see Example 3.1 and
Activity 3.6) in order to make a profit of £4,000 a month
(a) assuming that the basket-making machine is not rented; and
(b) assuming that it is rented?
(a) Using the formula above, the required volume of activity without the machine is
==2,250 baskets a month
(b) The required volume of activity with the machine is
==1,000 baskets a month
£3,000 + £4,000
£14 − (£2 + £5)
£500 + £4,000
£14 − (£2 + £10)
Fixed cost + Target profit
(Sales revenue per unit − Variable cost per unit)
Activity 3.7
M03_ATRI3622_06_SE_C03.QXD 5/29/09 3:30 PM Page 66