Education Preparing For The Project Management Professional_5 docx
Bạn đang xem bản rút gọn của tài liệu. Xem và tải ngay bản đầy đủ của tài liệu tại đây (3.64 MB, 29 trang )
9618$$ $CH3 09-06-02 14:59:14 PS
98 Preparing for the Project Management Professional Certification Exam
Figure 3-8. Balance sheet.
Assets:
Current assets
Cash
Accounts receivable
Inventory
Prepaid expenses
Fixed assets
Plants and equipment
Furniture and fixtures
Less accumulated depreciation
Total assets
Liabilities:
Current liabilities
Accounts payable
Unpaid salaries
Long-term liabilities
Long-term debt
Owner’s equity:
Common stock
Preferred stock
Retained earnings
the project’s share of all the costs, expenses, and taxes, the net profit after
taxes is $23,000.
ROS ס NOPAT / Gross revenue
ROS
ס $23,000 / $400,000
ROS
ס 5.75%
Return on Assets
Return on assets, or ROA, equals the net profit after taxes divided by
total assets. This is another way of saying how much profit was generated
for each dollar of investment in the company. The higher the value of ROA
the better. Typically, for American business, this value is nearly 9 percent.
Since the assets of a company represent the money that is invested in the
company, it is important to know how much profit is being made per dollar
of investment.
For example, a project uses a share of the company’s assets equal to
9618$$ $CH3 09-06-02 14:59:14 PS
99 Cost Management
$240,000. After deducting the project’s share of all of the costs, expenses,
and taxes, the net profit after taxes is $23,000.
ROA ס NOPAT / Total assets
ROA ס $23,000 / $240,000
ROA ס 9.6%
Economic Value Added
The economic value added is also called the EVA. In this financial
measurement we are interested in finding if a project’s NOPAT is sufficient
to cover the cost of maintaining the assets that it uses. In other words, if a
project uses a share of the company’s assets, those assets have certain expenses
associated with them. These expenses are the cost of interest on borrowed
funds and the compensation paid to shareholders in the company. The ratio-
nale here is that the only way a company can acquire assets is by borrowing
the money to purchase them, having investors purchase stock in the com-
pany, or generating profits. Organizations that lend money to companies are
compensated in the form on interest payments. Stockholders are compen-
sated in the form of dividends on their share of the company. The revenue
generated by the project must be enough to meet all of the project’s costs
and expenses as well as offset the interest expense and dividends to the stock-
holders.
The first thing we will have to calculate is the cost of capital. This is
the weighted average cost of the money paid to the stockholders in the form
of dividends and the money paid to the lenders in the form of interest
payments.
Suppose a company’s assets are financed by 70 percent in stock sold to
investors and 30 percent in funds borrowed from banks and other financial
institutions in the form of loans. The average interest that is paid on the
loans is 7 percent, and the company dividends are 17 percent. What is the
cost of capital for this company?
Seventy dollars out of every $100 of the company’s assets are financed
by stockholders at 17 percent, or $11.90 per year. Thirty dollars of every
$100 of the company’s assets are financed by lenders at 7 percent, or $2.10
per year. The total cost of capital per $100 is $14, or 14 percent of the
company’s assets.
If we take the capital or the assets that are used for this project and
multiply by the cost of capital, we will get the weighted average cost of
capital (WACC).
Let’s say that the capital that the project uses is $500,000 and the cost
of capital is 14 percent:
9618$$ $CH3 09-06-02 14:59:15 PS
100 Preparing for the Project Management Professional Certification Exam
WACC ס $500,000 ן 14% ס $70,000
If the net operating profit after taxes is $116,000:
EVA ס NOPAT מ WACC
EVA ס $116,000 מ $70,000
Project economic value added, or EVA, would be $46,000
Depreciation
Depreciation is a necessary function in financial management, because with-
out depreciation the irregularities in the fundamental financial reports of a
company would vary considerably and make it difficult to compare one year
or one quarter to the next. This is because large investments in assets do not
occur on a regular basis. If the total cost of an investment were reflected in
the financial time period in which it occurred, the effect on net profits would
be considerable in this period, and then the net profit would rise significantly
in the next period.
What is done with depreciation? The cost of the new asset is spread out
over the life of the asset. This allows the company to claim some of the cost
each year rather than the total cost of the asset all at one time.
Straight Line Depreciation
Straight line depreciation is the depreciation method that allows an
equal amount of depreciation to be taken each year. The amount of depreci-
ation is determined by subtracting the salvage value of the asset at the end
of its useful life from the purchase price of the asset. The remaining value is
called the book value. The book value is divided by the number of years,
and this amount is expensed from the asset each year.
For example, a company buys a large machine for $1 million. The
purchase is made with cash. In the accounts for this transaction, the cash
account is reduced by $1 million, and the machine account is increased by
the amount of $1 million. There is no effect on the liabilities or owner’s
equity side of the accounting equation and it remains balanced. The cost of
this machine must eventually be recognized.
The machine has a useful life of ten years and is worth $100,000 at the
end of its useful life in terms of scrap value or the ability to sell the machine
to someone else. This means that the value of the machine that must be
depreciated is $900,000. Since the life of the machine is ten years, the value
depreciated each year is $90,000. This is known as straight line depreciation
(table 3-3).
9618$$ $CH3 09-06-02 14:59:16 PS
101 Cost Management
Table 3-3. Straight line depreciation.
Purchase Salvage Current
Year Price Value Depreciation Book Value
0 1,000,000 100,000
1
2
3
4
5
6
7
8
9
10
0 900,000
90,000 810,000
90,000 720,000
90,000 630,000
90,000 540,000
90,000 450,000
90,000 360,000
90,000 270,000
90,000 180,000
90,000 90,000
90,000 0
Total 900,000
Accelerated Depreciation
Accelerated depreciation methods are used to allow the expenses that
are depreciated from the assets to be applied earlier in the useful life of the
asset. The reason for this is to reduce the net profit after taxes (NOPAT). If
NOPAT is reduced in a given year, the amount of tax that a company pays
is less by this amount.
In accelerated depreciation methods the total amount of depreciation
is the same as in straight line depreciation, but the time that it is taken is
much earlier in the useful life of the asset. This means that more equipment
expense is recognized and lower taxes are paid in the early part of the useful
life of the asset purchased. In later years the taxes will be higher than in
straight line depreciation. Because of the present value of the money, taxes
that are deferred to later years allow us to use that money in the present
years.
Two types of accelerated depreciation are commonly used: sum of the
years’ digits and double declining balances.
Sum of the Years’ Digits. There is no scientific basis for the sum of the
years’ digits method. There is no financial reason for using this calculation
except that it has become a standard accounting practice.
The calculation is made by totaling the digits representing the years of
the useful life of the equipment. Thus, as can be seen in table 3-4, for a ten
year useful life, the total is 55 (10
ם 9 ם 8 ם 7 ם 6 ם 5 ם 4 ם 3 ם 2
ם 1 ס 55).
9618$$ $CH3 09-06-02 14:59:16 PS
TEAMFLY
Team-Fly
®
102 Preparing for the Project Management Professional Certification Exam
Table 3-4. Sum of the years’ digits.
Purchase Salvage Sum of Current
Year Price Value Year Digits Depreciation Book Value
0 1,000,000 100,000 0 900,000
1 10/55 163,636 736,364
2 9/55 147,273 589,091
3 8/55 130,909 458,182
4 7/55 114,545 343,636
5 6/55 98,182 245,455
6 5/55 81,818 163,636
7 4/55 65,455 98,182
8 3/55 49,091 49,091
9 2/55 32,727 16,364
10 1/55 16,364 0
Total 900,000
The amount of depreciation in the first year is determined by taking
the highest digit year and dividing this by the the sum of the years’ digits.
In the first year the last year’s digit is used, making the calculation 10 divided
by 55. This number is then multiplied by the book value.
In the remaining years, the next lower year’s digit is used. In the second
year the depreciation is calculated by dividing 9 by 55. Each year the numer-
ator declines by one year.
Double Declining Balances. Like the sum of the years’ digits deprecia-
tion, there is no scientific basis for the double declining balance calculation
either. It is, however, a consistent method for accelerating the depreciation
of equipment and has become a standard accounting practice.
The percent of depreciation is taken on the depreciable value of the
item. The next year’s depreciation is taken on the remaining depreciable
value of the item, and so on until the salvage value is reached. With this
method the amount taken as depreciation in the early years is much higher
than in the later years (table 3-5).
Summary
Cost management is a necessary part of project management, for it makes it
possible to manage the cost baseline of the project. Without cost manage-
ment projects would use more or less money than allocated, and it would be
9618$$ $CH3 09-06-02 14:59:17 PS
103 Cost Management
Table 3-5. Double declining balances.
Purchase Salvage 50% Current
Year Price Value Depreciation Book Value
0 1,000,000 100,000
1
2
3
4
5
6
7
8
9
10
0 900,000
450,000 450,000
225,000 225,000
112,500 112,500
56,250 56,250
28,125 28,125
14,063 14,063
7,031 7,031
3,516 3,516
1,758 1,758
879 879
Total 899,121
impossible to fund future projects. The project manager, as in all things, is
the person responsible for project cost management.
The work breakdown structure is the basis for the cost estimate. Since
the work breakdown structure identifies all of the project work in a detailed
workable way it becomes the best place to determine the cost of the project.
A cost estimate done this way produces a detailed estimate that can be rolled
‘‘bottom up’’ to any level of detail desired.
Cost estimating is done over the life of the project. In the beginning of
the project only a small amount of information is known about the project,
and inaccurate estimates are appropriate. In the creation of baselines for cost
and schedule it is important that definitive, 5 percent to 10 percent estimates
be reached.
Cost control in project management is best achieved through the use
of the earned value reporting system. This reporting system makes it possible
to measure performance to schedule and performance to budget in the same
system. Project performance over or under budget is measured in dollars.
Project performance ahead or behind schedule is measured in dollars.
In addition to the earned value reporting system, the project manager
must face many of the financial decisions that a small business manager must
face and be aware of the financial world of reporting.
CHAPTER 4
Human Resources Management
H
uman resources management is required to make the most efficient
use of the project human resources. This includes all of the people
involved in the project—the stakeholders, sponsors, customers,
other departments, the project team, subcontractors, and all others.
Organizational planning involves the organizing of the human re-
sources. These are the roles, responsibilities, and relationships of the people
that are on the project team. As in all things in project management, human
resources management takes place throughout the project. If at any time the
project organization needs to be revised, the human resources plan will assist
in carrying this out.
Project Manager Roles and Responsibilities
It is a long-standing joke in the project management community that if
anyone ever asks you who is responsible for anything in the project, the
answer will always be the project manager. Truly it is easier to specify what
the project manager does not do than to discuss what he or she actually does
and is responsible for.
The nature and scope of the project should dictate the individual roles
and responsibilities of the project team. When all of the team assignments
and responsibilities have been decided, all of the functions and responsibili-
ties of the project will have been assigned. The responsibility-accountability
matrix is useful for determining and tracking the relationship between a
given responsibility and who is responsible for it.
104
9618$$ $CH4 09-06-02 14:59:08 PS
105 Human Resources Management
As can be seen in figure 4-1, the responsibility-accountability matrix is
a short notational form that allows us to easily see the relationship between
the individuals on a project team and the responsibilities they have. Various
levels of the responsibility-accountability matrix may be developed for vari-
ous parts and levels of the project.
The project manager, in order to determine when activities are sup-
posed to take place in the project, uses the project schedule (figure 4-2). It
constitutes the schedule for the work that has to be done. Of course, people
are involved with the work that has to be done. The project manager in a
matrix organization draws the people from the functional organization.
The functional manager must have a staffing plan that allows him or
her to know where the people in their functional organization are commit-
ted. If these commitments are not organized the utilization of the human
resources will be poor. A staffing plan for the functional manager is similar
to the project schedule, except that instead of showing the schedule for each
task in the project, it shows the schedule for each resource in the functional
manager’s responsibility.
Figure 4-1. Responsibility-accountability matrix.
Joe Mary Frank Louie
Requirements definition S R A P
Functional design S A P
Detail design S R A
Development
R S
A
Testing
S
P
Key:
P—Participates
A—Accountable
R—Reviews
I—Input required
S—Sign off
9618$$ $CH4 09-06-02 14:59:10 PS
106 Preparing for the Project Management Professional Certification Exam
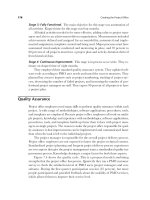
Figure 4-2. Project schedule.
Task 1
Richard Cordes
Task 2
Jeanette Williams
Task 3
Nancy Brown
Figure 4-3. Staffing plan.
Richard Cordes
Nancy Brown
Project 1 Project 3 Project 4
Project 3Project 1Project 3
Strong Matrix, Weak Matrix, and Balanced Matrix
Strong Matrix
In a strong matrix organization the project manager has greater authority or
power than the functional manager. In this situation, project managers gen-
erally get the people they want. In fact the project managers in this type of
organization get more than they should. A manager that is assertive will
usually get the personnel he or she wants. The functional manager is not
able to overcome the project manager’s authority and is not free to assign
people where their talent is best utilized.
If this type of organization becomes stronger, most if not all of the
personnel will be working on projects, and project managers will be able to
draw more highly qualified people than are really needed for their projects.
The surplus personnel are traded between the project managers themselves,
bypassing the functional managers altogether. In this type of organization
the project manager has strong authority.
Weak Matrix
In the weak matrix organization, the project manager does not have as much
power as the functional manager. This usually occurs in organizations that
are moving into matrix management for the first time. The situation occurs
something like this: The chief executive officer, or CEO, of the company
9618$$ $CH4 09-06-02 14:59:11 PS
107
Human Resources Management
Figure 4-4. Functional, weak, balanced, and strong matrix and pure project organizations
compared.
Characteristic Functional
Weak Matrix Balanced Matrix Strong Matrix Pure Project
of
Organization
Project
None
Little and Even with High Complete
manager
limited functional
power
manager
Percent
0%
0% to 25% 15% to 60% 50% to 100% 100%
working full
time on project
Titles
Project coordinator Project coordinator Project manager Project manager Program manager
Project lead Project lead Program manager Project manager
Project expeditor
9618$$ $CH4 09-06-02 14:59:12 PS
108 Preparing for the Project Management Professional Certification Exam
decides that matrix management is the thing for the company to do. Almost
overnight an attempt is made to change the organization from a functional
organization to a matrix management.
When this attempt is made, there is a reaction from the functional
managers. After all, these are the major human assets in the company. They
would not be in a position of authority if they were not good managers.
The functional managers see the problem in the new organization. In
the past, they had responsibility for the administration as well as the direct-
ing of work in their part of the organization. Under matrix management
they no longer direct some of the work that their people are doing. The
project manager will direct that work. This is a threat to the functional
managers. The salary that the company is going to pay the project managers
is going to come from someplace. Most likely it is going to come from cuts
in functional managers’ salary. The functional managers react by convincing
the upper management of the company to only allow the project managers
to recommend work to be done, and the functional managers will continue
to actually direct the work.
This form of matrix management can be used if there is a transition
going on. In the beginning of the transition to matrix management, the
project managers are new and inexperienced. As the project managers gain
experience, they should be given more authority over the people who report
to them. At the same time, the functional managers can be transitioned out
of the organization and promoted into higher and more responsible jobs. As
the functional managers move on, more appropriate administrative managers
can replace them, and direction of the work can be managed by the project
manager.
Balanced Matrix
In the balanced matrix organization, the power levels of the functional man-
ager and the project manager are in balance. By that I mean that the func-
tional manager cannot force the project manager, and the project manager
cannot force the functional manager. The functional manager makes the
decisions about where the people in his or her department will be assigned,
and the project manager works with the functional manager to recruit the
proper person for the project assignment.
A balancing rule can be applied. By setting a specific interval of time as
a requirement for moving a person to the project team, balance can be
achieved. For example, a person who is required to work full time on a
project for two months is transferred to the project, while a person who
9618$$ $CH4 09-06-02 14:59:13 PS
109 Human Resources Management
would be required to work less than two months remains in his or her
functional department. The person working greater than two months would
be physically moved to the project space and would return to the functional
area when the work is completed. The person working less than two months
on the project remains under the supervision of the functional manager. The
project manager authorizes the work to be done in the functional area by
generating a work order or some other device.
By adjusting the balance point, more or less work can be made to
happen in the functional areas. If more work is being handled in the project,
the project manager has more people reporting to him or her, increasing the
project manager’s power level. At one extreme we have a strong matrix,
where the length of time required to move a person to the project team is
very short. At the other extreme we have a weak matrix, where the length of
time required to move a person to the project team is very long.
Making Matrix Management Work
Matrix management is not without its problems. The organization is quite
complex in comparison to the functional or pure project types of organiza-
tion. Since the resources are shared, people working in this type of organiza-
tion also share their bosses. This increases problems in communications, and
many more management skills are required to make it all work.
These problems are offset by the flexibility that is achieved. The matrix
organization is able to respond quickly and correctly to the needs of the
customer in a proper fashion. The project team has greater focus on the
customer’s needs. Good project direction and participative management lead
to high motivation and a sense of achievement and recognition on the proj-
ect team.
Moving from a functional organization to a matrix organization may
take two to three years in some organizations. This is necessary because it
takes time to move the functional managers out of their positions and into
other productive areas. If movement from functional organizations to matrix
organizations is too fast, the result can be chaos and the loss of important
personnel. The objective must be to create the impression that people are
going to be promoted to other positions and not that their position is going
to be degraded. The functional managers in the existing organization are the
major assets of the company and must not be lost.
Personnel and Personal Evaluations
It is critically important that functional managers and project managers work
together to evaluate employees. This is a problem, because the project team
9618$$ $CH4 09-06-02 14:59:13 PS
110 Preparing for the Project Management Professional Certification Exam
members may be assigned to the project for only a short time and may be
assigned to several different projects with several different project managers
during the course of the evaluation period. Project managers are oriented
toward the goals of the project and frequently think of employee evaluations
as administrative work that is the responsibility of the functional manager.
One simple method for accomplishing this and solving the problem is
to have the project managers or subproject managers meet individually with
people on their project team and review progress being made toward their
project assignments. Something as simple as a lined tablet can be used for
this. The project manager meets with an individual and makes notes on the
tablet. When the meeting is over, a copy of the notes is given to the individ-
ual and a copy is filed away by the project manager.
When the person leaves the project, the notes are reviewed by the indi-
vidual and the project manager, a summary is written by the project manager
with comments by the individual, and the whole package is copied and sent
to the functional manager. In this way, when the time of appraisal is due,
the functional manager has the notes from the project managers and can
make a proper evaluation of the employees.
Motivation
Importance of Motivation
Until modern times there has been little interest in motivation of people in
a work environment. From the beginning of the industrial revolution until
the end of World War II there was some compelling reason for people to
work and work hard.
Industrial Revolution
In the beginning of the industrial revolution people moved to the cities
to find work that would give them a better standard of living than the farm
work that was available to them. There were many people available for all
jobs. If someone did not want to work the hours required under the condi-
tions given, someone else was happy to take the job immediately.
After the rise of unions, the lot of workers improved. In the beginning
of the twentieth century, the First World War brought industrial expansion
and more jobs, but the patriotic motivation brought even more workers to
the workplace.
9618$$ $CH4 09-06-02 14:59:15 PS
111 Human Resources Management
Scientific Management
The concept of scientific management was implemented by Henry
Ford and Fredrick Taylor. In this concept the problem of motivation was
essentially ignored. A person was considered to be like a machine. If a person
was defective and could not perform the work required, the person was
simply replaced with another person who would do the work. The idea
behind the assembly line is to have short repetitive jobs for people to do.
This results in a rapid slide down the learning curve. If a person had to be
replaced, another can quickly learn the job and become productive.
Learning Curve Theory
The concept of learning curve theory is quite simple. If people do a job
repeatedly, each time they double the number of times they repeat the job,
the time to do the work is reduced by a constant percentage.
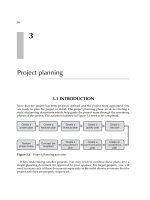
Figure 4-5 shows a 70 percent learning curve. This means that when
the number of times the job is done is doubled, the cost is reduced to 70
percent. If the first time cost is $1,000, the second time the job is done the
cost will be $700. The fourth time the job is done the cost will be $490, and
Figure 4-5. Learning curve.
70% Improvement Learning Curve
Cost per Unit
1,000
800
600
400
200
0
1
2
4
8
16
32
64
128
256
512
Number of Units
9618$$ $CH4 09-06-02 14:59:15 PS
TEAMFLY
Team-Fly
®
112 Preparing for the Project Management Professional Certification Exam
so on. It should be noted that this is similar to the law of diminishing returns
in that, for every doubling of repetitions, the amount of reduction is less and
less.
Depression Era
In the 1930s the Depression once again caused more people to look for
jobs than there were jobs for them. Again, people who did not like the work
conditions simply were replaced. When people are trying to satisfy their
basic needs, they will work under harsh conditions.
World War II
World War II brought about the patriotic reaction to work. The war
brought about prosperity for those who were not in the armed services. The
war effort involved total mobilization of industry to defeat the Axis coun-
tries. This in itself created a sense of motivation sufficient for people to work
their best.
Post–World War II
Postwar prosperity brought a new look at the problem of motivation.
For the first time in history the basic needs of U.S. citizens were essentially
satisfied. There were enough jobs so that people were generally not afraid of
starving or having enough money to buy clothing and supply other basic
needs.
The problem was that in this prosperity it was difficult to get people to
perform the way that they had during the war. This resulted in high levels
of absenteeism, poor performance, and a general lack of motivation to do
good work.
Companies recognized this problem and began to spend money to try
find solutions to the problem. For this reason much research was done on
the problem of motivation. A great body of knowledge has accumulated in
this area.
Research in the area of motivation is money well spent. Motivated
employees come to work every day and produce high quality work. Employ-
ees that are not motivated have high absenteeism, produce lower quality
work, and actually work a smaller percentage of the time. Millions of dollars
could be saved by reducing absenteeism by only 10 percent.
Motivational Ideas
Because we have a limited amount of space available we will look at only a
few of the most popular and widely accepted ideas on motivation.
9618$$ $CH4 09-06-02 14:59:16 PS
113 Human Resources Management
Procedures versus Motivation
We begin with the theory of scientific management, the idea that effi-
ciency and better use of human resources result if clear and specific proce-
dures are used. The idea behind this is that if people know exactly what they
are supposed to do and exactly when they are supposed to do it, they would
be satisfied with their jobs, become motivated, and be more efficient. Studies
conducted in this area indicated that the creation of procedures improved
performance where nothing else was done to improve the performance of
employees. The studies also showed that doing things that were motivational
to employees improved performance and efficiency still more.
Typical of these studies is the chart (figure 4-6) that simplifies a number
of these studies. A large number of companies were studied. Each company
was assessed for the amount of effort that was made to do things that were
considered to be motivational. At the same time an assessment was made of
the actual performance of the company. Performance was measured by look-
ing at measurable criteria such as employee turnover, dissatisfaction, quality
of output, and so on.
In companies that did little to proceduralize their work and did little
to motivate their employees, the expected performance was low. In compa-
nies where an effort was made to improve procedures but little was done to
improve the motivation of the employees, the performance of the company
was considerably higher.
In companies where an effort was made to improve motivation but
little was done to improve the procedures, the performance of the company
was considerably higher as well. Not only that but the performance of these
companies was considerably higher than that of the companies that had
expended considerable effort creating procedures.
The highest performance was in companies that did both. A certain
amount of proceduralization in combination with the creation of a motiva-
tional environment created the highest performing organizations.
Expectancy Theory
Expectancy theory focuses on people’s ideas about their jobs and their
surroundings. It focuses on the idea that people will do a certain thing in
order to receive some sort of positive outcome. In other words, people will
do good work because they see some sort of reward happening as a direct
result. Of course, the difficulty with this is that if people have an expectancy
that some outcome will result when they behave in a certain way and it does
not happen, then there are problems.
9618$$ $CH4 09-06-02 14:59:18 PS
114 Preparing for the Project Management Professional Certification Exam
Figure 4-6. Policy/procedure and motivational effects on productivity.
120
100
80
60
40
20
0
Poor M, Poor P Poor M, Good P Good M, Poor P Good M, Good P
M—Quality of motivation
P—Policy/procedure
9618$$ $CH4 09-06-02 14:59:19 PS
115 Human Resources Management
Expectancy theory is a simple concept. It says that if you can create an
expectancy in a person, the expectancy may indeed become fact. If a person
is told that he or she is a poor performer and is no good at doing a job, the
person will eventually become no good at doing the job and become a bad
performer. If on the other hand a person is told that he or she is a high
performer and does good work, the person may indeed become a good
worker and a high performer.
Typical of the studies that were done at this time were studies that were
conducted in elementary schools. In these studies the researchers went to a
number of elementary schools. At each school they administered an intelli-
gence-measuring test. Without looking at the results of the intelligence tests
they randomly selected a small group of students in each class. The teachers
and the parents were told that these students exhibited a high capability to
learn and perform well in school.
After a period of time the researchers returned to the schools and ad-
ministered another intelligence-measuring test. The results of this second
test indicated that the students who had been randomly selected to be in the
advanced capability group had improved their grades considerably. The only
reason for this improvement was the expressed attitude of the teachers, par-
ents, and peers toward the advanced students.
In practice, in project management, this concept can be applied by
treating people with encouragement, giving them a sense of recognition and
achievement, and giving praise publicly and criticism privately.
Maslow’s Hierarchy of Needs Theory
The concept of a hierarchy of needs was developed by Abraham Mas-
low in 1943 (figure 4-7). Like other concepts, this one is relatively simple.
The basic human needs are arranged in a hierarchy. The lower needs must
be satisfied before the higher needs can be addressed.
In the hierarchy, the lowest level, the needs for food, shelter, and cloth-
ing, must be relatively satisfied before effort will be made to satisfy the higher
needs of safety and security. Someone who is lacking sufficient amounts of
food, shelter, and clothing will be highly motivated to obtain them. Once a
satisfactory level is obtained for these things, there is a reduced motivation
to satisfy them. As one level of needs in the hierarchy is satisfied, the next
level becomes the motivating factor, and so on.
According to this concept, people are always in some sort of a ‘‘needs’’
state. This needs state goes to higher, loftier needs as the lower needs are
9618$$ $CH4 09-06-02 14:59:20 PS
116 Preparing for the Project Management Professional Certification Exam
Figure 4-7. Maslow’s hierarchy.
RECOGNITION
SECURITY AND SAFETY
SELF
SOCIALIZATION
FOOD, SHELTER, AND CLOTHING
ACTUALIZATION
met, but it can also be driven down to the more basic needs if they are
reduced.
Several survival biographies and histories of groups have been written
over the years about people’s reactions to hardship and dire situations. Typi-
cally in these stories the group starts out as an agreeable and mutually coop-
erative group with some goal in mind. As the hardships increase, the
motivation moves from satisfying self-esteem to satisfying the need for social-
ization to the more basic needs. As the lower levels of needs become unsatis-
fied the individual’s motivation becomes more basic and more self-serving.
In World War II prison camps, these basic needs became so motivating that
people performed acts that they would never have performed under normal
circumstances.
The dynamic order of needs from lower to higher is to first satisfy the
need for food, shelter, and clothing. These are the basic physiological needs
of the individual. Once this has been accomplished or at least relatively well
satisfied, the need for safety and security becomes the motivating factor. In
satisfying this need the individual’s immediate need for the basics has been
satisfied, and the individual seeks out the protection of these satisfying fac-
tors. A person satisfies his or her need for housing and then wants to ensure
that the housing is secure far into the future.
The need for socialization is next. Once the security of basic needs has
9618$$ $CH4 09-06-02 14:59:20 PS
117 Human Resources Management
been satisfied, the person is motivated by the need to have social contact or
love. In terms of the workplace, a motivating atmosphere would be one
where the individual is made to feel welcome and liked by his or her cowork-
ers. Once a person feels accepted and has a satisfactory amount of love and
acceptance, he or she can be motivated by the need for self-esteem.
The top of the hierarchy of needs is self-actualization. This need is
satisfied by having the feeling that what you are doing is good for its own
sake, and it is not necessary to have the recognition of a peer or even a
manager. The person’s own self-interest is enough to motivate.
In the 1970s many companies tried to implement this method of moti-
vation. It was felt that the basic needs of food, shelter, clothing, security,
and safety were already satisfied and that employee motivation could be
achieved by increasing workers’ ability to socialize. Companies attempted to
make their employees ‘‘one big happy family.’’ Generally, this was attempted
by building golf courses and country clubs and encouraging company spon-
sored after-hours activities. In general, these programs failed. People’s need
for socialization was already satisfied, and giving them more of these things
did not motivate them further. One side effect of this kind of program
was that when these things were later withdrawn there was a great deal of
dissatisfaction, and employees become demotivated.
Hertzberg’s Motivation/Hygiene Theory
When it became apparent that there were some problems with Mas-
low’s explanation of motivation, the research continued. In fact, the research
was continued by Maslow and his team. One of the team members was
Fredrick Hertzberg. Herzberg developed the motivation/hygiene theory.
The research behind this theory was based on the need to explain some
research where groups of executives and other professionals were interviewed
to determine the things that made them feel good or not good about their
work. The concept is that if there are things that make you feel good about
working, then these things should also be the things that motivate you.
The factors that are linked with people having a good time when they
are working are called ‘‘motivators’’ or ‘‘satisfiers.’’ These were identified as
a sense of achievement and a sense of recognition for things done, the work
itself, responsibility, advancement, growth, and so on.
The factors that were linked with people having a bad time at work
were called ‘‘dissatisfiers’’ or ‘‘hygiene factors.’’ These factors included things
like company policies, relationships with supervisors, salary, relationships
with peers, personal factors, status, security, and others. These items were
9618$$ $CH4 09-06-02 14:59:21 PS
118 Preparing for the Project Management Professional Certification Exam
considered to be environmental in nature, and their loss seemed to be associ-
ated with bad feelings. Bad feelings were demotivating. People did not like
to do their job when it caused them to feel bad.
To summarize Hertzberg’s conclusions, when hygiene factors are main-
tained, dissatisfaction is avoided. When the hygiene factors are not main-
tained, dissatisfaction occurs and motivation cannot happen. An unhappy
person will not respond to things that make a happy person more motivated.
The organization must carefully maintain the hygiene factors by having
a good personnel policy and good leadership practices. To motivate people a
feeling of achievement and recognition for work done must be created. Peo-
ple must feel responsibility for their work and feel empowered to do it.
This is of course what the principles behind the human factors in project
management are all about.
Supervisory Style and Delegation
All of these theories seem to indicate that the most motivational meth-
ods that can be used will center on high maintenance of the hygiene factors
that Hertzberg uses in his explanation. Companies must have good and fair
pay policies, good supervision and leadership, and all of the other environ-
mental factors that make an employee workplace an environment conducive
to good work. Without these things the employees will probably not work
to their fullest potential.
Work can be designed so that it improves a person’s sense of achieve-
ment and recognition. People need to be responsible for the work that they
do and have the tools and means at their disposal to complete the work.
Employees should feel that they participate in the process of work assign-
ment.
Job and Work Design
Many large organizations in the past simply expected employees to per-
form the job for which they were paid. The employees’ happiness was of
little concern. The concept was that people were there to do work for the
company, and they could be happy on their own time. The attitude seemed
to be, ‘‘Here is a meaningless repetitive job. In return for doing it we will
give you money and other rewards. You have to spend eight hours a day here
doing this work that you do not like so that you can ultimately have time to
yourself and money to spend.’’
Under this system employees became very unhappy and resented the
company. This was evident in an aggressive attitude toward the organization
9618$$ $CH4 09-06-02 14:59:22 PS
119 Human Resources Management
or apathy or lack of interest in the company at all. The results of this attitude
were evident in conflict between company representatives and employees.
Managers came to think that the employees did not care about the company
and its success or failure, and the employees did not think that the company
cared about their well-being.
For these reasons it is necessary for job design to take place. The pur-
pose of job design is to change these attitudes toward work. They are particu-
larly important to the project manager, because a project environment is
often uncertain and insecure for the project team, and the proper design of
the job of the project team is therefore important to the success of the project
team and the project.
Job Enlargement. Job enlargement is done by simply making the job
larger. Going back to the ideas of Henry Ford and Fredrick Taylor, the idea
of the assembly line job was to have the job as short as possible to minimize
training and maximize interchangeability of people on the job. The objective
was to be able to keep the assembly line going even though changes in the
workers and other problems might occur.
In an assembly line the work is broken down into very small units, and
each person does a small amount of the total work required. For example, in
a new Saab automobile plant in Sweden, the Saab engineers estimated that
a subassembly of the engine could be manufactured in 12.6 minutes using
assembly line techniques. The engineers also determined that a single person,
working by himself or herself, could make the same subassembly in 30 min-
utes. On the assembly line the job of each of the workers was only 1.8
minutes each. By enlarging the job the size of the job went from 1.8 minutes
to 30 minutes.
Although the total effort spent to manufacture the subassembly was
larger, Saab felt that the total life cycle cost of assembling the engine was
lower. This was due to a much higher motivation, lack of boredom, and a
feeling of accomplishing something meaningful. The workers felt good
about their job and were much more motivated. This resulted in lower levels
of waste and rework due to poorly assembled engine subassemblies. The cost
of defects in the engine subassemblies was quite high if the defect caused
serious damage to other parts or if the engine ultimately failed in the field.
All of the other costs of unmotivated employees also served to offset
the additional time of assembly. Disruptions due to worker absenteeism,
tardiness, poor attitude, and so on served to additionally offset the total cost
of the assembly.
One problem with job enlargement is that in enlarging the job it is
9618$$ $CH4 09-06-02 14:59:22 PS
120 Preparing for the Project Management Professional Certification Exam
possible to take a small meaningless job and make it into a large meaningless
job. It would not be particularly motivating for an assembly line worker who
is responsible for tightening four screws if his or her job was enlarged to
tightening sixteen screws.
Job Enrichment. Job enlargement was improved by the concept of job
enrichment. The crucial difference was that job enrichment programs not
only enlarged the job to make it more meaningful to the worker but also
changed the nature of the job itself to make it more motivating.
The major difference between an enlarged job and an enriched one is
that the enriched job includes a planning and control task as well as the
operating task. Previously, the planning and control of work was done by
someone else, and the operational part of the work was the only part that
was delegated.
An example of job enrichment is the operation of an automotive main-
tenance facility. Without job enrichment the mechanic is given assignments
from the manager. When each assignment is completed the mechanic goes
on to the next assignment. The manager does all of the planning and sched-
uling work. The manager does the entire interface with the customer. With
job enrichment, the mechanic is required to talk to the customer and deter-
mine what problems needed to be addressed in agreement with the customer.
The mechanic might actually be required to schedule the work and promise
the customer when the work would be completed.
Another important characteristic of job enrichment is that the informa-
tion flows from the persons furnishing the input information directly to
the persons needing the information. This is different than the traditional
nonenriched job where most information is first sent to the supervisor and
then retransmitted to those in need of the information. In this way a rela-
tionship is formed between the person doing the work and the person bene-
fiting from the work being done.
In job enrichment there are four motivational effects that occur: a lack
of boredom; a feeling that the work is meaningful; a feeling of being respon-
sible for the consequences of what work is done and how it is done; and a
feeling of competence in accomplishing the task.
In project management, job enrichment is fundamental to the manage-
ment of the project. Each of the persons on the project team as well as the
stakeholders of the project are encouraged to make their own individual
plans for the work that they do. In fact, the work that each individual associ-
ated with the project does is discovered and self-assigned in the course of the
planning and execution of the project. People working on projects should
9618$$ $CH4 09-06-02 14:59:23 PS
121 Human Resources Management
design their own tasks, plan them, estimate the cost and time necessary to
do them, and provide feedback to the stakeholder needing the work to be
done.
Quality Circles. Quality circles are ad hoc organizations within the
company and the project team. They are a volunteer group of people that
have mutually agreed to address some sort of problem. They can be com-
posed of anyone in the organization desiring to address the problem, and
membership must be voluntary.
Quality circles must be supported by the company organization but
not managed by it. Facilities, support, and time to meet and work on issues
that the quality circle is addressing must be given to them.
Let us say, for example, that there is a problem with a high number of
defects in the paint of an automotive fender. A group of volunteers can form
a quality circle to address the problem. The group might consist of assembly
workers, inspectors, quality assurance engineers, paint engineers, and so on.
The company assigns a facilitator to assist the quality circle in achieving its
goal.
The quality circle meets on company time, discusses the problem, and
attempts to analyze problems and solutions. The facilitator attempts to make
resources available to them and to ensure that they have access to managers
that must ultimately approve their solution to the problem.
This is in keeping with the aims of job enrichment in that each person
on the quality circle is there voluntarily, is responsible for the planning,
execution, and feedback of what he or she does, has an interest in the results,
and feels responsible for the process.
Power
Power is the ability of one person to influence the behavior of another. In
project management, understanding power and the use of power can have a
great effect on the outcome of the project.
Forms of Power
Power is not simply the brute force necessary to bend someone to your will.
There are several ways that people can be influenced.
Coercive Power and Reward Power
Coercive power is based on the idea in the mind of the person being
influenced that the person having the influence has the ability to inflict
9618$$ $CH4 09-06-02 14:59:23 PS
TEAMFLY
Team-Fly
®
122 Preparing for the Project Management Professional Certification Exam
punishment or pain. This pain will be unpleasant, and it will be more un-
pleasant than doing the task.
Reward power is based on the idea in the mind of the person being
influenced that the person having the influence has the ability to administer
some sort of reward. This reward will be pleasant, and it will be more pleas-
ant than any unpleasantness associated with doing the task.
Coercive and reward power depend on the person being influenced
believing that the thing being requested can actually be done, that the reward
or punishment can actually be given by the influencer, and that the reward
or punishment is sufficient to motivate the person being influenced to do
the work.
For example, if parents want to influence the grades of their child, they
might try to influence the child by offering to buy him or her a car if the
child gets straight A’s next year in high school. The child may feel that there
is no possible way of achieving this goal. In this case, the influence will not
take place. The child may feel that the parents will not be able to deliver the
reward if the goal is achieved, and again the influence will not take place.
Finally, the child may not care about getting the reward offered, in which
case the influence will not take place.
Legitimate Power
Legitimate power is based on the idea in the mind of the person being
influenced that the person having the influence has this influence because of
the values of the person being influenced. In other words, the influenced
person believes that the person influencing has the right to do this through
formal authority in the organization.
For example, in medieval societies, the king was obeyed because every-
one believed he had that authority from God. Although response to this sort
of power may have once been motivated by fear, over time the power is
changed into a tradition. The person who is the influencer has power over
others even if he or she lacks the power to punish and reward any longer.
When a new employee starts to work in a firm, the authority and chain
of command in the company is clearly explained to him or her. As long as
people wish to work for this company they agree to respect the legitimate
authority of those in positions above them.
Referent Power
Referent power is based on the idea in the mind of the person being
influenced that the person having the influence has this influence based on