Small Business Marketing for Dummies Second Edition by Barbara Findlay Schenck_3 pdf
Bạn đang xem bản rút gọn của tài liệu. Xem và tải ngay bản đầy đủ của tài liệu tại đây (391.75 KB, 26 trang )
months. The motel would be wise to offer summer guests special incen-
tives that encourage them to return in the spring and fall to build year-
round business.
ߜ National and international guests account for approximately one-quarter
of the motel’s business. Because these guests are a far-flung group, the
cost of trying to reach them in their home market areas via advertising
would be staggering. Instead, the motel managers might research how
they found out about the motel in the first place. If they booked following
advice from travel agents or tour group operators, the managers might
cultivate those sources for more bookings. Or, if they made their decisions
while driving through town, the motel would benefit from a few well-
placed billboard ads to inspire more such spur-of-the-moment stays.
Conduct a similar analysis for your own business:
ߜ How do your products break down into product lines? (See Chapter 3 for
more information about this important topic.)
ߜ What kind of customer is the most prevalent buyer for each line?
If you determine that one of your product lines attracts customers who are
highly discerning and prestige-oriented, you probably won’t want to employ a
strategy that relies on coupons, for example. Likewise, if you know that a cer-
tain product line appeals to a particularly athletic or health-conscious group,
you can forget about trying to prompt purchases by offering such things as
all-you-can-eat dinners.
Tracing your distribution channels
Distribution is the means by which you get your product to the customer. A
good distribution system blends knowledge about your customer (from the
first half of this chapter, that part should be clear) with knowledge of how
that person ended up with your product (that’s what distribution is about).
It’s often a surprisingly roundabout route.
To demonstrate, take a look at how visitors might arrive at a local museum or
cultural attraction.
Say that 50,000 visitors walk through the turnstiles every year. Suppose that
10,000 of those visitors are school groups who arrive on school buses, 5,000
arrive as part of tour groups, 5,000 arrive with tickets prepurchased through
local motels and hotels, 5,000 prepurchased their tickets online through the
Web sites of the museum and the regional visitor bureau, 5,000 arrive with
tickets distributed by partner businesses as part of special promotional
programs, and 20,000 arrive at the museum’s entry gate as either museum
members or independent visitors.
29
Chapter 2: All About Customers
06_578391 ch02.qxd 12/28/04 8:56 PM Page 29
Based on these numbers, the museum is distributing its tickets through the
following channels:
ߜ Educators (possibly influenced by curriculum directors)
ߜ Tour companies (possibly influenced by state or local travel bureaus)
ߜ Lodging establishment front desks (probably influenced by hotel and
motel marketing departments)
ߜ The Internet (possibly influenced by state or local travel bureaus)
ߜ Partner businesses (through museum promotional efforts)
ߜ The museum entrance gate (influenced by museum marketing efforts)
This method results in channels of distribution as shown in Table 2-3.
Table 2-3 Channel Distribution Analysis
Distribution Ticket Revenue # of Guests/% Sales Revenue/%
Channel of Total of Total
Educators $5 10,000/20% $50,000/16%
Tour companies $6 5,000/10% $30,000/10%
Motels/hotels $6.50 5,000/10% $32,500/11%
Internet
Museum Web $8 3,000/6% $24,000/8%
site
Visitor Bureau $6.50 2,000/4% $13,000/4%
Web site
Museum entry
gate
Museum members $3 5,000/10% $15,000/5%
Independent $8 15,000/30% $120,000/39%
visitors
Partnering $4 5,000/10% $20,000/7%
businesses
Study the channels through which your business generates customers and
the levels of business that come through each one.
30
Part I: Getting Started in Marketing
06_578391 ch02.qxd 12/28/04 8:56 PM Page 30
1. Track changes by distribution channel.
If you start to see one distribution channel decline radically, either you
need to give that channel more marketing attention or enhance another
channel to replace the distribution loss.
2. Compare percentage of sales to percentage of revenue from each
channel.
You can see which channels deliver higher-than-average and lower-than-
average income per unit sold. Channels that deliver lower-than-average
income per unit should involve lower-than-average marketing invest-
ment or they should deliver some alternative benefit to your business.
For example, in the case of the museum in Table 2-3, the tickets distrib-
uted through partnering businesses deliver lower-than-average revenue
and likely require a substantial marketing investment. Yet they introduce
new people to the museum and therefore cultivate membership sales,
donations, and word-of-mouth support.
3. Communicate with the decision makers in each distribution channel.
Once you know your channels and who influences each one, you know
exactly whom to contact with special promotional offers or marketing
information. For example, if school groups arrive at a museum because
the museum is on an approved list at the state’s education office, that
office is the decision point and it is where the museum would want to
direct marketing efforts. If they arrive because art or history teachers
make the choice, the museum would want to get information to art or
history teachers.
There’s an old, self-evident saying: “Without customers, a business is out of
business.”
When in doubt, spend more — not less — time defining, communicating with,
and nurturing your customers. The more you know about who they are,
where they are, and what motivates their buying decisions, the easier it is to
make marketing decisions that deliver positive results.
31
Chapter 2: All About Customers
06_578391 ch02.qxd 12/28/04 8:56 PM Page 31
32
Part I: Getting Started in Marketing
06_578391 ch02.qxd 12/28/04 8:56 PM Page 32
Chapter 3
Seeing Your Product through
Your Customers’ Eyes
In This Chapter
ᮣ Honing in on why your customers choose your product
ᮣ Putting your unique selling proposition into words
ᮣ Rating the value of your product or service
ᮣ Calculating your product’s price/value equation
ᮣ Charting your product’s life cycle
ᮣ Extending and diversifying your product line
T
he best products aren’t sold — they’re bought.
Yet you’ll never hear a customer say he bought a lemon at the used car lot.
Nope, someone sold him that lemon — but hopefully not you or your busi-
ness. If you’re a good marketer, when it comes time for the purchase, you
aren’t selling anyone anything. Instead, you’re helping customers to select
the right products to solve their problems, address their needs, or fulfill their
desires. You’re helping them buy.
As a result, you devote the bulk of your marketing efforts to the steps that
take place long before money changes hands. These efforts involve targeting
customers, designing the right product line, and communicating your offer-
ings in terms that address the customer’s wants and needs. Then when the
customer is ready to make the purchase, all you have to do is facilitate a
pleasant exchange and make sure he or she feels good about trading money
for the right product.
Chapter 2 focuses on your customers — who they are, where they are, and
what needs they have. This chapter puts the spotlight on everything there is
to know about your products and, even more so, on all the reasons your cus-
tomers would want to buy those products from you.
07_578391 ch03.qxd 12/28/04 8:53 PM Page 33
In a Service Business, Service
Is the Product
If your business is among the great number of companies that sell services
rather than three-dimensional or packaged goods, from here on when you see
the word product, think service. In your case, service is your product.
Today, nearly 80 percent of all Americans work in service companies.
Services — preparing tax returns, writing wills, creating Web sites, unclog-
ging kitchen drains, styling hair, or designing house plans, to name a few —
aren’t things that you can hold in your hands. In fact, the difference between
services and tangible products is that customers can see and touch the tan-
gible product before making the purchase, whereas when they buy a service
they need to commit to the purchase before seeing the outcome of their
decisions.
Even nonprofit organizations have products. Look at a Boys and Girls Club.
One of its products is the service it provides to young people. Another is the
recognition and satisfaction it provides to benefactors who contribute funds
to keep the club in business. If it rents the club facility to other groups to use
during off-hours, the rental activity represents yet a third “product.”
If you generate revenue, then you’re selling something — your product.
Telling “Just the Facts” about
What You Sell
Freeze-frame your business to study the products you offer your customers.
To get started, consider the products of a lakeside resort as an example. The
owners would list the number of cabins, seats in the restaurant, and row-
boats for rent. Then they’d include the shopping opportunities provided by
the resort’s Barefoot Bait Shop. Their list might also include summer youth
camps, winter cross-country ski packages, and all-inclusive corporate
retreats.
A law office might describe its product offerings by listing the number of
wills, estate plans, incorporations, bankruptcies, divorces, adoptions, and
lawsuits it handles annually. And if it’s well managed, the lawyers will know
which of those product lines are profitable and which services are performed
at a loss in return for the promise of future business or a larger customer
relationship.
34
Part I: Getting Started in Marketing
07_578391 ch03.qxd 12/28/04 8:53 PM Page 34
What about your business?
ߜ What do you sell? How much? How many? What times of year or week or
day do your products sell best?
ߜ What does your product or service do for your customers? How do they
use it? How does it make them feel?
ߜ How is your offering different and better than your competitors’?
ߜ How is it better than it was even a year ago?
ߜ What does it cost?
ߜ What do customers do if they’re displeased or if something goes wrong?
The faster you can answer these questions, the better you understand your
business. And the better you understand your business, the more able you
are to steer its future.
Tallying your sales by product line
Make a list of every kind of product you offer to your customers, along with
the revenue generated by each offering. Concentrate only on the end products
you deliver. For example, a law office provides clerical services, but those
services are part of other products and are not the reason why a person does
business with the attorneys in the first place — so they shouldn’t show up on
the attorney’s product list.
To get you started, Table 3-1 shows products for a bookstore.
Table 3-1 Independent Bookstore Product Analysis
Product Product Revenue Percentage of Revenue
Books $250,000 44%
Magazines $95,000 16%
Coffee and pastries $95,000 16%
Greeting cards and gift items $55,000 9%
Audio books $45,000 8%
Audio book rentals $18,500 3%
Pens and writing supplies $18,000 3%
35
Chapter 3: Seeing Your Product through Your Customers’ Eyes
07_578391 ch03.qxd 12/28/04 8:53 PM Page 35
Using the cash register to steer
your business
Your product analysis will detail exactly which products your customers are
buying. You can put this information to work as you prioritize and manage
your product line.
ߜ Sell what people want to buy: Study your list for surprises. You may
find products that are performing better than you imagined. This knowl-
edge will alert you to changes in customer interests that you can ride to
higher revenues. As an example, the bookstore owners in Table 3-1 real-
ized when they scoured their product analysis that nearly a third of all
revenues were coming from the combined activity of beverage/pastry
and magazine sales. This finding led to the decision to move the maga-
zine display nearer to the café, giving each area a greater sense of space
and bringing consumers of either offering into nearer proximity, and
therefore buying convenience, of the complementary offering.
ߜ Promote the products that you’ve hidden from your customers: You
may have a product line that is lagging simply because your customers
aren’t aware of it. When the bookstore in Table 3-1 realized that only
3 percent of revenues were coming from sales of pens and writing sup-
plies, they decided to try boosting the line by enhancing and moving the
display to a more prominent store location. Sales increased. Had the line
continued to lag, though, the owners were ready to replace it with one
capable of drawing greater customer response.
ߜ Back your winners: Use your product analysis to track which lines are
increasing or decreasing in sales and respond accordingly. If the book-
store in Table 3-1 is fighting a decline in book sales (perhaps due to sales
erosion by deep discounters and online booksellers) while sales of cards
and gifts are growing, the owners might decide to capitalize on the trend
by adding an array of reading accessories, including lamps, bookshelves,
and even reading glasses.
ߜ Bet on product lines that have adequate growth potential: Before com-
mitting increased marketing dollars to a product line, use your product
analysis to project your potential return on investment. For example, a
glance over the bookstore revenues shows that 3 percent of sales result
from audio book rentals. If the store could double this business, it would
increase annual revenues by only $18,000. Realizing this, the owners need
to ask themselves: What is the likelihood that we’re going to double this
business — and at what cost? On the other hand, if the bookstore could
increase café sales by just 20 percent, it would realize $19,000 of addi-
tional revenue, which the owners might decide is a safer marketing bet
and a stronger strategic move.
36
Part I: Getting Started in Marketing
07_578391 ch03.qxd 12/28/04 8:53 PM Page 36
Illogical, Irrational, and Real Reasons
People Buy What You Sell
When you can buy bread for under a dollar at the grocery store, why would
anyone pay nearly $5 to pick up a loaf at the out-of-the-way Italian bakery?
Why pay nearly double for a Lexus instead of a Toyota, when some models of
both are built on the same chassis with many of the same components?
For that matter, why would people seek cost estimates from three different
service providers and then choose the most expensive bid when all three
offer nearly the same proposed solution?
Why? Because people rarely buy what you think you are selling.
People don’t buy your product. They buy the promises, the hopes, or the sat-
isfaction that they believe your product will deliver.
They buy the $5 loaf of salt-crusted rosemary bread because it satisfies their
sense of worldliness and self-indulgence. They opt for the high-end sedan for
the feeling of prestige and luxury it delivers. They pay top price for legal,
advertising, or accounting services because they like having their name on a
prestigious client roster — or maybe they simply like or trust the attorneys,
advertisers, or CPAs more than they do the people who provided the lower
cost estimates.
People may choose to buy from your business over another simply because
you make them feel better when they walk through your door.
Don’t fool yourself into thinking that you can win your competitor’s customers
simply by matching features or price.
People decide to buy for all kinds of illogical reasons, and then they justify
and rationalize their purchases by pointing out product features, services, or
even the price tag. They buy because they see some intangible and often
impossible-to-define value that makes them believe the product is a fair trade
for the asking price. Often that value has to do with the simple fact that they
like the people they’re dealing with. Never underestimate the power of a per-
sonal relationship.
37
Chapter 3: Seeing Your Product through Your Customers’ Eyes
07_578391 ch03.qxd 12/28/04 8:53 PM Page 37
Buying Decisions Are Rarely about Price,
Always about Value
Whatever you charge for your product, that price must accurately reflect the
way your customer values your offering.
If a customer thinks your price is too high, expect one of the following:
ߜ The customer won’t buy.
ߜ The customer will buy but won’t feel satisfied about the value, meaning
you win the transaction but sacrifice the customer’s goodwill and, possi-
bly, the chance for repeat business.
ߜ The customer will tell others that your products are overpriced.
Before you panic over being called high-priced by a customer, remember that
it is only bad news if others respect this particular person’s opinions regard-
ing price and value. It’s often better to let a cherry-picking bargain hunter go
than to sacrifice your profit margins trying to price to that person’s demand-
ing standards. If your prices are on the high end, though, just be certain that
the quality, prestige, and service — the value — that you offer is commensu-
rate with your pricing.
Then again, if a prospect thinks your product is worth more than its price tag
ߜ You may sacrifice the sale if the prospect interprets the low price as a
reflection of a second-rate offering.
ߜ You may make the sale, but at a lower price (and lower profit margin)
than the customer was willing to pay, leaving money in her billfold and
possibly a question mark in her mind.
ߜ The customer may leave with the impression that you are a discounter.
That perception will steer the kinds of purchases he chooses to make
from you in the future.
Unless you really want to try to own the bargain basement position in your
market (a dangerous strategy because some other business can always beat
you by a penny), you’re better off providing excellent value and setting your
prices accordingly.
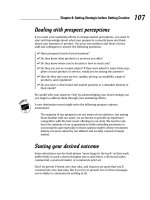
The value formula
During the split second that customers rate the value of your product, they
weigh a range of attributes (see Figure 3-1):
38
Part I: Getting Started in Marketing
07_578391 ch03.qxd 12/28/04 8:53 PM Page 38
ߜ What does it cost?
ߜ What is the quality?
ߜ What features are included?
ߜ Is it convenient?
ߜ Is it reliable?
ߜ Can they trust your expertise?
ߜ How is the product supported?
ߜ What guarantee, promise, or ongoing relationship can they count on?
These considerations start an invisible mental juggling act to determine
what, in the customer’s mind, is the value of your offering.
If your product’s quality and features are only average, then they’ll expect a
low price to tip the deal in your favor.
On the other hand, if customers place a premium on your promise of reliabil-
ity (think Federal Express), they’ll likely cut you some slack when it comes to
low price or convenience.
Have you heard the old chestnut, “Price, Quality, and Speed — choose any
two”? Well, for successful 21st-century small businesses, those days are gone.
Your customer expects you to be the best at one and competitive in all three
areas. Not the best in all three areas — but at least competitive.
Here are some well-known examples:
ߜ Costco = Best price
ߜ Nordstrom = Best service
ߜ Starbucks = Best product
The Value Formula
Price
Quality
Features
Convenience
Reliability
Expertise
+ Support
V A L U E
How Customers Compute Value
Figure 3-1:
Many
attributes
besides
price
contribute
to a
customer’s
perception
of value.
39
Chapter 3: Seeing Your Product through Your Customers’ Eyes
07_578391 ch03.qxd 12/28/04 8:53 PM Page 39
ߜ Federal Express = Best reliability
ߜ BMW = Best performance
ߜ Rolex = Best quality
Riding the price/value teeter-totter
Price emphasizes the dollars spent. Value emphasizes what is received in
exchange for the dollars spent.
Pricing truths
When sales are down or customers seem dissatisfied, small businesses turn
too quickly to their pricing in their search for a quick-fix solution.
Before you reduce your prices to increase sales or satisfaction levels, think
first about other ways to increase the value you deliver. Consider the follow-
ing points:
ߜ Your customer must perceive the value of your product to be greater
than the asking price. If you charge 99 cents, deliver at least a dollar in
value.
ߜ The less value customers equate with your product, the more emphasis
they’ll put on low price.
ߜ The lower the price, the lower the perceived value.
ߜ Customers like price reductions way better than they like price increases,
so be sure when you reduce prices that you can live with the change,
because reversing your decision — and upping your prices again later —
may not settle well.
ߜ Products that are desperately needed, rarely available, or one-of-a-kind
are almost never price-sensitive.
The difference between penny-pinching and shooting the moon
What makes a product price-sensitive?
Tell a person he needs angioplasty surgery, and he’ll pay whatever the car-
diac surgeon charges — no questions asked. But tell him he’s out of dish-
washer detergent, and he’ll comparison shop. Why? Because one product is
more essential, harder to substitute, harder to evaluate, and needed far less
often than the other. One is a matter of life and death, the other mundane.
See where your product fits by checking out Table 3-2.
40
Part I: Getting Started in Marketing
07_578391 ch03.qxd 12/28/04 8:53 PM Page 40
Table 3-2 Price Sensitivity Factors
Price Matters Less if Products Are: Price Matters More if Products Are:
Hard to come by Readily available
Purchased rarely Purchased frequently
Essential Nonessential
Hard to substitute Easy to substitute
Hard to evaluate and compare Easy to evaluate and compare
Wanted or needed immediately Easy to put off purchasing until later
Emotionally sensitive Emotion-free
One-of-a-kind A dime a dozen
Pricing considerations
Give your prices an annual checkup. Here are the factors to consider and the
corresponding questions to ask:
ߜ Your price level: What is the perceived value of this product compared
with its price? What are the prices of competitive products? How easily
can the customer find a substitute — or choose not to buy at all? (See
Chapter 4.)
ߜ Your pricing structure: How do you price for extra features/benefits?
What features/benefits do you include at no extra charge? What promo-
tions, discounts, rebates, or incentives do you offer? Do you offer quan-
tity discounts?
ߜ Pricing timetable: How often do you change your pricing? How often do
your competitors change their pricing? Do you anticipate competitive
actions or market shifts that will affect your pricing? Do you expect your
costs to affect your prices in the near future? Are there looming market
changes or buyer taste changes you need to consider?
Presenting prices
The way you present your prices can either inspire your prospects — or con-
fuse or underwhelm them. Use Table 3-3 and the following list to show your
prices in the most favorable light:
41
Chapter 3: Seeing Your Product through Your Customers’ Eyes
07_578391 ch03.qxd 12/28/04 8:53 PM Page 41
ߜ Don’t let your offer get too complex.
ߜ Don’t be misleading.
ߜ Do present prices so they look visually attractive and straightforward.
ߜ Do make the price compelling. In today’s world of outlet malls, online
bargains, and warehouse stores, “10 percent off” isn’t considered an
offer at all.
ߜ Do support your pricing announcements with positive reasons and
added benefits. Price alone is never reason enough to buy.
Table 3-3 Pricing Presentation Do’s and Don’ts
Don’t Do Why
We’ve just cut our nightly Announcing a new The second approach
rates — $89 mid-week. St. Louis number to makes the deal sound
Some restrictions apply. remember — $89 per noteworthy, whereas
night the first approach
provides no positive
rationale and implies
that “small print
applies.”
Sofa and Loveseat Sofa and Loveseat $1,995 When prices are more
$1,995.00 than $100, drop the
decimal point and
zeroes to lighten the
effect.
25% off two or more 1/2 off second pair Complicated discounts
are uninspiring, plus
“1/2 off” sounds like
double the discount of
25% off when you buy
two.
30% off Regularly $995; now 1/3 off sounds more
$695 while supplies compelling than 30%
last off; but showing a
$300 reduction is
stronger yet. “While
supplies last” ads
incentive and
urgency.
42
Part I: Getting Started in Marketing
07_578391 ch03.qxd 12/28/04 8:53 PM Page 42
Don’t Do Why
$6.99 each $13.99 — Buy One, Get Sometimes a low
One Free price conveys low
value. Consider dou-
bling the price but
making a powerful
two-for-one limited-
time offer.
$14.95 plus shipping/ $17.95. We pick up all The word “plus”
handling shipping and handling alerts the consumer
that the price is only
the beginning.
Calculate and include
shipping and handling
to remove buyer con-
cern and possible
objection.
State and local taxes State and local taxes “Extra” goes into the
extra apply same category as
“plus” when it comes
to pricing.
The Care and Feeding of Your
Product Line
There are two ways to increase sales:
1. Sell more to existing customers.
2. Attract new customers.
Figure 3-2 presents questions to ask as you seek to build business from new
and existing customers through new and existing products.
43
Chapter 3: Seeing Your Product through Your Customers’ Eyes
07_578391 ch03.qxd 12/28/04 8:53 PM Page 43
Enhancing the appeal of existing products
At least annually, small businesses need to assess whether their products
still appeal to customers or whether it’s time to adjust features, services,
pricing, and product packaging — or make other changes to sustain or
reignite buyer interest. Here are some of your options:
ߜ Same product, new use: Start by looking for ways you can re-present
your offerings.
One of the best historic examples of re-presenting a product comes from
Arm & Hammer baking soda. When people reduced the amount of
baking they did, the amount of baking soda they needed tumbled into
the basement. So, rather than stand by and watch sales slide, Arm &
Hammer responded by reintroducing baking soda — this time not as a
recipe ingredient but rather as a refrigerator deodorizer.
ߜ Same product, new promotional offer: Examine ways to update how you
offer your product to customers, including new customer-responsive
pricing, new packages combining top-selling products with others your
customers may not have tried, or other ways to help your customers see
your offerings with a new appeal.
Be sure your new offerings are true improvements that address cus-
tomer wants and needs. Before you offer a new “deal,” be sure that you
can say yes to the following question: Does this provide customers with
a better, higher-value way to buy your products?
A Web designer may increase sales of consulting services by bundling
quarterly site traffic reporting and analysis with site design, thereby
delivering consulting services to customers who otherwise would have
purchased only design expertise.
A landscape/nursery business may offer half-price terra cotta pots with all
perennial purchases over $50 — thereby giving customers an incentive to
buy higher volumes of flowers and increasing interest in the nursery’s line
of pottery.
How can we sell more
Existing Products to
Existing Customers
What New Products
would build business with
Existing Customers
What New Products
can we offer to attract
New Customers
How can we initiate
sales of Existing Products
to New Customers
Figure 3-2:
Questions to
ask as you
assess your
sales
growth
options.
44
Part I: Getting Started in Marketing
07_578391 ch03.qxd 12/28/04 8:53 PM Page 44
Chapter 4 has more on winning a greater share of your customer’s buying
decisions and thereby increasing your sales to existing customers.
ߜ Same product, new customer: Invite new customers into your business
with a fairly risk-free introductory or trial offer or some other way to
sample your product and service. Issue invitations to free seminars or
guest lectures — or even host a community fundraiser that attracts the
kinds of people you serve. For more information on how to build interest
among new prospects, see Chapter 10.
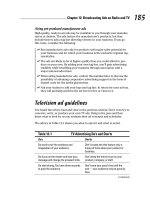
Even products have life cycles
Products get old. They follow a life cycle (shown in Figure 3-3) that begins
with product development and proceeds until the product reaches the point
where it is old hat, at which time its growth rate halts and profits decrease.
Raising a healthy product
Sales follow a predictable pattern as a product moves through the life cycle
illustrated in Figure 3-3. The following descriptions explain the marketing steps
and sales expectations that accompany each phase of the product’s life:
Product Reaches Maturity
Product Life Cycle
Increased Promotion
Competitors Enter
Repeat Purchase and New Sales
New Product Sales
Development
Growth Rate Slows
Similar Products Introduced
Price Wars
Sales Decline
Product Withdrawal or Reinvention
Introduction Growth Maturity Saturation Decline
Figure 3-3:
Sales
follow a
predictable
curve
throughout
the product
life cycle.
45
Chapter 3: Seeing Your Product through Your Customers’ Eyes
07_578391 ch03.qxd 12/28/04 8:53 PM Page 45
ߜ Introductory phase: Build awareness, interest, and market acceptance
while working to change existing market tendencies. Use introductory
offers that motivate prospects to try the product. Drive sales to speed
up your cost/investment recovery.
Though it is tempting to drive early sales through low pricing, be careful
because that first impression will stick and limit your ability to increase
price later. Set the price where it belongs relative to your product value
and gain sales through introductory offers and heavy start-up advertising.
ߜ Growth phase: The product enters this phase once it is adopted by
the first 10 to 20 percent of the market, the market innovators or early
adopters. The masses follow this pace-setting group, and when the masses
start buying, growth takes off. At this point, competitors enter. Consider
promotions and special offers to protect and build market share.
ߜ Maturity: When the product reaches maturity, its sales are at their peak
level and sales growth starts to wind down.
ߜ Saturation phase: The market is now flooded with options. Sales come
largely from replacement purchases. Pricing offers and other incentives
are needed to recruit new customers and win them from competitors.
ߜ Declining phase: When the product reaches the depth of its sales
decline, a business has several choices. One is to abandon the product
in favor of new opportunities, perhaps introducing phaseout pricing to
hasten the cycle closure. Another is to let the product exist on its own
with minor marketing support and, as a result, minor sales expectations.
Yet a third option is to reinvent the product’s usage, application, or dis-
tribution to gain appeal with a new market.
Developing new products
Whether it is to seize a new market opportunity or to offset shrinking sales
with replacement products, one of the most exhilarating aspects of small
business is introducing new products. It’s also one of the most treacherous,
because it involves betting your business resources on a new idea. Figure 3-4
shows the product development process. Follow it, without jumping over the
important middle step, to minimize your risk.
The Chinese character for “crisis” combines characters representing
“danger” and “opportunity.” Proceed with caution to avert danger while you
seize opportunity by adding new products to your line.
46
Part I: Getting Started in Marketing
07_578391 ch03.qxd 12/28/04 8:53 PM Page 46
As you pursue a new product idea, push yourself by asking these questions:
ߜ What current product can we significantly update or enhance?
ߜ What altogether new idea will satisfy the known wants and needs of our
customers and prospective customers?
ߜ What market trend can we ride via a new product?
Many new products are developed to address some hot new market trend.
Before you consider riding a market trend, though, be sure you aren’t entering
too late. Take a second to review Figure 3-3, the product life cycle. If you enter
when a product is already in the saturation phase, you have to offer pricing
and other incentives to win business from the line-up of competitors already
in the field. If you do decide to offer a product responsive to a market trend,
have a marketing plan that allows you to get in and get out fast, so that you’ve
realized success and moved on before the product idea reaches its end.
Here are questions to ask during the research stage of product development:
ߜ Is it unique? Is it already being produced or offered by another business,
and, if so, how will your product be different — and better?
ߜ Does it deliver customer value? If this is an upgrade of an existing prod-
uct, how is it different in a way that will matter to your customer?
ߜ Does it have market potential? Will it appeal to a growing market? What
is its customer profile? What do potential customers say about it?
ߜ Is it feasible? What will it cost to produce or deliver, and how much can
you charge for it?
ߜ Is it credible? Does it fit with your company image? Is it consistent with
what people already believe about you or does it require a leap of faith?
ߜ Is it legal and safe? Does it conform to all laws? Does it infringe on any
patents? Does it have safety concerns?
LAUNCHIDEA
EVALUATION,
RESEARCH,
TESTING
Figure 3-4:
Give special
attention to
the middle
step in the
product
development
sequence.
47
Chapter 3: Seeing Your Product through Your Customers’ Eyes
07_578391 ch03.qxd 12/28/04 8:53 PM Page 47
ߜ Can you make and market it? Do you have the people and cash
resources to back it? Can you get it to market? Is it easily feasible for
success?
ߜ Can you find a unique niche in the marketplace for it? The topic of
positioning and branding products is a chapter unto itself, so turn to
Chapter 7 for more information.
As you study new product ideas, beware of the following:
ߜ Features that don’t inspire your customer
ߜ Features that don’t deliver clear customer benefit
ߜ Product enhancements that don’t add significant product value
ߜ “New” products that are really old products in some newfangled disguise
that means nothing to customers
ߜ Products that don’t fit within your expertise and reputation
ߜ Products that address fads or trends that are already starting to wane
Product line management isn’t about what you’re selling; it’s about what the
market is buying. Keep your focus on your customers — on what they value
not just today, but tomorrow.
48
Part I: Getting Started in Marketing
07_578391 ch03.qxd 12/28/04 8:53 PM Page 48
Chapter 4
Sizing Up Competitors and
Staking Out Market Share
In This Chapter
ᮣ Getting a handle on the competition
ᮣ Winning market share from direct competitors
ᮣ Overcoming your secondary competition
ᮣ Unveiling your phantom competitors
ᮣ Raising your competitive ranking
ᮣ Anticipating your future competitive environment
N
o matter how unique your offering, no matter how much you think you
play on a “field of one,” even if you’re the only hitching post in a one-
horse town, you have competition.
Every business has competition.
When Alexander Graham Bell called to Mr. Watson through his newfangled
invention in 1876, even he already had competition. He held in his hand the
one and only such device in the whole wide world, yet from its very moment
of inception, the idea of the telephone had to fight for market share. It had to
compete with all the existing and more familiar means of message delivery —
plus it was certain to spawn a crop of copycat products to vie for message
delivery in the future.
Competition may not be obvious. It may not even be direct. But it is always
there. The sooner you face it and plan for it, the better. This chapter shows
you how.
08_578391 ch04.qxd 12/28/04 9:04 PM Page 49
Playing the Competitive Field
Competition is the driving force in nature and it’s also the core of the free
enterprise system as we’re lucky to know it. Competition occurs whenever
winning attention is necessary for selection and survival. In nature, the pea-
cock’s tail, the rose’s scent, and the apple’s sweetness are the marketing
tools, while in business the battle is fought and won with marketing programs
designed to attract customers to one business over another.
Thanks to the forces of competition, the free enterprise system is undergoing
constant improvement. Here are a few examples:
ߜ Competition prompts product upgrades and innovations.
ߜ Competition leads to higher quality and lower prices.
ߜ Competition enhances selection.
ߜ Competition inspires business efficiencies.
Competition is the contest between businesses for customers and sales. The
opposite of competition is a monopoly, where a single company has complete
control of an industry or service offering.
The terminology of competition
Your sales figures provide your first indication of how you’re doing in your
competitive arena. If they are strong and growing, your business is on the
right track. If they’re sliding downhill, you have your work cut out for you.
Either way, you can take control of your sales — and therefore of your busi-
ness success — by using the information in this chapter to gauge and grow
your “share” of business, as defined by your market share, share of customer,
and share of opportunity.
Market share
Market share is your slice of the market pie — or your portion of all the sales
of products like yours that are taking place in your market area. For example,
say that you manage a movie theatre in a market with a dozen other movie
theatres within a reasonable driving distance. Your market share would be
the percentage that your theatre sells of all the movie tickets sold by all 13
movie theatres. See the “Calculating Your Market Share” section later in this
chapter for tips on how to determine and grow your market share.
50
Part I: Getting Started in Marketing
08_578391 ch04.qxd 12/28/04 9:04 PM Page 50
Share of customer
Share of customer is the percentage that you capture of all the possible pur-
chases that your customer could make at your business. Continuing with the
movie theatre example, in addition to tickets, the theatre sells popcorn, soda,
candy, movie posters, “movie money” gift certificates, and who knows what
else. Every customer who purchases just a movie ticket — nothing else —
represents lots of room for growth in terms of share of customer, also known
as share of billfold. For tips on calculating and growing your share of cus-
tomer, see Chapter 19.
Share of opportunity
Share of opportunity looks beyond existing customers and competitors to
consider who is not buying products like the ones you’re selling — and what
it might take to get those people to see your product as a solution to their
needs.
Years ago, Coca-Cola released research documenting that nearly six billion
people in the world were consuming, on average, 64 ounces of fluid a day. Of
that total intake, only two ounces of the liquid consumed was in the form of
Coca-Cola. Coca-Cola officials used this information as the basis of an effort
to increase what they termed their share of stomach.
This kind of planning goes beyond market share (how much of all soft drink
purchases are captured by Coke), and even beyond share of customers (how
much of each Coke drinker’s total soft drink purchases are captured by Coke).
It moves into the arena of market development by capturing sales by likely
customers who are currently opting for alternatives rather than purchasing
cola products.
Find a “stomach share” analogy for your business. What satisfaction does
your product address? What solution does your business provide? Then
think about how you can present your products to grab a greater share of
that total opportunity. Here are a couple more examples:
ߜ A roller rink sells skating, of course, but it also provides a solution for
youth and teen recreation. Its opportunity reaches to include all kids
who spend money to fill out-of-school hours. When considering how to
grow its share of the total market opportunity, the roller rink owners
might think in terms of birthday party share or youth leisure time share.
ߜ An insurance brokerage sells life insurance, which provides a solution
for peace of mind. Its competition comes from competing insurers and
all the other ways people address their desire for financial security —
including everything from investing in stocks to stashing money under
the mattress to buying lottery tickets. The insurance brokerage might
want to think in terms of how to increase its nest egg share.
51
Chapter 4: Sizing Up Competitors and Staking Out Market Share
08_578391 ch04.qxd 12/28/04 9:04 PM Page 51
Knowing what you’re up against
Your business faces three kinds of competition, as illustrated in Table 4-1.
Direct competitors
These businesses offer the same kinds of products or services you do and
appeal to customers in the same geographic markets where you do business.
To increase your market share, think about how you can woo business away
from your direct competitors and over to your business.
Indirect competitors
You’re either losing sales to or splitting sales with these businesses. For
instance, if you’re selling paint, and your customer is buying the paintbrush
somewhere else, that brush seller is an indirect competitor of your paint store,
because it is capturing the secondary sale. To increase your share of customer,
figure out what kind of business is being won by your indirect competitors.
Then find a way to serve as a one-stop solution for your customers by offering
your primary product and also the secondary, complementary, or add-on prod-
ucts that your customers currently leave your business to obtain elsewhere.
Phantom competitors
No one has to buy what you’re selling. In fact, one of the biggest obstacles to
the purchase — and therefore the biggest phantom competition — is your
customer’s inclination to do nothing at all or to find some alternative or do-it-
yourself solution instead of buying what you’re selling. Taking the paint store
example a step further, if you’re offering the choice between enamel and latex
paint, and your customers are opting for never-need-paint vinyl siding, that
siding outlet is a phantom competitor capable of roadblocking your business.
For that matter, if your customers decide that their houses can go another
year without a paint job, the option to do nothing is your phantom competi-
tor. To increase your share of opportunity, think about where your phantom
competitors are hiding. Then find ways to make your product an easier, more
gratifying, more satisfying, and more valuable alternative.
Table 4-1 Examples of Competition
The Product Direct Indirect Phantom
Competitors Competitors Competitors
Log home Other log Traditional housing Remodeling, motor
construction homebuilders contractors, kit homes, coaches, time-share
manufactured housing offers, doing nothing
52
Part I: Getting Started in Marketing
08_578391 ch04.qxd 12/28/04 9:04 PM Page 52
The Product Direct Indirect Phantom
Competitors Competitors Competitors
Movie theatre Other movie Movie rentals, cable Other leisure activ-
theatres TV, satellite services ities such as attend-
ing sporting events,
listening to live
music, bowling,
watching TV, doing
nothing
Life insurance Other life savings bonds, Paying bills, paying
insurance investment accounts, tuition, buying lot-
brokers IRAs tery tickets, gam-
bling, stashing
money under the
mattress, doing
nothing
How businesses compete
When everything else is equal, most customers opt for the product with the
lowest price. If you want to charge more, make sure that everything else isn’t
equal between you and your lower-priced competitor. Most competitors fall
into one of the following two categories:
ߜ Price competitors: These businesses emphasize price as their competi-
tive advantage. They must be prepared to offset lower profit margins
with higher sales volume. They also have to be prepared for some other
business to beat their price and therefore take away their one-and-only
competitive edge.
ߜ Nonprice competitors: These businesses charge a higher price than
their competitors. They must be prepared to compete and win based on
superior quality, prestige, service, location, reputation, uniqueness of
offering, and customer convenience. In other words, they must offer an
overall value that customers perceive to be worth a higher price tag.
(See “The value formula” section in Chapter 3.)
Winning Your Share of the Market
You win market share by taking business from your direct competitors, there-
fore reducing their slice of the market pie while increasing your own. To
advance in the market share game, here’s what you must do:
53
Chapter 4: Sizing Up Competitors and Staking Out Market Share
08_578391 ch04.qxd 12/28/04 9:04 PM Page 53