Báo cáo hóa học: " Atomic Force Microscopy Study of Protein– Protein Interactions in the Cytochrome CYP11A1 (P450scc)-Containing Steroid Hydroxylase System" docx
Bạn đang xem bản rút gọn của tài liệu. Xem và tải ngay bản đầy đủ của tài liệu tại đây (774.86 KB, 13 trang )
NANO EXPRESS Open Access
Atomic Force Microscopy Study of Protein–
Protein Interactions in the Cytochrome CYP11A1
(P450scc)-Containing Steroid Hydroxylase System
YD Ivanov
1*
, PA Frantsuzov
1
, A Zöllner
2
, NV Medvedeva
1
, AI Archakov
1
, W Reinle
2
, R Bernhardt
2
Abstract
Atomic force microscopy (AFM) and photon correlation spectroscopy (PCS) were used for monitoring of the
procedure for cytochrome CYP11A1 monomerization in solution without phospholipids. It was shown that the
incubation of 100 μM CYP11A1 with 12% Emulgen 913 in 50 mM KP, pH 7.4, for 10 min at T = 22°C leads to
dissociation of hemoprotein aggregates to monomers with the monomerization degree of (82 ± 4)%. Following the
monomerization procedure, CYP11A1 remained functionally active. AFM was employed to detect and visualize the
isolated proteins as well as complexes formed between the components of the cytochrome CYP11A1-dependent
steroid hydroxylase system. Both Ad and AdR were present in solution as monomers. The typical heights of the
monomeric AdR, Ad and CYP11A1 images were measured by AFM and were found to correspond to the sizes 1.6 ±
0.2 nm, 1.0 ± 0.2 nm and 1.8 ± 0.2 nm, respectively. The binary Ad/AdR and AdR/CYP11A1
mon
complexes with the
heights 2.2 ± 0.2 nm and 2.8 ± 0.2 nm, respectively, were registered by use of AFM. The Ad/CYP11A1
mon
complex
formation reaction was kinetically characterized based on optical biosensor data. In addition, the ternary AdR/Ad/
CYP11A1 complexes with a typical height of 4 ± 1 nm were AFM registered.
Introduction
Hemeproteins belonging to cytochrome P450 superfam-
ily play an important role in metab olism of a broad
spectrum of endogenous and exogenous chemicals [1].
CYP11A1-dependent monooxygenase system is respon-
sible for choleste rol conversion to pregnenolone [2,3].
The electron transfer chain of this system includes adre-
nodoxin reductase (AdR), adrenodoxin (Ad) and
CYP11A1. AdR transfers electrons from NADPH to
CYP11A1 via Ad [4]. CYP11A1-dependent monooxy-
genase system is unique in its organization. This is a
mixed-type system since electron transfer components
Ad and AdR are water-soluble proteins, while CYP11A1
is a membrane-bound hemeprotein [5]. To gain a better
insight into the intrinsi c mechanism of electron transfer
in this system, it is necessary to have information on the
stru cture and properties of individual proteins and their
complexes. At present, the crystal structure of Ad is
alreadysolved[6],andthesizeoftheferredoxin
molecule is determined (3.8 × 3.4 × 4.4 nm). The crystal
structure of AdR has also been solved, its size being
equal to 5.8 × 5.4 × 4.0 nm [7]. As is known, the iso-
lated membrane cytochrome CYP11A1 is able to form
oligomers in solution [8]. Therefore, the structure
of CYP11A1 still remains to be clarified. No NMR or
X-ray data for this protein have as yet been obtained.
Only the data on the structure of the cross-linked
AdR/Ad complex has so far b een reported [9]. The
structure of complexes that are formed within CYP11A1
system in native conditions is yet to be clarified. The
size of this complex equals 7.4 × 7.0 × 13.3 nm. It is
known that the components of CYP11A1-dependent
monooxygenase system can form binary complexes, as
has been shown using different approaches: NMR [9],
spectroscopy [10], optical biosensor [10-12], chemical
cross-linking [13,14] and isothermic calorimetry [15].
Moreover, the formation of ternary complexes
between Ad, AdR and CYP11A1 has be en registered in
gel-filtration [16] and optico-biosensoric studies [17].
Atomic force microscopy (AFM) method is finding
increasing application in structural characterization
of protei ns in native conditions . This metho d was
* Correspondence:
1
Institute of Biomedical Chemistry RAMS, Pogodinskaya st. 10, 119121,
Moscow, Russia.
Full list of author information is available at the end of the article
Ivanov et al. Nanoscale Res Lett 2011, 6:54
/>© 2010 Ivanov et al. This is an Open Access article distr ibuted under the ter ms of the Creative Common s Attribution License
( which permits unrestricted use, distribution , and reproduction in any medium, provided
the original work is properly cited.
succ essfully used t o study the water-soluble cytochrome
P450cam system [18]. To simplify the modeling of the
electron transfer chain of the cytochrom e P450cam sys-
tem, it was reconstituted in solution as was reported in
[18]. The AFM investigation of membrane-bound cyto-
chrome P450 systems is complicated by the presence of
phosphol ipid membrane in their constituent proteins. It
is known that membrane proteins are able to form
aggregates upon solubilization. This hampers the analy-
sis of their complexes. The most convenient approach
to overcome this difficulty is based on the modeling of
membrane-bound P450 system in solution containing a
detergent (instead of phospholipid membranes), a s was
proposed for the cytochrome P4502B4 system [ 19]. This
approach was successfully applied to AFM visualization
of binary and ternary complexes of proteins involved in
electron transfer chain within the membrane P450 2B4
system [20,21].
In this paper, a similar approach was developed for
AFM visualization of proteins and their complexes
within the mixed-type CYP11A1 system. For this pur-
pose, CYP11A1 monomerization was carried out in the
presence of Emulgen 913. It was shown that CYP11A1
ispredominantlypresentinamonomericformafter
monomerization procedure. The protein’s monomeriza-
tion degree was controlled via AFM and PCS. The fun c-
tional activity of the monomerized CYP11A1 thus
obtained was demonstrated. Fur thermore, it was shown
that solubilized Ad and AdR are predominantly present
in their monomeric forms as well. The AFM application
allowed to visualize and measure the heights of the indi-
vidual proteins AdR, Ad, CYP11A1 as well as binary
AdR/Ad and AdR/CYP11A1 complexes. Moreover, the
formation of ternary AdR/Ad/CYP11A1 complexes was
registered in CYP11A1 system.
Materials and Me thods
Chemicals
Emulgen 913 was purchased from Kao Atlas (Osaka,
Japan); all other chemicals were from R eakhim
(Moscow, Russia). Ultrapure water was obtained using
the Milli-Q system (Millipore, Bedford, USA).
Protein Expression and Purification
Bacteria were grown as previously reported [22] with
slight mod ifications. Briefly, we used freshly transformed
E. coli BL21DE3 to inoculate a preculture. The bacteria
were allowed to grow in ampicillin-containing nutrient
broth medium at 37°C overnight. These cultures were
used to inoculate 4 l of a main culture containing ampi-
cillin. Isopropyl-1-thio-D-galactopyranoside was added
to induce heterologous protein production, and after-
ward cultures were grown at 37°C for 16 h. Recombi-
nant Ad was purified after sonification as described, and
the final concentration of Ad was determined using
ε 414 = 9.8 mM
-1
cm
-1
[23]. The purity of the Ad pre-
paration was estimated by determining the relative
absorbance of the protein at 414 and 273 nm, i.e. its Q
value (A414/A273). AdR was heterologously expressed
and purified as described elsewhere [24]. The molar
extinction coefficient used for estimation of AdR con-
centration was ε 450 = 10.9 mM
-1
cm
-1
[25]. Isolation
of CYP11A1 from bovine adrenal glands was performed
as previously described [26 ]. CYP11A1 concentration
was estimated by carbon monoxide difference spectra
using ε (450–490) = 91 (mM cm)
-1
.
Procedure for CYP11A1 Monomerization
For monomerization of cytochrome CYP11A1, the
detergent Emulgen 913 in the concentration range
4–12% was chosen. The monomerization scheme was as
follows: to 2 μl of stock solution of CYP11A1 (100 μM)
in 50 mM KP, pH 7.4, were added 1.3 μlofEmulgen
913 at three various concentrations (10%, or 20%, or
30% solution) at T = 22°C. The final concentrations of
Emulgen 913 in the three incubation solutions were 4, 8
and 12%, respectively. The mixture obtained was incu-
bated at room temperature (22°C) for 10 min.
AFM Experiments and Samples’ Preparation
AFM experiments were carried out using the direct sur-
face adsorption method [27]. As support, the mica was
used.
For visualization of individual non-monomerized and
monomerized CYP11A1 protein molecules, the appro-
priate protein solution was diluted in 50 mM K-
phosphate buffer, pH 7.4 (50 KP) to obtain 1 μM
protein concentration; 5 μl of obtained s olution were
immediately deposited onto the freshly cleaved mica
surface and left for 3 min. For visualization of the indi-
vidual Ad and AdR protein molecules, 5 μlof1.0μM
solution of an appropriate protein in 50 mM K-phos-
phate buffer, pH 7.4, were deposited onto the freshly
cleaved mica surface and left for 3 min. A fter that, each
sample was first rinsed with the same buffer, then with
ultrapure distilled water and dried in airflow. The binary
complexes were obtained by mixing 10 μlof5μM solu-
tions of appropriate individual proteins in 50 KP, pH
7.4. Then, the mixture was incubated for 10 min, diluted
2.5 times in the same buffer, and a 5-μl portion of the
mixture was immediately placed onto mica. The ternary
complexes were obtained by mixing 10 μlof7.5μM
solutions of appropriate individual proteins in 50 KP,
pH 7.4. Then the mixture was incubated for 10 min,
diluted 2.5 times in the same buffer, and a 5- μlportion
of the mixture was immediately placed onto mica. As
was shown in an earlier researc h [28], with relative
humidity exceeding 45%, the mica surface is covered
Ivanov et al. Nanoscale Res Lett 2011, 6:54
/>Page 2 of 13
with a w ater layer. Therefore, in the present study all
the measurements were carried out at room temperature
andat60– 70% air humidity, t he protein molecules
under study remained hydrated throughout. The choice
of protein concentration was dictated by inherent limita-
tions of the AFM technique: at higher concentrations,
the molecules under observation formed layers on the
mica support, which excluded the identification of indi-
vidual objects.
All AFM experiments were carried out in a tapping
mode o n a multimode “NTEGRA” atomic force micro-
scope (NT-MDT, Moscow, Russia) in air. Cantilevers
NSG 10 produced by “NT-MDT” (Russia) were used.
The resonant frequency of the cantilevers was 190–
325 kHz, and the force constant was about 5.5–22.5
N/m.Thecalibrationofthemicroscopebyheightwas
carried out on a TGZ1 cal ibration grating (NT-MDT,
Mos cow, Russia) with the step height 22 ± 0.5 nm. The
supershar p probes with the radius of curvature of about
1–3nmwereusedformeasuringofCYP11A1mono-
mers’ volumes. As supersharp probes, NSG01_DLC
microprobes (NT-MDT, Russia) with a t ypical resonant
frequency of 115–190 kHz were used.
The t otal number of measured particles i n each sam-
ple was not less than 600, and the number of measure-
ments for each sample was no less than 16, i.e. there
were 4 measurements in each of the four series.
Analysis of AFM Images
The density of protein distribution with height, r(h),
was calculated as r(h)=(N
h
/N) × 100%, where N
h
is
the number of imaged proteins with height h,andN is
the total number of imaged proteins. The calculation
was carried out using a step of 0.2 nm.
To calculate the deaggregation degree, the dependence
of distribution density r(h)ofCYP11A1imageswith
height (h) was constructed:
hNN
h
()
=
()
×/%.100
(1)
The dependence of this distribution was approximated
using root-mean square method by the sum of two
curves:
() () ()
() ()
hhh
K
hm
b
hm
b
i
i
i
i
i
i
=+
=×
−
×
−−
⎡
⎣
⎢
⎢
⎤
⎦
⎥
⎥
=
12
2
2
2
2
1
2
2
EXP
∑∑
(2)
where K
i
, m
i
, b
i
are the parameters of r(h
i
) distribu-
tion. The maximum of r
i
(h) was calculated from Eq. (2).
For the analysis of distribution with heights and
volumes (r(h,V)) of imaged CYP11A1, (r(h, V)) was cal-
culated as
hV N N
hV
,/%,
,
()
=
()
×100
(3)
where N
h,V
is the number of imaged proteins with the
height h, and the volume V.
Values of height maximums and distributions widths,
represented in text, were calculated from Eq. 2.
PCS Measurements
Photon correlation spect roscopy (PCS) measurements
were carried out by use of N5 Submicron Particle Size
Analyzer (Beckman Coulter, Inc). The principle of regis-
tration is based on measuring the interference pattern of
light scattered on particles in solution by use of photon
correlation spectroscopy (PCS ). Measurements were
made at the l ight-scattering a ngle of 90°. Protein
solution (the stock one or the one subjected to mono-
merization procedure) was diluted in 50 mM KP, pH =
7.4, and placed into the measuring cuvette of Analyzer.
Protein concentration was so selected as to make the
intensity of dissipated light at 90° not lower than the
sensitivity threshold corresponding to 5 × 10
4
counts.
CYP11A1 and AdR concentrations were 5 μM for each
protein. For Ad, the concentra tion was 0.2 mM. The
measurements were made up to the accumulation of the
signal during 200 s.
The calibration of the corre lometer was performed
using the set of latexes with the diameters 40, 50, 150
and 500 nm and the cytochrome C (2.9 × 5.5 × 2.3 nm)
with the known X-ray structure from PDB [29]. In this
size range, the measured sizes of latex corresponded t o
nominal with a root-mean square deviation of 10%.
Optical Biosensor Measurements
Formation of the complex between monomeric
CYP11A1 and Ad was additi onally assa yed on a Biacore
3000 system, using the optical biosensor method as
described before with slight modifications [30,31].
Briefly, after activat ion of the CM5 chip with N-ethyl-
N’ -dimethylaminopropyl-carbodiimide (EDC) and
N-hydroxysuccinimide (NHS), 75 μL of a 200 μMAd
solution was injected with a flow of 5 μlmin
-1
at 20°C.
The immobilization procedure was completed by inject-
ing 1 M ethanolamine hydrochloride in order to block
the remaining ester groups. Approximately 400 RU
(response units) Ad was immobilized on the dextran
matrix. In order to match the experimental conditions
employed for the AFM measurements, we used a
50 mM potassium phosphate buffer (pH 7.4) containing
1% Emulgen 913. Binding of monomeric or oligomeric
CYP11A1 to immobi lized Ad was analyzed by injecting
CYP11A1 solutions with concentrations varying between
1 and 100 nM. Each concentration was injected at least
three t imes. To visualize unspecific background
Ivanov et al. Nanoscale Res Lett 2011, 6:54
/>Page 3 of 13
interactions betwee n the dextran matrix and CYP11A1,
a reference cell (i.e. the cell without Ad) was created.
Ten microliters of 1 mM NaOH was used as regenera-
tion solution . K
D
values were determined using the soft-
ware Biaeval 4.1. Averagedbindingcurvesforthe
interaction between Ad and varying CYP11A1 concen-
trations were fitted simultaneously using the 1:1
Langmuir-binding model. K
D
values were determined
from the fit with the lowest standard deviation.
Control of Functionality of Monomeric CYP11A1
These assays were aimed toward demonstrating the func-
tionality of mono meric CYP11A1. For this p urpose, we
investigated the conversion of 7-dehydrocholesterol to
7-dehydropregnenolone c ortisol [32] using monomeric
CYP11A1. In vitro reconstitution assays were performed
as described before [33] with slight modifications. Briefly,
the reaction mixture (0.5 ml) consisted of either
CYP11A1 (0.4 μM) that has been monomerized using
Emulgen 913 as described earlier or oligomeric CYP11A1
(0.4 μM), AdR (0.5 μM),Ad(0to4μM), 7-dehydrocho-
lesterol (400 μM) and MgCl
2
(1 mM) in 50 mM potas-
sium phosphate buffer (pH 7. 4) containi ng 0.05% (v/v)
Tween 20.
Substrate conversion was started by the addition of
NADPH up to the final concentration of 100 μM. In
addition to this, glucose-6-phosphate (5 μM) and glu-
cose-6-phosphate dehydrogenase (1 U) w ere added to
the reaction mixture. After the reaction was completed,
steroids were extracted with chloroform and then sepa-
rated on a Jasco reversed-phase HPLC system of the
LC900 series using a 3.9 × 150 mm Waters Nova-Pak
C18 column at 40°C. The mobile phase used for the
separation was a mixture of acetonitrile/2-propanol
(30:1). Product quantification was performed by corre-
lating the product peak integrals with the pe ak area of a
known internal standard (5 nmol cortisol) that was
added prior to the chloroform extraction. K
m
and V
max
values were determ ined by plo tting the substrate con-
version v elocity versus Ad concentration and applying
the Michaelis–Menten kinetics (hyperbolic fit) using the
program SigmaPlot 2001. Each experiment was per-
formedfourtimes.ThevelocityoftheAd-dependent
product formation was expressed in nmol product ×
min
-1
× nmol CYP11A1
-1
.
Analytical Methods
Proteins were analyzed via SDS gel electrophoresis in
order to detect major impurities in protein preparations.
The results obtained from these measurements revealed
no impurities in the purified protein samples of all three
components of the CYP11A1 electron transfer chain
(data not shown).
In order to che ck possible structural changes in the
protein conformations of the monomerized and oligo-
meric proteins, UV/VIS and CD spectroscopy have bee n
performed.
Absorption spectra in the UV/VIS region (250–700 nm)
were recorded at room temperature on a double-beam
spectrophotometer UV2101PC (Shimadzu; Kyoto, Japan).
UV/VIS spectra of monomeric or oligomer ic proteins
revealed no significant changes (data not shown). UV/VIS
spectra of CYP11A1 displayed a pronounced peak at
392 nm, indicating that the protein is in its high spin con-
formation. Carbon monoxide difference spectroscopy per-
formed for CYP11A1 displayed a pronounced peak at
450 nm, whereas the peak at 420 nm (non-functional pro-
tein) was not observable.
CD spectra of oxidized monomeric and oligomeric
CYP 1 1A1 were recorded on a Jasco 715 spectropolari-
meter as described before [34]. All protein samples were
diluted in 10 mM KP (pH 7.4). Possible changes in the
secondary structures of the proteins were investigated
by recording CD spectra in the range of 195–260 nm.
CD measurements in t he 250–650 nm range wer e per-
formed using 10 μM proteins as described recently [35].
The results obtained from these measurements revealed
no significant conformational changes (data not shown)
between the monomeric and oligomeric protein species.
Results
PCS Study of AdR, Ad and CYP11A1
The aggregation states of AdR, Ad and CYP11A1 were
tested by PCS. Data on photon correlation spectroscopy
of AdR (5 μM) showed that the hydrodynamic diameter
of AdR is D = (6 ± 2) nm, its content (b) constituting
about 95 ± 5%. This value is similar to the appropriate
value for AdR monomer from X-ray data (5.8 × 5.4 ×
4.0 nm) [7].
According to X-ray data, the size of Ad (3.8 × 3.4 ×
4.4 nm) is smaller than that of AdR. Since the intensity
of relay scattering is proportional to D
6
[36], Ad con-
centration must be higher than the AdR one for obtain-
ing the same P CS signal. Therefore, PCS procedure for
Ad was carried out at a higher concentra tion (0.2 mM).
The data obtained in the course of PCS studies show
that the diameter of Ad particles is (5 ± 1) nm, their
content (b) constituting about 100%. This value is simi-
lar to the one obtained for Ad monomer from X-ray
data [37].
The PCS of cytochrome CYP11A1 (5 μM) was per-
formed before and after the monomerization proce dure.
The particles with sizes (16 ± 2) nm were found in the
absence of Emulgen 913 in the incubation mixture, their
content (b) constitut ing 95 ± 5%. With addi tion of
Emulgen 913 at the concentration 4–12%, the particle
Ivanov et al. Nanoscale Res Lett 2011, 6:54
/>Page 4 of 13
size decreases to (7 ± 2) nm. This was taken to mean
that incubation in Emul gen solution leads to deaggrega-
tion of cytochrome CYP11A1. At the same time, the
PCS analysis did not reveal the dependence of CYP11A1
deaggregation on Emulgen concentration i n the 4–12%
concentration range. Therefore, it is impossible to estab-
lish whether the CYP11A1 deaggregation is deep
enough, i.e. w hether it is able to produce monomers,
dimers or trimers: apparently, the sensi tivity of the
device is not sufficient to ascertain that deaggregation
did occur in the mixture of these species . In ord er to
obtain more exact information about CYP11A1 aggrega-
tion, another, more sensitive technique should be used.
As is known, the sensitivity of AFM molecular detector
is very high—at a single molecular level. Earlier, we have
shown that the AFM detector is able to distinguish bin-
ary c omplexes from monomers and ternary complexes
from dimers and mo nomers [18,20,21]. In this study,
the AFM detector was used to control the monomeriza-
tion procedure of CYP11A1 as well as to visualize and
measure the sizes of single protein molecules and their
complexes within CYP11A1 system.
AFM Visualization of the Individual Molecules of AdR, Ad
and CYP11A1
By using the AFM method, one can obtain objective
information about molecule height, while its lateral
size may be broadened due to the limited size of the
microscope’s probe [20,38]. Therefore, in this study,
the protein height was taken to be the only criterion
for estimation of its size. As has been shown in
[18,20,21], AFM allows distinguishing monomers from
protein complexes based on the height of AFM-
visualized objects. Therefore, in a series of AFM
experiments, the heights of imaged proteins were mea-
sured, and the distribution of protein images with
height was built.
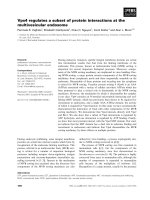
AFM of Non-Monomerized and Monomerized CYP11A1
AFM was used for visualization of non-monomerized
and monomerized CYP11A1. The distribution densities
r(h) of CYP11A1 images at 0, 4, 8 and 12% Emulgen
913 were obtained. The AFM images of oligomeric
CYP11A1, which was not subjected to monomerization
procedure (0% Emulgen 913), are presented in
Figure 1a. Distribution of visualized species with height
r(h) for each type of CYP11A1 was built (Figure 1c).
This distribution is characterized by the position of the
maximum near 2.4 nm and a broad width of the peak at
the half-height (about 2 nm). The distribution was well
approximated by the sum of two curves: r
1
(h)andr
2
(h)
according to Eq. (2). Presented in Table 1 are the
heights for which the maxima of appropriate distribu-
tions are observed at (h
max
)
1
= 2.4 ± 0.3 nm and (h
max
)
2
= 3.8 ± 0.4 nm.
The AFM images of CYP11A1, subjected to mono-
merization procedure (12% Emulgen 913), are displayed
in Figure 1b. Upon incubation of CYP11A1 in 4–12%
Emulgen 913, the height maximum of AFM images was
found to be decreased to h
max
=1.6nm(Figure1c).
This was taken to mean that the incubation of
CYP11A1 in 4–12% Emulgen 913 leads to deaggregation
of this protein. Approximation of the distribution r(h)
may be represented as the sum of two distributions:
r
1
(h) with (h
max
)
1
= 1.6 ± 0.2 nm and r
2
(h) with (h
max
)
2
=2.6–2.8 nm, calculated from Eq. (2) (Table 1). For
each image of CYP11A1, incubated in 4, 8 and 12%
Emulgen 913 solutions, r
1
(h) has the maximum (h
max
)
1
= 1.6 ± 0.2 nm. Based on the fact that the monomers of
P450 2B4 have the size 2.2 ± 0.2 nm [21] while Mr
(P450 2B4) ≈ Mr (CYP11A1), it may be suggeste d that
CYP11A1 images with the r
1
( h) maximum at h
max1
=
1.6 ± 0.2 nm correspond to the mono mers of CYP11A1.
The AFM images of CYP11A1 monomers are repre-
sented in Figure 1b. The r
2
(h)curvewiththe(h
max
)
2
~
2.6–2.8 nm corresponding to aggregates is consistent
with the distribution of heights of oligomers with a vary-
ing degree of CYP11A1 aggregation. The deaggregation
degree a = r
1
(h)/{(r
1
(h)+r
2
(h)} may be used for esti-
mation of the share of dea ggregated CYP11A1. With
increasing Emulgen 913 concentration from 4 to 12%,
the share of monomers was increased from 45 ± 4% to
82 ± 4% (Table 1).
Supersharp AFM analysis was used for additional con-
firmation of CYP11A1 monomeriza tion by measuri ng of
volumes of monomerized CYP11A1. The standard
probe tip (R ~10–20 nm) broadening effect leads to
substantial overestimation of measured protein’s volume.
At the same time, application of supersharp AFM
probes allows to measure protein volume more
correctly.
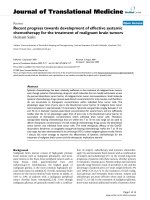
Presented in Figure 2a are the images of adsorbed-on-
mica monomerized CYP11A1 obtained by AFM with
supersharp probes (R = 2 nm). Distribution of images
with heights and volumes r(h, V) calculated from Eq.
(3) is presented in Figure 2c. Objects, corresponding to
this distribution, may be conventionally divided into 2
groups: (1) objects with volumes in the i nterval 15–45
nm
3
,withV
max
=15±4nm
3
, cor responding to h
max
=
1.2 nm—distribution maximum of objects with heights
in the interval h =1.0–2.0 nm; (2) objects with volumes
in the interval 55–155 nm
3
,withV
max
=55±10nm
3
,
with heights in the interva l h =1.0–2.0 nm, h
max
=
1.4 ± 0.1 nm.
Comparison of volumes V
max
of AFM-imaged objects
in group (1) with the volumes of truncated P4502B4
monomers (~30 nm
3
)fromX-raydata[39]showsthat
objects with minimal sizes, i.e. those residing in group
(1), correspond to CYP11A1 monomers accounting for
Ivanov et al. Nanoscale Res Lett 2011, 6:54
/>Page 5 of 13
70% ± 10% of the total number of objects. Lateral sizes
of imaged CYP11A1 monomers were in the order of
8–12 nm, with the most probable value ~10 nm.
Objects in group 2 with the volume V
max
being twice
larger and more than that of monomers apparently cor-
respond to imaged dimers a nd oligomers of higher
order accounting for 30 ± 10%.
The height of group (1)-imaged objects corresponding
to monomers has the value of h
max
=1.2±0.1nm,
which is essentially (twice) less than the height of
P4502B4 from X-ray data (2.5 nm).
TheloweredvalueofCYP11A1heightmaybesug-
gested to be due to the motility of the CYP11A1 mole-
cule under the supersharp probe force or to the
spreading of CYP11A1 molecules or else to their shrink-
age by AFM probe or some other yet unknown causes.
Thus, AFM with supersharp prob es also showed that
CYP11A1 becomes monomeric upon monomerization
procedure.
Naturally, the question arises as to whether the activ-
ityofCYP11A1wasretainedafter monomerization. In
order to examine the functionality of CYP11A1 after
monomerization with Emulgen 913, we performed in
vitro CYP11A1 substrate conversion assays according to
«Materials and Methods» (the “Control of functionality
of monomeric CYP11A1” subheading). The results of
these experiments have shown that the monomeric cyto-
chrome is capabl e of conver ting 7-dehydrocholesterol to
Table 1 The AFM heights (h
max
) of distribution maximum
of CYP11A1 images and the deaggregation degree (a)
upon Emulgen 913 monomerization
Emulgen 913
concentration, %
h
max1
,nm h
max2
,nm %of
monomers, a
CYP11A1
0 2.4 ± 0.3 3.8 ± 0.4 0
4 1.6 ± 0.2 2.8 ± 0.2 45 ± 4
8 1.6 ± 0.2 2.8 ± 0.2 70 ± 4
12 1.6 ± 0.2 2.6 ± 0.2 82 ± 4
a = N/N
tot
is the AFM-measured deaggregation degree, where N is the
number of molecules with the 1.6 ± 0.2 nm diameter; N
tot
is the total number
of molecules
Figure 1 AFM images of non- monomerized (a) a nd (12% Emu lgen 913)-monomerized (b) CYP11A1 molecules and density of
distribution (r(h)) with height of non-monomerized and monomerized CYP11A1 (c). Tapping mode. Experimental conditions were as
follows: 100 μM CYP11A1 non-monomerized and 100 μM CYP11A1 monomerized in 50 mM KP, pH 7.4, containing Emulgen 913 (12%). For AFM
visualization, the samples were diluted to obtain 1 μM CYP11A1 in 50 mM KP with 0.5% Emulgen 913, pH 7.4, and immediately placed onto the
mica surface. T = 25°C. Arrows (1) indicate the images of CYP11A1 aggregates, arrows (2) indicate the images of CYP11A1 monomers.
Ivanov et al. Nanoscale Res Lett 2011, 6:54
/>Page 6 of 13
7-dehydropregnenolone with V
max
=0.48±0.02nmol/
min/nmol CYP11A1 and K
M
= 0.32 ± 0.06 M. The V
max
values and the Ad-dependent K
M
values determined
using monomeric CYP11A1 did not reveal any signifi-
cant differ ences compared to the oligomeric enzyme for
which t hese values were as follows: V
max
=0.51±0.04
nmol/min/nmol CYP11A1 and K
M
=0.47±0.15M.
Thus, the activity assays clearly demonstrate that the
monomerization procedure does not significantly alter
the functionality of CYP11A1.
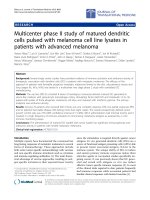
AFM of AdR and Ad
Visualization of the AdR and Ad molecules was carried
out as described in «Materia ls and Methods». AFM
images of Ad and AdR on the mica surface were
obtained (Figure 3a and 3c, respectively), and heights of
the detected species were measured; also, the distribu-
tion of the number of visualized species with height r(h)
for each type of measurements was built (Figure 3b, and
3d, respectively). The analysis of distributions for Ad
(Mr = 13 kDa) shows that the majority of molecules
(about 90%) have the height of about 0.8– 1.8 nm
(Figure 2b), with the r(h)
Ad
maximum at h
max
=1.0±
0.2 nm < calculated from Eq. 2. Bearing in mind that
the Mr
Ad
(13 kDa) < Mr
AdR
(50 kDa), it was inferred
that the objects with the r(h) maximum at h
max
=1.0±
0.2 nm (Figure 3b) are Ad monomers. The analysis of
distributions for AdR shows that the majority (about
90%) of molecules have the height of about 1.4–2.2 nm
(Figure 3d), with the height max imum (h
max
) that corre-
sponds to r(h)
AdR
maximum at 1.8 ± 0.2 nm. Given that
the AFM image of CYP11A1 monomer has the h
max
=
1.6 ± 0.2 and the masses of AdR monomer (Mr =
50 kDa) and CYP11A1 monomer (Mr = 58 kDa) are
similar, it may be suggested that the objects with the
h
max
= 1.8 ± 0.2 nm corresponds to AdR monomers.
Thus, AdR species occurs predominantly in a mono-
meric form. The fact that the height of AdR is 2 times
less than the one obtai ned from X-ray studies (4 nm) is
probably e xplained by the molecule’s distortion due to
the probe force [18,40].
Figure 2 a AFM image of monomerized CYP11A1 obtained using ultrasharp AFM probe; b cross-section, shown in (a); c density of
distribution with height and volume of imaged CYP11A1. Experimental conditions were as follows: 100 μM CYP11A1 monomerized in 50
mM KP, pH 7.4, containing Emulgen 913 (12%). For AFM visualization, the samples were diluted to obtain 1 μM CYP11A1 in 50 mM KP with 0.5%
Emulgen 913, pH 7.4, and immediately placed onto the mica surface. T = 25°C. Tapping mode. AFM cantilevers were NSG01_DLC (NT-MDT,
Russia).
Ivanov et al. Nanoscale Res Lett 2011, 6:54
/>Page 7 of 13
AFM Investigation of Interactions Between Proteins
Within CYP11A1 System
Ad/CYP11A1 Interaction
The series of AFM experiments were carried out to
investigate the interaction between Ad and CYP11A1.
The images and the r(h) distribution for the imaged
objects in the (CYP11A1
mon
+ Ad) mixture are pre-
sented in Figure 4a, b. Comparison of the (CYP11A1 +
Ad) mixture distribution vs. Ad and CYP11A1 mono-
mers’ distributions (r(h)
Ad
and r(h)
CYP11A1
) is presented
in Figure 4c. The differential distribution (Δr) between
r(H)
CYP11A1mon+Ad
distribution and r(h) distributions of
individual CYP11A1
mon
and A d was cal culated and
representedinFigure4d.OnecanseefromFigure4d
that h
max
for objects in the mixture is equal to that of
CYP11A1 monomers. So this indicates the absence of
other objects with different h
max
in the mixture. Since
the criterion chosen for distinguishing complex from
monomer i s based on comparison of distribution maxi-
mums, it may be concluded that in AFM experiments
little or no Ad/CYP11A1
mon
complex formation took
place. Virtual lack of Ad/CYP11A1
mon
complexation is
possibly due to weak adhesion of Ad/CYP11A1
mon
com-
plexes to the AFM support—whichinturnmaybe
explained by blockage of adhesion sites of isolated Ad
and CYP11A1
mon
upon their complex formation.
At the same time, we have made an attempt to reveal
the Ad/CYP11A1
mon
complex formation by th e plasmon
resona nce method. The BIAco re ex periments enabled to
register compl ex formation betwe en CYP11A1 and Ad in
the same conditions in which AFM experiments were
conducted (see «Materials and methods» section). Based
on the results of these experiments, the k
on
, k
off
and K
D
values for the Ad/CYP11A1
mon
complex formation reac-
tion were estimated as (290 ± 30) × 10
3
M
-1
s
-1
,0.05±
0.005 s
-1
and 0.17 ± 0.015 μM, respectively (see Table 2).
For the oligomeric enzyme, these values were as follows:
k
on
=(420±40)×10
3
M
-1
s
-1
, k
off
= 0.09 ± 0.009 s
-1
and
K
D
= 0.21 ± 0.02 μM (see Table 2). As seen from Table 2,
there are no significant differences in the binding kinetics
of the monomeric and oligomeric CYP11A1 with Ad: the
K
D
values varied by less than half.
Figure 3 AFM image (a) and density of distribution with height (b) of Ad; AFM image (c) and density of distribution with height (d) of
AdR. Tapping mode. Experimental conditions were as follows: 5 μlof1μM Ad and 1 μM AdR in 50 mM KP, pH 7.4 were deposited onto the
freshly cleaved mica surface, T = 25°C.
Ivanov et al. Nanoscale Res Lett 2011, 6:54
/>Page 8 of 13
Summarizing these results and the results on
CYP11A1
mon
activity determination (see part 2.1), it
may be concluded that monomerized CYP11A1 can
form complexes with Ad, at the same time CYP11A1
functionality was not affected by our monomerization
procedure.
AdR/Ad Interaction
Binary AdR/Ad complexes were formed as described in
«Materials and Methods». The images and the r(h)dis-
tribution for the imaged objects in the (AdR + Ad) mix-
ture are presented in Figure 5a, b. Comparison of the
(AdR + Ad) mixture distribution vs. the AdR and Ad
monomers’ distributions (r(h)
AdR
and r(h)
Ad
)ispre-
sented in Figure 5c. The differential distribution (Δr)
between r(h)
AdR+Ad
distribution and distributions of
individual AdR and Ad was calculated and represented
in Figure 5d.
This Δr =(r(h)
AdR+Ad
-[r(h)
AdR
+ r(h)
Ad
]) is charac-
terizedwiththenewheightmaximumath
max
=2.3±
0.2 nm in its positive wing (see Figure 5d). This h
max
is
higher than the h
max
=1.8nm(AdR)ortheh
max
=1.0
nm (Ad). Therefore, in c ontrast to the case with the
(CYP11A1mon+Ad)mixture,theAFMheightdistribu-
tion for the (AdR + Ad) mixt ure is characterized by the
appearance of some objects with heights in a range 1.8–
2.6 nm and with higher h
max
than the ones of individual
AdR and Ad. In the binary mixture, the share of these
objects in the positive wing of the Δr =(r(h)
AdR+Ad
-
[r(h)
AdR
+ r(h)
Ad
]) distribution with the height 1.8–2.6
nm reached (51 ± 8)%. Appearance of the positive wing
allows us to conclude that the increase in the number of
objects with the height 1.8–2.6 nm and the hmax at 2.3 ±
0.2 nm up has been due to formation in the (AdR + Ad)
mixture of binary AdR/Ad complexes (Table 3).
Figure 4 AFM images of the objects (a) and the corresponding density of distribution with height (r(h)
Ad + CYP11A1
) for Ad + CYP11A1
mixture (b); comparison of r(h)Ad + CYP11A1 vs. normalized distribution densities of individual Ad and CYP11A1 monomers
(summarized area under r(h)Ad and r(h)CYP11A1 curves is reduced to 100%) (c); differential curve (Δr) between r(h)Ad + CYP11A1
and the sum of normalized distribution densities of individual Ad and CYP11A1 (d). Tapping mode. Experimental conditions were as
follows: the mixture of 5 μM solutions (10 μl each) of appropriate individual proteins (monomeric CYP11A1, containing 1% Emulgen 913, and
Ad) in 50 mM KP, pH 7.4, was incubated for 10 min, diluted 2.5 times with the same buffer, and a 5-μl portion of the mixture was immediately
placed onto mica, T = 25°C.
Table 2 The values of k
on,
k
off
and K
D
for the Ad/
CYP11A1 monomeric and the Ad/CYP11A1 oligomeric
complex formation reaction
k
on
×10
3
[M
-1
s
-1
] k
off
[s
-1
] K
D
[μM]
Monomeric CYP11A1 290 ± 30 0.05 ± 0.005 0.17 ± 0.015
Oligomeric CYP11A1 420 ± 40 0.09 ± 0.009 0.21 ± 0.02
Optico-biosensoric experiments were performed using a Biacore 3000 device.
Approximately 400 RU of Ad were covalently immobilized on a
carboxymethylated dextran matrix. Subsequently, different concentrations of
CYP11A1 were passed over the flow cell. K
D
values were determined using the
1:1 binding mechanism available in the Biacore evaluation software 4.1
Ivanov et al. Nanoscale Res Lett 2011, 6:54
/>Page 9 of 13
AdR/CYP11A1 Interaction
The similar situation to the above-described one was
met for imaged objects in the (AdR + CYP11A1
mon
)
mixture (Figure 6). The r(h) of imaged objects is repre-
sented in Figure 6b. Comparison of distribution for the
(AdR + CYP11A1
mon
) mixture vs. the distributions of
individual AdR and CYP11A1
mon
is shown in Figure 6c.
As in the case with the (AdR +Ad) mixture, the differ-
ential curve of distributions Δr =(r(h)
AdR+CYP11A1
-
[r(h)
AdR
+ r(h)
CYP11A1
]) presented in this study is char-
acterized by the appearance of the positive wing of dis-
tribution of objects with heights 2.2–5.0 nm and h
max
=
2.8 ± 0.2 nm (see Figure 6d). This h
max
is higher than
the h
max
= 1.6 nm (CYP 11A1
mon
)ortheh
max
=1.8nm
(AdR).Inthebinarymixture,theshareofthesenew
objects in the positive wing of the differential spectrum
Δr =(r(h)
AdR+CYP11A1
-[r(h)
AdR
+ r(h )
CYP11A1
]) with
heights 2.2–5.0 nm reached (35 ± 7)%. Based on these
data, it was concluded that t he increase in the number
of objects with heights 2.2–5.0 nm and the h
max
= 2.8. ±
0.2 nm up has been due to the formation in the (AdR +
CYP11A1
mon
) mixture of binary AdR/CYP11A1 com-
plexes (Table 3).
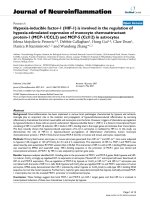
AdR/Ad/CYP11A1 Interaction
While in our earlier optico-biosensoric studies the for-
mation of ternary CYP11A1
nonmonome rized
/Ad/AdR com-
plexes was merely registered [10], in the present
research the AFM visualization of the (CYP11A1
mon
+
Ad + AdR) mixture was accomplished (see Figure 7);
the r(h) distribution obtained upon a nalysis of imaged
objects ( Figure 7b) was compared with the three distri-
butions for the binary mixtures: r(h)
CYP11A1+Ad
, r(h)
Ad
Figure 5 AFM images (a) and the corresponding density of distribution with height (r(h)) for AdR/Ad complexes (b); comparison of
r(h)
AdR/Ad
vs. normalized distribution densities of individual AdR and Ad (the summarized area under r(h)
AdR
and r(h)
Ad
curves is
reduced to 100%) (c); and the sum of normalized distribution densities of individual AdR and Ad (d). Tapping mode. Experimental
conditions were as follows: the mixture of 5 μM solutions (10 μl each) of appropriate individual proteins (AdR and Ad) in the 50 mM KP, pH 7.4,
was incubated for 10 min, diluted 2.5 times with the same buffer, and a 5-μl portion of the mixture was immediately placed onto mica, T = 25°
C. Arrows (1) indicate the images of AdR and Ad monomers. Arrows (2) indicate the AdR/Ad images.
Table 3 AFM-measured heights of protein and protein
complexes heights in CYP11A1 system
Name of protein or complex AFM-measured object
heights, nm
CYP11A1 monomer
(M
r
= 56 kDa)
1.4–2.8 with h
max
= 1.6 ± 0.2
AdR monomer (M
r
= 60 kDa) 1.4–2.2 with h
max
= 1.8 ± 0.2
Ad monomer (M
r
= 16 kDa) 0.8–1.8 with h
max
= 1.0 ± 0.2
Ad + CYP11A1 1.3–2.6 with h
max
= 1.6 ± 0.2
AdR/Ad 1.8–2.6 with h
max
= 2.3 ± 0.2
AdR/CYP11A1 2.2–5.0 with h
max
= 2.8 ± 0.2
AdR/Ad/CYP11A1 2.8–5.5 with h
max
= 4.0 ± 1.0
Ivanov et al. Nanoscale Res Lett 2011, 6:54
/>Page 10 of 13
+AdR
and r(h)
AdR+CYP11A1
. This comparison of the distri-
bution of the r(h)
CYP11A1+Ad+AdR
for the (AdR + Ad +
CYP11A1
mon
)mixturevs.r(h)
CYP11A1+Ad
, r(h)
Ad+AdR
and r(h)
AdR+CYP11A1
isshowninFigure7candthedif-
ferential curve Δr =[r(h)
CYP11A1+Ad+AdR
-
i=
∑
1
3
r
i
(h)
BINARY MIXTURE
] is represented in Figure 7d. This distri-
bution is characterized by the ap pearance of the positive
wing of differential distribution Δr of objects with
heights 2.8–5.5 nm and a broad maximum at the h
max
=
4.0 ± 1.0 nm in the differential curve Δr =[r(h)
CYP11A1
+Ad+AdR
-
i=
∑
1
3
r
i
(h)
BINARY MIXTURE
]. The share of
these objects in the 3-component mixture was (12 ± 4)
%. Based on these data, it was infe rred that the majority
of objects wi th maximum at h
max
= 4.0 ± 1.0 nm are, in
fact, the ternary d-CYP11A1/Ad/AdR complexes (Table
3). It is to be noted that formation of ternary d-
CYP11A1/Ad/AdR complexes (as well as formation of
binary AdR/Ad and AdR/CYP11A1 complexes) was
demonstrated in our earlier optico-bio sensoric studies
[10,11].
Conclusion
Thus, atomic force microscopy (AFM) was used in this
work to detect and visualize the isolated proteins and
protein complexes between the components of the
monomeric CYP11A1-dependent steroid hydroxylase
system. For this purpose, at the first step the procedure
for cytochrome CYP11A1 monomerization in solution
was developed, and the control of the monomerization
degree based on the AFM and PCS methods was estab-
lished. It was shown that the incubation of CYP11A1
with 12% Emulgen leads to the dissociation of aggre-
gates to monomers with the monomerization degree of
(82 ± 4) %. The Ad, AdR and CYP11A1 images were
obtained, an d their heights were measured. It was found
that the AFM is able to identify and visualize not only
the individual membrane-bound proteins but also the
binary Ad/AdR, AdR/CYP11A1 and the ternary Ad/
AdR/CYP11A1 complexes within the CYP11A1-contain-
ing hydroxylase system. In addi tion, it was shown that
the CYP11A1 monomerization procedure d eveloped in
this study did not influence the functionality of the cyto-
chrome. In conclusion, the A FM technique provides a
Figure 6 AFM images (a) and the corresponding density of distribution with height (r(h)) for AdR/CYP11A1 complexes
(b); comparison of r(h)
AdR/CYP11A1
distribution vs. normalized distribution densities of individual AdR and CYP11A1
mon
(the summarized
area under r(h)
CYP11A1
and r(h)
AdR
curves is reduced to 100%) (c); differential curve (Δr) between r(h)
CYP11A1/AdR
for mixture and the
sum of normalized distribution densities of individual CYP11A1
mon
and AdR (d). Tapping mode. Experimental conditions were as follows:
the mixture of 5 μM solutions (10 μl each) of appropriate individual proteins (monomeric CYP11A1, containing 1% Emulgen 913, and AdR) in the
50 mM KP, pH 7.4, was incubated for 10 min, diluted 2.5 times in the same buffer, and a 5-μl portion of the mixture was immediately placed
onto mica, T = 25°C. Arrows (1) indicate the images of AdR and CYP11A1 monomers. Arrows (2) indicate the AdR/CYP11A1 images.
Ivanov et al. Nanoscale Res Lett 2011, 6:54
/>Page 11 of 13
valuable tool for the complex formation studies particu-
larly for the analysis of complexes that involve mem-
brane-bound proteins such as CYP11A1. Moreover,
application of AFM technology opens up possibilities for
the revelation and investigation of other, yet unknown,
protein complexes.
Acknowledgements
This work was supported by the Russian Foundation for Basic Research
(RFBR) # 09-04-12113 OFR_M, FASI contract # 02.552.11.7060, Program
“Proteomics in medicine and biotechnology”.
Author details
1
Institute of Biomedical Chemistry RAMS, Pogodinskaya st. 10, 119121,
Moscow, Russia.
2
Saarland University, Saarbrücken, Germany.
Received: 8 July 2010 Accepted: 15 September 2010
Published: 30 September 2010
References
1. Archakov AI, Bachmanova GP: Cytochrome P450 and Active Oxygen.
Taylor & Francis, London, New-York, Philadelphia; 1990.
2. Shikita M, Hall PF: Proc Natl Acad Sci USA 1974, 71:1441.
3. Shkumatov VM, Usanov SA, Chashchin VL, Akhrem AA: Pharmazie 1985,
40:757.
4. Hara T, Kimura T: J Biochem 1989, 105:594.
5. Bureik M, Bernhardt R: In Modern Biooxidation Edited by: Schmid RD,
Urlacher VB 2007.
6. Pikuleva IA, Tesh K, Waterman MR, Kim Y: Arch Biochem Biophys 2000,
373:44.
7. Ziegler GA, Vonrhein C, Hanukoglu I, Schulz GE: J Mol Biol 1999, 289:981.
8. Akhrem AA, Shkumatov VM, Chashchin VL: Doklady AN SSSR 1977, 237:1509.
9. Mueller JJ, Lapko A, Bourenkov G, Ruckpaul K, Heinemann U: J Biol Chem
2001, 276:2786.
10. Schiffler B, Zöllner A, Bernhardt R: J Biol Chem 2004, 279:34269.
11. Ivanov YD, Usanov SA, Archakov AI: Biochem Mol Biol Int 1999, 47:327.
12. Schiffler B, Kiefer M, Wilken A, Hannemann AHW, Bernhardt R: J Biol Chem
2001, 276:36225.
13. Usanov SA, Turko IV, Chashchin VL, Akhrem AA: Biochim Biophys Acta 1985,
832:288.
14. Müller EC, Lapko A, Otto A, Müller JJ, Ruckpaul R, Heinemann U: Eur J
Biochem 2001, 268:1837.
15. Aoki M, Ishimori K, Fukada H, Takahashi K, Morishima I: Biochim Biophys Acta
1998, 1384:180.
16. Kido T, Kimura T: J Biol Chem 1979, 254:11806.
17. Ivanov YD, Kanaeva IP, Gnedenko OV, Pozdnev VF, et al: J Mol Recognit
2001, 14:185.
18. Kuznetsov VY, Ivanov YD, Bykov VA, Saunin SA, Fedorov IA, Lemeshko SV,
Hui Bon Hoa G, Archakov AI: Proteomics 2002, 12:1699.
Figure 7 AFM image (a) and the corresponding density of distribution with height r(h)) for CYP11A1/AdR/Ad (b); comparison of
r(h)
AdR/Ad/CYP11A1
distribution vs. normalized r(h)
CYP11A1/Ad
, r(h)
CYP11A1/AdR
and r(h)
AdR/Ad
distributions (the summarized area under
curves r(h) for binary mixtures is reduced to 100%) (c); differential curve (Δr) between r(h)
CYP11A1/AdR/Ad
for ternary mixture and the
sum of r(h)
CYP11A1/Ad
, r(h)
CYP11A1/AdR
and r(h)
AdR/Ad
for binary mixtures (d). Arrows (1) indicate the images of protein monomers. Arrows (2)
indicate the images of the binary protein complexes. Arrows (3) indicate the images of the ternary CYP11A1/AdR/Ad complexes. Tapping mode.
Experimental conditions were as follows: mixture of 7.5 μM solutions (10 μl each) of appropriate individual proteins (monomeric CYP11A1,
containing 1.5% Emulgen 913, Ad and AdR) in 50 mM KP, pH 7.4, was incubated for 10 min, diluted 2.5 times in the same buffer, and a 5-μl
portion of the mixture was immediately placed onto mica.
Ivanov et al. Nanoscale Res Lett 2011, 6:54
/>Page 12 of 13
19. Kanaeva IP, Dedinskii IR, Skotselyas ED, Krainev AG, Guleva IV, Sevryukova IF,
Koen YM, Kuznetsova GP, Bachmanova GI, Archakov AI: Arch Biochem
Biophys 1992, 298:395.
20. Kiselyova OI, Yaminsky IV, Ivanov YD, Kanaeva IP, Kuznetsov VY, Archakov AI:
Arch Biochem Biophys 1999, 371:1.
21. Kuznetsov VY, Ivanov YD, Archakov AI: Proteomics 2004, 4:2390.
22. Uhlmann H, Beckert V, Schwarz D, Bernhardt R: Biochem Biophys Res
Commun 1992, 188:1131.
23. Huang JJ, Kimura T: Biochemistry 1973, 12:406.
24. Sagara Y, Wada A, Takata Y, Waterman MR, Sekimizu K, Horiuchi T: Biol
Pharm Bull 1993, 16:627.
25. Chu J-W, Kimura T: J Biol Chem 1973, 248:2089.
26. Akhrem AA, Lapko VN, Lapko AG, Shkumatov VM, Chashchin VL: Acta Biol
Med Ger 1979, 38:257.
27. Yang J, Mou J, Shao Z: Biochem Biophys Acta 1994, 1199:105.
28. Guckenberger R, Heim M, Cevc G, Knapp HF, Wiegrabe W, Hillerbrand A:
Science 1994, 266:1538.
29. Meharenna YT, Oertel P, Bhaskar B, Poulos TL: Biochemistry 2008, 47:10324.
30. Zöllner A, Hannemann F, Lisurek M, Bernhardt R: J Inorg Biochem 2002,
91:644.
31. Zöllner A, Pasquinelli MA, Bernhardt R, Beratan DN: J Am Chem Soc 2007,
129:4206.
32. Guryev O, Carvalho RA, Usanov SA, Gilep A, Estabrook RW: PNAS 2003,
100:14754.
33. Sugan S, Miura R, Morishima N: J Biochem 1996, 120:780.
34. Uhlmann H, Kraft R, Bernhardt R: J Biol Chem 1994, 269:22557.
35. Zöllner A, Kagawa N, Waterman MR, Nonaka Y, Takii K, Shir Y,
Hannemann F, Bernhardt R: FEBS J 2008, 275:799.
36. Lebedev AD, Levchuk YN, Lomakin AV, Noskin VA: Laser Correlation
Spectroscopy and Biology. Naukova Dumka, Kiev; 1987.
37. Beilke D, Weiss R, Lohr F, Pristovsek P, Hannemann F, Bernhardt R,
Ruterjans H: Biochemistry 2002, 41:7969.
38. Bustamante C, Vesenka J, Tang CL, Rees W, Guthold M, Keller R: Biochemistry
1992, 31:22.
39. Scott EE, He YA, Wester MR, White MA, Chin CC, Halpert JR, Johnson EF,
Stout CD: Proc Natl Acad Sci USA 2003, 100(23):13196.
40. Thomson NH: J Microsc 2005, 217:193.
doi:10.1007/s11671-010-9809-5
Cite this article as: Ivanov et al.: Atomic Force Microscopy Study of
Protein–Protein Interactions in the Cytochrome CYP11A1 (P450scc)-
Containing Steroid Hydroxylase System. Nanoscale Res Lett 2011 6:54.
Submit your manuscript to a
journal and benefi t from:
7 Convenient online submission
7 Rigorous peer review
7 Immediate publication on acceptance
7 Open access: articles freely available online
7 High visibility within the fi eld
7 Retaining the copyright to your article
Submit your next manuscript at 7 springeropen.com
Ivanov et al. Nanoscale Res Lett 2011, 6:54
/>Page 13 of 13