The Handbook of Project Management: A Practical Guide to Effective Policies and Procedures, 2nd Revised Edition_7 pptx
Bạn đang xem bản rút gọn của tài liệu. Xem và tải ngay bản đầy đủ của tài liệu tại đây (310.53 KB, 24 trang )
When third parties are required to carry out part of the work of a project
it is essential to come to an understanding with them about the basis of
their estimates. Remember that their estimate is probably a bid and
includes contingencies and profit.
Contingencies are discussed later, but always avoid including contin-
gencies in your estimates. Clearly identify extra time that is added for holi-
days, etc. However, if you are not careful people will add extra time and
cost as a form of protection and argue that this can help bring in the
project early and under budget. Ruthlessly strip such contingencies out of
estimates. Padding estimates in this way can make an apparently good
investment look like a bad investment or, if the work is approved, with-
hold funding and approval from other potentially valuable projects.
These problems should never occur if you have an active PST and adopt
the principles and processes we have discussed in earlier chapters.
THE GOLDEN RULES
To minimize the probability of falling into the pitfalls pay particular atten-
tion to the golden rules of estimating:
• The individual doing the estimating must have a good understanding
of the work he or she is estimating.
• Anyone expected to be involved in actually doing the work must be
involved in estimating the task durations. These are the only people
who know their limitations (although they may not always admit to
them) and they will clearly identify when there is a steep learning
curve before output is matched to the schedule requirements.
• Everyone involved in estimating must clearly understand the purpose
and objectives of what they are doing and how to estimate effort and
the size of the tasks. Only then will they produce estimates that will
ultimately come true and avoid the mistake of predicting their best
possible performance.
EFFORT AND DURATION
Fundamentally, an estimate is a decision about how much time and
resource is required to carry out a piece of work to acceptable standards of
performance. This requires you to determine:
• The ‘size’ of the task or group of tasks, as determined from measure-
ments if possible.
Planning your project
l
137
• The amount of ‘effort’ required to complete the work. How can the
work be broken down? Can it be divided between two or more people?
Effort is measured in project time units – hours, days or weeks.
• The level of risk involved.
Once the effort is known it is possible to optimize the resource needs,
taking individual capacities or available time into account to determine the
levels of effort required from each.
Effort is a direct measure of a person’s time to do a piece of work in
normal workdays. Unfortunately that person will often have other non-
project activities to complete, which reduces his or her capacity to do the
project work. At a capacity of 50 per cent the work will take at least double
the estimated number of workdays. In practice it takes up to 20 per cent
longer than this because of the ‘back-track’ effect due to the breaks in the
continuity of the work. Effort is measurable as continuous work with no
interruptions.
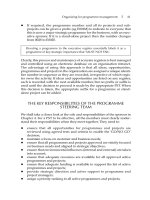
Duration is a conversion of effort taking into account the number of
people involved, their capacities and an allowance for non-productive
time. It is often more convenient to use full-time equivalents (FTEs) in
deriving how many people are needed for any part of a project.
Since duration is measured in real working days this is never the same
as the schedule, which has to take into account:
• non-available days for project work;
• non-working days – weekends;
• public and organization holidays;
• staff holidays.
The first step for you is to derive some realistic durations and then apply
these to a calendar to derive a schedule.
138
l
The programme and project processes and techniques
Figure 7.5 The relationship between effort, duration and schedule
EFFORT DURATION SCHEDULE
CALENDAR TIME
SIZE
EFFORT
DURATION = WORK DAYS
TASK
25
DON’T FORGET THE
DATE
ESTIMATING THE DURATIONS
Of course everyone wants accurate estimates as the consequences of poor
estimating are serious and expensive. However, it is not practical in most
business environments to spend a lot of time in detailed planning and esti-
mating to derive the initial business case we discussed in Chapter 5. But
we do need the detail for the full plan development after PST approval. So
we can really consider three levels of estimating, as described below.
Idea evaluation – outline or order of magnitude estimate
This is the estimating process to avoid if you can. Unfortunately there are
usually more ideas seeking funding than funds available. The outline esti-
mate is an expert appraisal of predicted cost of the whole project for
presentation to the potential sponsor and seeks to pass through the initial
screening process discussed in Chapter 3. To save time it is frequently
based on past projects using a scale factor. The purpose of this estimate is
only to allow an evaluation and a decision to be taken about progressing to
a more detailed investigation of the potential project for submission to the
PST. This allows the idea to pass through Phase Gate Zero.
Accuracy: ± 35–50%
Project selection – top–down estimate
This estimate is used to prepare a proposal and business case for a
proposed project to seek PST approval and pass through Phase Gate One.
This type of estimate uses past experience of similar projects where avail-
able and has the goal of estimating the time and cost of completing each
key stage identified in the work breakdown structure for the proposed
project. Here it is essential for the golden rules of estimating to be applied
because you do not have the luxury of time to engage in detailed analysis
of each key stage. The accuracy must be good enough to create confidence
in preparing a full business case and high level schedule for presentation
to the PST for approval. It is common for feasibility studies to include this
level of estimating.
Accuracy: ± 15–25%
Project approved – detailed or bottom-up estimate
Once a project has been approved and taken through the definition phase
the PST makes a decision to open Phase Gate Two into the planning phase.
Now the duration and effort for all the tasks in every key stage are anal-
ysed in detail to derive accurate estimates for the schedule preparation.
Planning your project
l
139
This estimate is based on all available data and must use information on
resource capacity and availability from organization resource mapping.
Bottom-up estimating is the most time-consuming but also the most
accurate form of estimating. The data for all the tasks can be rolled up for
each key stage using the work breakdown structure, allowing the prepara-
tion of the key stage cost data and the project budget.
Accuracy: ± 5%
Sources of data
As the duration of each key stage is the real time it will take to complete the
work this is usually the most difficult part of the planning process.
Unfortunately there is an abundance of ‘good advice’ in most organiza-
tions about how long a piece of work will or should take. The process
appears to be part art and part science, which is hardly surprising since
you are really trying to predict the future! So far no one has produced a
reliable crystal ball!
The sources for accurate estimates are limited. They are:
• experience of others;
• the expert view;
• historical data from other projects.
There is no substitute for experience. If similar work has been done before,
you can ask others for their own experience and adjust the data for your
project. It is a reasonable way to start but always take a cautious approach.
Elegant technical tools such as Monte Carlo exist for estimating but they
depend on a large database of information and are difficult to justify in
many situations.
The data you collect in this way will often hide important relevant infor-
mation. No one will easily admit taking longer than the plan predicted for
a piece of work – particularly if slippages caused problems. Also, people’s
memories have a habit of only remembering the good news with the
passage of time. If good plans and records exist review these to determine
what actually happened compared to what was planned to happen. Take
more than one opinion if you can and remember no two people ever do
the same piece of work at the same pace. The equation relating effort and
performance is different for us all.
Who are the experts? There may be a few – or so they believe! Always
ask questions about how reality compared with original estimates for
some work. Check that the nature or content of the work did not change.
You soon discover who is above average at estimating accurately – these
individuals are the experts you desperately seek. Since it is relatively rare
140
l
The programme and project processes and techniques
for work to be identical between different projects, apply your adjusting
factor to arrive at a realistic duration for each of the activities. Keep a record
of how you derived the estimates in case you are wrong, then you can
improve your estimating skills.
People problems
Ask anyone how long a piece of work will take and you are likely to be
given a shrug and a smile and a wildly inaccurate answer. This is because
people do not ask themselves some simple questions:
• Do I really understand what is involved?
• Do I have all the necessary skills and tools for the work?
• What else must I do at the same time?
• What is the priority of the project work compared with other work?
• When is the project work really needed by?
• Can I break the job down into chunks to do at different times?
• Can I predict what I will be doing when this project work needs to be
done?
• Will I be taking any holiday during the time concerned?
• Do I have any other obligatory commitments during the time
concerned?
• What does my manager know about my future commitments that I do
not know yet?
The reality is that the majority of people are not productive 100 per cent of
the time! As much as 20 per cent of people’s working week is taken up by:
• meetings – particularly ones they need not attend;
• general interruptions:
– visits to desk and others – wanderlust;
– equipment failure;
– reading journals and e-mail;
– searching for information;
– giving support and advice to others;
• commitments to routine functional work and other projects;
• unforeseen events;
• seeking advice from others;
• communication failures;
• personal organization;
• engaging in conflict;
• inability to say ‘No’ to others’ requests.
Planning your project
l
141
Consider also:
• project complexity:
– specifications: adequacy, unfamiliarity;
– new quality standards;
– unclear understanding of the technology;
– new technology, which always has a learning curve for confi-
dence;
• team size and location of the team members;
• anything else you can think of.
The answers to the questions above and other similar questions are often
ignored in deriving an initial estimate, leading to considerable problems
later. Rash promises are assumed as realistic and inserted into the plan.
CONTINGENCIES
The purpose of contingencies is to attempt to quantify the extent of uncer-
tainty in the estimating process that makes up the project plans.
Contingencies are not intended to cover changes to the project definition or objec-
tives after they have been agreed with the stakeholders nor are they intended to
cover estimating errors or tasks not included originally. If such changes occur
then the contingencies are rolled forward and adjusted. Ask:
• What factor can you use for adjusting people’s estimates?
• Is that factor global for all estimates or different for different types of
work and for different people?
• Should you expose your adjustment factors?
• What limits must you use in applying contingency?
• Should you multiply some estimates by an additional weighting for:
– team size;
– team experience (in individuals);
– team-working history of this team;
– project complexity;
– project use of new techniques or technology?
• If you think you should apply an additional weighting, what should it
be?
Use the answers to these questions to revise the base estimates. A scope
contingency may be required if there is uncertainty about the detail of some
parts of the plan. The scope contingency is only used when you as the
project manager specifically authorize its use through the change manage-
ment process. Remember that you must have clearly delegated authority to
use the contingency.
142
l
The programme and project processes and techniques
You take the final decision about the durations entered into the plan to
calculate the total project time with a projected completion date.
Obviously there is a balance between the desired project completion date
and the projected or forecast completion date based only on estimates. The
former may well appear to be almost impossible and quite unrealistic, the
latter insupportable and good justification for cancelling the project!
Somewhere in the middle there is an acceptable solution. Always record
any assumptions you have made in deriving the durations.
Phased estimating
Phased estimating is frequently quoted as the best way to manage a
project as it demands cost and schedule commitments only for one phase
at a time. The method is popular with project managers because it allows
flexibility and obviously it reduces the problems of estimating the future
before the current situation is resolved. It does limit the information and
clarity of total project cost and schedule time for successful completion
and stakeholders are frequently unhappy about this lack of commitment.
You must break the project down into ‘phases’ that are really sub-
projects and these are each planned in detail with accurate estimates. At
the end of the set of sub-projects the outputs are used as inputs to the next
‘phase’ or set of sub-projects that are then subject to detailed planning.
This can lead to a stop–go situation with considerable uncertainty about
resource availability and capacity and an unknown project completion
date – potentially the endless project!
The phase gate approach recommended in this book allows you to esti-
mate in detail at the key stage level and confidently derive a detailed
schedule for total project cost and time computation. The detail that needs
to be exposed within each key stage is derived and validated as you move
through the project work. As issues arise and are resolved the impact on
the schedule can be readily evaluated with appropriate corrective action
agreed and undertaken. The whole process has visibility to the stakehold-
ers and significant changes can be proposed and agreed in the full under-
standing of the impact on completion date and objectives.
TIME-LIMITED SCHEDULNG AND ESTIMATES
There is always a conflict when a completion date is imposed on a project
before any work on estimates is carried out. This imposed date is
completely outside your control so you attempt to compress estimates to
fit the plan. To a limited degree this process is acceptable, in that it gives a
target, but too often it moves you into a totally unreal situation where you
are faced with ‘mission impossible’. Apart from the complexity of the work
Planning your project
l
143
impacting the time element you have to make huge assumptions about
resource availability. You must still prepare realistic estimates to derive a
clear case and state:
• what you can deliver in the time;
• what you cannot deliver in the time;
• why you can only meet part of the objectives of the project.
You can then use your skill as a negotiator to arrive at an agreed solution!
Practical estimating
Since the major portion of all project costs is frequently the time expended,
the accuracy of estimates is a key factor in achieving project success.
Historical data, even from parts of previous projects, can be valuable as an
initial guide. Analysis of the actual proposed work is essential if accurate
estimates are to be derived. Even then people seem to habitually underes-
timate time for execution of work. There are some people who have an
intuitive ability to visualize the work involved and give accurate estimates
– identify these people and make good use of them!
Some practical guidelines that can be used are as follows:
• Schedule full-time team members at 3.5–4.0 working (productive)
days per week (to allow for holidays, absences, training courses, etc).
• Include management time where appropriate as an additional 10 per
cent.
• In planning, avoid splitting tasks between individuals.
• When tasks are split between two individuals do not reduce time by 50
per cent – allow time for communication and co-ordination.
• Take individual experience and ability into account.
• Allow time for cross-functional data transfer and responses.
• Build in time for unscheduled urgent tasks arising on other non-
project activities.
• Build in spare time for problem solving and project meetings.
• Include appropriate contingencies at all levels of planning.
Any estimate is only as good as the data upon which it is based so, like
project risks, accept that the estimate may change with time as more data
becomes available to you. As the project continues always review and vali-
date the durations you have used. For each key stage keep a record of:
• the estimates you have finally decided;
• any assumptions made during estimating;
• where contingencies have been added;
• how much contingency has been added.
144
l
The programme and project processes and techniques
Now, with durations agreed, you can analyse the logic diagram for its
critical path.
IDENTIFYING THE CRITICAL PATH OF YOUR PROJECT
Critical path techniques have been in use on projects now for some 30
years, having proved their value as a tool for project scheduling and
control. The fundamental purpose is to enable you to find the shortest
possible time in which to complete your project. You can do this by inspec-
tion of the logic diagram.
Enter the durations on to your Post-it notes in the logic diagram for each
key stage. Begin at the START note and trace each possible route or path
through the diagram to the FINISH note, adding the durations of all the
key stages in the path. The path that has the highest number – that is,
the longest duration – is the critical path of your project and represents the
shortest time in which it is possible to complete the project. All other paths
are shorter. All the key stages on the critical path must, by definition, finish
on time or the project schedule will slip.
For example: referring to the previous logic diagram (Figure 7.6), the
available paths are:
1. Start – planning – design phase 1 – purchase orders – install – testing –
finish: 37 days.
2. Start – planning – design phase 1 – design phase 2 – install – testing –
finish: 42 days.
3. Start – planning – design phase 1 – train staff – testing – finish: 36 days.
4. Start – client survey – design phase 1 – purchase orders – install –
testing – finish: 56 days.
5. Start – client survey – design phase 1 – design phase 2 – install – testing
– finish: 61 days.
6. Start – client survey – design phase 1 – train staff – testing – finish: 46
days.
7. Start – client survey – training design – train staff – testing – finish: 42
days.
So, the critical path is number 5 in the list of available paths.
This is where reality hits you – is the project total time what your
customer actually requires? If it is a long way out, do not worry yet, as
most project managers expect this to happen. Remember, your estimates
are based on people’s perceptions. Your job is to attempt to compress the
time to a schedule that, on the one hand, is real and achievable and, on the
other, satisfies your customer. To do this you need to make use of another
Planning your project
l
145
valuable tool of project management: Programme Review and Evaluation
Technique (PERT). This tool allows you to analyse the logic diagram to
confirm:
• the critical path – confirmation of your inspection;
• the start and finish times of all the key stages;
• the amount of ‘spare time’ available in the non-critical key stages.
All these data are very useful to you for optimizing the project schedule
and, more importantly, for the control of the project work once this starts.
THE PROGRAMME EVALUATION
AND REVIEW TECHNIQUE
The PERT method of critical path planning and scheduling is the most
commonly used technique for project management control. It is based on
representing the activities in a project by boxes (or nodes) that contain
essential information calculated about the project. The interdependencies
between the activities are represented by arrows to show the flow of the
project through its various paths in the logic diagram. The PERT diagram
(sometimes referred to as a network) is identical to the logic diagram you
derived earlier, each Post-it note for a key stage representing a node.
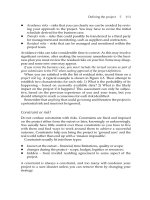
The conventional data stored in the node box are as shown in Figure 7.7.
The four corners of the node box are used to store the four characteristic
146
l
The programme and project processes and techniques
planning
5 days
design
phase 1
9 days
purchase
days
design
phase 2
25days
install
5 days
testing
7 days
Finish
0 days
train
staff
15days
design
training
5 days
client
survey
15days
Start
0 days
orders
20
design
training
5 days
Figure 7.6 The logic diagram with durations inserted. Note: durations are in
consistent units
times for the key stage. These are calculated times using the durations
derived in estimating; remember to keep all durations in the same units.
The lower middle box contains the total float for the key stage. This is the
spare time in the key stage that allows you to take decisions about the
actual start time or extending the duration within limits.
In Figure 7.7 the earliest start time is day 12 and the latest start time is
day 16. This gives an option to start the activity any time between day 12
and day 16. The four-day difference is the spare time associated with the
activity. Starting anywhere in this time zone will not affect the total project
time provided the activity is fully completed by the latest finish time of
day 26. Say you were to start the activity on day 12 as the earliest planned
date. If the time taken becomes extended from 10 days to 14 days, you use
up all the spare time but maintain the total project time. If, however, the
duration becomes extended to 16 days – two days more than the available
spare time – you will extend the total project time by two days.
Obviously, this process applies to every key stage and lower-level activ-
ity in the WBS. If every key stage takes longer than the available spare
time, the project will be very late. If the spare time is calculated as zero
then that key stage is termed critical and is one of those on the critical path.
The PERT technique is founded on calculating this information to permit
you to take such decisions and control the project.
The default or normal relationship used is FINISH-to-START (see Figure
7.8). Under certain circumstances it is valid to impose constraints with the
START-to-START or FINISH-to-FINISH relationships between activities.
Planning your project
l
147
12 10 22
26416
Activity
description
Earliest finish time
(EFT)
Latest finish time
(LFT)
Latest start time
(LST)
Earliest start tTime
(EST)
Activity duration
Total float
12 10 22
26416
Activity
description
Earliest finish time
(EFT)
Latest finish time
(LFT)
Latest start time
(LST)
Earliest start time
(EST)
Activity duration
Total float
Figure 7.7 The PERT node box
You can impose a forced delay using a LAG between the START or FINISH
of a predecessor activity and the START or FINISH of one or more succes-
sor activities.
The forced start or LEAD is used to start a SUCCESSOR ACTIVITY
before the PREDECESSOR ACTIVITY is completed.
Lags and leads should be used with care; it is easy to become confused
and introduce errors. Split an activity instead of using leads to keep the
diagram relatively easy to read and understand.
148
l
The programme and project processes and techniques
Figure 7.8 Relationships in the PERT diagram
RELATIONSHIPS
S
F
F
S
F
S
‘3’ LAG
‘4’ LEAD
S
F
AA
AC
F
S
AE
AB
AD
‘AA’ IS THE
PREDECESSOR
ACTIVITY OF ‘AB’
AND ‘AC’
‘AD’ IS THE
SUCCESSOR
ACTIVITY OF ‘AB’
AND ‘AC’
F
S
AF
F
S
AG
RELATIONSHIPS
‘FINISH-TO-START’
AA MUST FINISH BEFORE AB AND AC CAN START
‘START-TO-START’
AE MUST START BEFORE AG CAN START (AG is freeto start as soon a s AE starts)
‘FINISH-TO-FINISH’
AF MUST FINISH BEFORE AD CAN FINISH (AD can onlyfinish AFTER AF has finished)
‘LAG’
AD CAN START 3 DAYS AFTER AC IS FINISHED (an intentionaldelay o f 3 days before AD starts)
‘LEAD’
AE CAN START 4 DAYS BEFORE AC FINISHES (an intentionalearly sta rt of AE by 4 days)
RELATIONSHIPS
S
F
F
S
F
S
‘3’ LAG
‘4’ LEAD
S
F
AA
AC
F
S
AE
AB
AD
‘AA’ IS THE
PREDECESSOR
ACTIVITY OF ‘AB’
AND ‘AC’
‘AD’ IS THE
SUCCESSOR
ACTIVITY OF ‘AB’
AND ‘AC’
F
S
AF
F
S
AG
RELATIONSHIPS
‘FINISH-TO-START’
AA MUST FINISH BEFORE AB AND AC CAN START
‘START-TO-START’
AE MUST START BEFORE AG CAN START (AG is free to start as soon as AE starts)
‘FINISH-TO-FINISH’
AF MUST FINISH BEFORE AD CAN FINISH (AD can only finish AFTER AF has finished)
‘LAG’
AD CAN START 3 DAYS AFTER AC IS FINISHED (an intentional delay of 3 days before AD starts)
‘LEAD’
AE CAN START 4 DAYS BEFORE AC FINISHES (an intentional early start of AE by 4 days)
‘AA’ IS THE
PREDECESSOR
ACTIVITY OF ‘AB’
AND ‘AC’
‘AA’ IS THE
PREDECESSOR
ACTIVITY OF ‘AB’
AND ‘AC’
‘AD’ IS THE
SUCCESSOR
ACTIVITY OF ‘AB’
AND ‘AC’
F
S
AF
T
’
AY
ANALYSING THE LOGIC DIAGRAM
The analysis of the diagram is a simple logical process extending the initial
calculation you made earlier to locate the critical path. Two steps are
involved: 1) adding durations from start to finish – the forward pass;
2) subtracting the durations from finish to start – the backward pass. Figures
7.9–7.11 illustrate the technique.
As you can see, the calculations involve only some simple arithmetic
and you can easily carry out the analysis on the actual Post-it notes you
used to derive the logic diagram. In this way you and your team can
quickly calculate the total project time and find those areas of the project
where float time exists.
USING THE PERT ANALYSIS DATA
At this point in the planning process you may be looking at a plan that is
giving you a total project time considerably longer than you really want.
Do not despair – yet! Do not allow yourself to be tempted to go back and
amend your time estimates. The next step is to convert the PERT data into
a graphic format that is easier to work with and understand. This is the
Gantt chart – a very useful tool for project work originally devised by
Henry Gantt early in the 20th century. At the time it was devised, Henry
Gantt could not have truly envisaged just how valuable his invention
would become for project managers.
The Gantt chart and its various parts are shown in Figure 7.12. The chart
allows you to show a listing of all the key stages of the project, their dura-
tions and, if required, who is responsible. The chart is divided into two
sections: a tabulated listing and a graphic display on which each key stage
is represented by a rectangle. All the rectangles are located on a time-
scaled grid to show their position in the schedule. It is useful to have both
a project timescale bar and a calendar timescale bar across the top of the
chart. This allows you to include the non-working days such as weekends
and holidays. The key stages are listed on the left-hand side by conven-
tion, in order of their occurrence in the logic diagram (working from left to
right). List activities in such an order that the rectangles will appear on the
chart to give a perception of flow. This is from the top left-hand corner to
the bottom right-hand corner where project completion occurs.
You will note that the float time is also shown on the chart as a trough
extension to those rectangles or bars (the common term) on the right-hand
end, ie at the finish end of the bar. When you initially draw any Gantt chart
the float is always drawn at this end. The limit of float is the limit of the time
available if the schedule is not to be threatened and, possibly, the whole
Planning your project
l
149
150
l
The programme and project processes and techniques
STEP 1
Decide the time each activity or key stage will take and enter these DURATIONS
on to the logic notes or BOXES.
STEP 2
Number each box from START through to FINISH, working from left to right – numbers
or alphanumerics.
Then mark the START box
with a PROJECT START TIME
of ZERO as shown:
START
10
20
30
5
4
6
FINISH
START
10 20
30
5
4
6
FINISH
0
STEP 3
Transfer this TIME figure to the next box in the logic diagram:
STEP 4
Add the DURATION of the new box
and record the sum as shown.
START
10
20
30
5
4
6
FINISH
0
0
5
5
5
Then transfer this time figure to the next box(es) in the diagram.
STEP 5
Repeat STEP 4, working through the LOGIC DIAGRAM from left to right.
When ‘paths’ meet, ensure you record the HIGHEST NUMBER into the next box.
3
40
3
40
3
40
Figure 7.9 Analysing the project logic diagram – 1
Planning your project
l
151
The completed FORWARD PASS analysis now looks like this:
START
10
20
30
54
6
FINISH
0055
511
914
So, we can conclude that the earliest time this small project can finish is 14
units of time.
The whole process is now reversed.
START
10
20
30
54
6
FINISH
0055
5
11
9
14
STEP 6
Transfer the finish time to the bottom corner of the box as shown.
14
Then copy this same time figure to the lower right-hand corner of the predecessor box.
STEP 7
START
10
20
30
5
4
6
FINISH
00
55
5
11
9
14
14
Subtract the activity DURATION from this time figure and enter the result in the
lower left-hand corner of the same box.
11
11
Then copy the result time figure to the lower right-hand corner of any predecessor boxes
as shown above.
STEP 8
START 10
20
30
5
4
6
FINISH
0055
511
9
14
14
11
11
Continue step 7, copying the LOWEST TIME FIGURE to the next predecessor box
where paths merge in the reverse pass.
7
5
5
0
0
3
40
11 14
3
40
11 14
14
3
40
11
14
14
11
3
40
11
14
14
11
The completed FORWARD PASS analysis now looks like this:
START
10
20
30
54
6
FINISH
0055
511
914
START
10
20
30
54
6
FINISH
0055
5
11
9
14
14
STEP 7
START
10
20
30
5
4
6
FINISH
00
55
5
11
9
14
14
11
11
START 10
20
30
5
4
6
FINISH
0055
511
9
14
14
11
11
7
5
5
0
0
3
40
11 14
3
40
11 14
14
3
40
11
14
14
11
3
40
11
14
14
11
Figure 7.10 Analysing the project logic diagram – 2
152
l
The programme and project processes and techniques
Figure 7.11 Analysing the project logic diagram – 3
The analysis of this logic diagram is now complete and the CRITICAL ELEMENTS can
be clearly identified.
STEP 9
Look at each box in turn and identify those where the DIFFERENCEbetween the
time figures in the UPPER and LOWER left-hand corners is EQUAL to the difference
between the time figures in the UPPER and LOWER right-hand corners.
THESE BOXES IN YOUR DIAGRAM ARE THE CRITICAL ELEMENTS
AND FORM THE CRITICAL PATH OF THE LOGIC DIAGRAM.
DIFFERENCE = 0
DIFFERENCE = 0
A CRITICAL ACTIVITY
START
10
20
30
54
6
FINISH
005 5
511
4
14
11
11
7
5
500
STEP 10
Finally, enter the above-calculated DIFFERENCE in the lower MIDDLE part of the
box. This is the spare time or FLOAT TIME.
Then calculate the FLOAT times for all the boxes in the diagram:
0
2
0
The LOGIC DIAGRAM analysis is now complete. Record the data in tabular format.
TERMINOLOGY
Earliest start time
Earliest finish time
Duration
Latest start time
Latest finish time
Total float
3
40
1411
14
11
3
40
1411
14
11
0
3
40
1411
14
11 0
3
40
1411
14
11
0
.
CRITICAL .
START
30
54
6
FINISH
511
914
14
11
11
7
5
0
,
s
2
0
ai
3
40
1411
14
11
3
40
1411
14
11
0
3
40
14
11
14
11 0
3
40
1411
14
11
0
project extended. Of course, critical activities have zero float and you can
choose to highlight these with the use of colour.
The dependency links you have established in the logic diagram are
not usually drawn on the Gantt chart, because they might cause some
confusion in reading the document.
Eventually you will use the Gantt chart to include some other useful
information by adding some symbols to the diagram, but do not use any
more than is essential. Essential data usually include:
Planning your project
l
153
GANTT CHART
PROJECT:
Line
No.
WBS
CODE
ACTIVITY
DESCRIPTION
Dur.
Notes:
Project Meetings
PROJECT TITLE
AND OTHER
RELEVANT DATA
REQUIRED
WORK BREAKDOWN
CODE FOR THE KEY
STAGE/ACTIVITY –
IN ORDER OF LOGIC
PROJECT TIME BAR SCALE
– hours/days/weeks
PROJECT CALENDAR BAR
From start date with scale
consistent with the
Project Time Bar
MILESTONE
RECTANGULAR
ACTIVITY BAR
– Length equals the
activity duration
ACTIVITY
DESCRIPTION
– use consistent
names in ALL
documents
ENTER DURATION –
use consistent units
TOTAL FLOAT –
show as a trough
or single line
INCLUDE A MEETINGS
SCHEDULE ON THE
CHART
DEPENDENCY LINE
These can be included as thin
arrowed lines if required. Useful to
include for planning and ‘what-if’
analysis.
ALWAYS INCLUDE A LEGEND TO DEFINE ANY
SYMBOLS USED IN THE CHART.
ALSO INCLUDE A REVISION BLOCK TO RECORD
THE NUMBER AND DATE OF ANY UPDATED
REVISED VERSIONS ISSUED
Note: The bars for critical
activities have no total float
trough or line
GANTT CHART
PROJECT:
Line
No.
WBS
CODE
ACTIVITY
DESCRIPTION
Dur.
Notes:
Project Meetings
GANTT CHART
PROJECT:
Line
No.
WBS
CODE
ACTIVITY
DESCRIPTION
Dur.
Notes:
Project Meetings
PROJECT TITLE
AND OTHER
RELEVANT DATA
REQUIRED
WORK BREAKDOWN
CODE FOR THE KEY
STAGE/ACTIVITY –
IN ORDER OF LOGIC
PROJECT TIME BAR SCALE
– hours/days/weeks
PROJECT CALENDAR BAR
From start date with scale
consistent with the
Project Time Bar
MILESTONE
RECTANGULAR
ACTIVITY BAR
– Length equals the
activity duration
ACTIVITY
DESCRIPTION
– use consistent
names in ALL
documents
ENTER DURATION –
use consistent units
TOTAL FLOAT –
show as a trough
or single line
INCLUDE A MEETINGS
SCHEDULE ON THE
CHART
DEPENDENCY LINE
These can be included as thin
arrowed lines if required. Useful to
include for planning and ‘what-if’
analysis
ALWAYS INCLUDE A LEGEND TO DEFINE ANY
SYMBOLS USED IN THE CHART.
ALSO INCLUDE A REVISION BLOCK TO RECORD
THE NUMBER AND DATE OF ANY UPDATED
REVISED VERSIONS ISSUED
Note: The bars for critical
activities have no total float
trough or line
Figure 7.12 Gantt chart
• milestones – special checkpoints usually indicated by a triangle or a
diamond symbol;
• project meetings – indicated by a filled circle or dot;
• project reviews (ie financial/audit) – indicated by a filled square.
Remember to give a legend describing what the symbols mean!
The initial Gantt chart you produce at this stage is then optimized to
reflect what you can achieve with available resources balanced with
customer desires. This frequently involves compressing the schedule to
reduce the time for the project. If there are no resources to do the work in
the time scheduled, the Gantt chart is a useless document expressing
hopes and wishes! Analyse the resource requirements for the tasks in the
plan and then optimize the schedule.
To arrive at an acceptable solution involves considerable reiteration – a
process where project management software is very powerful. Small
changes in the schedule are rapidly reflected in the chart and the logic
simultaneously recalculated automatically. You can use ‘what if ’ analysis
to explore all options to derive a finally acceptable schedule. This process
provides the evidence to convince your customer and the sponsor just
what is realistically possible provided clear commitments of resources are
made. Obviously this process is much more time consuming manually!
ANALYSING YOUR RESOURCE REQUIREMENTS
You must now ask your key stage owners to validate the task list in their
respective key stages using the techniques used earlier for the key stages.
Many of the data will have been generated earlier, but now need some
closer analysis, particularly for the initial key stages.
Identify the resources most likely to be assigned the work and then,
working with them as an extended team:
• Review the initial task list.
• Add to the tasks where necessary.
• Analyse for the ‘often forgotten tasks’:
– documentation;
– approval times;
– testing planning and development;
– project reviews and gathering the data;
– project meetings;
– replanning and planning reviews;
– customer meetings;
– user group meetings;
– negotiations with suppliers;
154
l
The programme and project processes and techniques
– expediting and purchasing administration;
– training;
– inter-site travel and communication;
– updating project file records.
Suggest that each key stage owner draws up a complete list of tasks, and
then produces a responsibility chart for each key stage. Then he or she can
estimate the durations of all the tasks in the key stage using the same tech-
niques as before. With the key stage owner, identify the actual people who
will carry out the work and confirm their commitment and availability.
When you identify resources, remember to review:
• their previous experience;
• their individual capabilities;
• their technical knowledge;
• the accuracy of their work;
• their speed of working;
• their capacity to do the work.
Use the same techniques as before to derive the logic diagram for all the
tasks inside each key stage. Then determine its critical path and the total
float available in the tasks. Some of these tasks may be assigned milestone
status later. This enables you to produce a Gantt chart for each key stage.
As the project continues, you develop a complete family of such charts
that are all expanded views of the primary or overall key stage Gantt chart.
In this way, a detailed plan of the work for a particular part of the project is
clearly defined by the people doing the work, and it minimizes misunder-
standings about responsibility. At the same time, these people can confirm:
• that the work can realistically be completed on time;
• resource capacity and availability;
• the commitment of the line manager(s) to providing resources.
You now have the data to update the WBS. However, another advantage of
this method is that the detailed work of a key stage does not need to be
derived until a week or two before the work starts. This allows the planning
to incorporate any unexpected outputs from earlier key stages. In this way
you continuously work to hold your plan dates, seek the required resources
and optimize your schedule to meet the total project time desired.
OPTIMIZING YOUR SCHEDULE
The schedule is always based on the calendar, taking into account the non-
working days during the project. Before attempting to optimize, review
Planning your project
l
155
the project brief to check that nothing is forgotten and the plan is aligned
to stated objectives. The process of optimizing a schedule is a team activity
to create acceptance and commitment to the desired total project time.
Optimizing is conducted at two levels: project and business case. At the
project level, optimization involves taking decisions by consensus to main-
tain a balance between:
• the schedule – time;
• the resources available – cost;
• performance – scope and quality.
The options available are fairly limited when optimizing trade-offs
between these three to arrive at a solution. There is no perfect plan; only
the best solution based on available information at the time. The options
are as follows:
• Review original estimates – realistically.
• Review assigned durations – remove or reduce contingencies added.
• Seek more or different resources.
• Seek to get current resource capacities increased – more time available.
• Re-evaluate the dependencies in the logic for the key stages.
• Review relationships – initially you used FINISH-TO-START; now
examine whether other types give an improvement (see Figure 7.8).
• Introduce LAGS and LEADS – with caution, though.
• Split key stages to get more concurrency.
• Examine to ensure that reinvention is minimized.
Although it is sometimes tempting to use activity float times in optimizing,
it is better to keep this option up your sleeve. Float time is not to be seen as
an opportunity to stretch an activity to fill the available time. If you allow
this to happen, you create another critical activity by convention, so it is
easy to turn everything critical by using up all floats.
It is preferable to tell your team that float time is used only as a last resort
with your consent (during the execution phase) to enable recovery plan-
ning when things go wrong.
Re-estimate the project
Are you an optimist? You face the prospect of reviewing all your assump-
tions made during estimating durations and making amendments. You
may feel you have a deeper understanding of the project now and you
156
l
The programme and project processes and techniques
could reduce those estimates that were more pessimistic. Unless you have
new information to justify improved accuracy this is really wishful think-
ing and you subject your team to the risk of imposed durations. If you can
reduce estimates you reduce cost and possibly schedule time, but carefully
examine the consequences. The golden rule is ‘avoid reducing estimates
and, if you must, do so only in exceptional circumstances’.
Change task responsibilities
It is relatively easy to change task responsibilities, particularly with project
management software. The first step is to look carefully at the critical path.
As this dictates the total project time, if you can move resources from non-
critical key stages to the critical key stages you can reduce the total project
time. Remember, the non-critical key stages have float time so they get
done later anyway. Moving resources should not affect the project cost,
but be aware of the potential risks of doing this: an overrun of a critical key
stage could impact on the non-critical key stages owing to lack of resources
and change the critical path!
Just adding people to a key stage does not automatically proportion-
ately reduce duration. Having more people increases the communication
problems and may even cause confusion leading to loss of efficiency and
higher costs. The consequent effects on the non-critical key stage are
similar. Moving people is fine if you have enough of the right skills avail-
able, and the non-critical key stages must have sufficient float available to
allow you to reduce their float times. Always ensure you do not use more
than 60 per cent of available float in this activity.
The reduction in schedule time is a trade-off against increased cost, and
if this is not too significant, it may be acceptable to your customer and
sponsor. However, it is better to review the assignments initially to see if
you can reallocate the key stage responsibilities, or get your key stage
owners to reallocate task responsibilities within each key stage.
Moving people around could improve performance and reduce time
without affecting cost significantly. Replacing people with others having
more expertise may help reduce time, but possibly increase cost. However,
yours is not the only active project and the demands on the time of high
performers may exceed their availability.
Crashing a schedule
When a high-priority project is looking as though it cannot meet delivery
time requirements there is a temptation to ‘crash the schedule’. This
means compressing the critical path to shorten the whole project.
The consequences are significant cost increase and the probability that the
Planning your project
l
157
critical path will change, making the exercise complex. Any inaccuracy in
the estimates will rapidly become visible when work starts.
If you do try to crash the schedule, derive a schedule of the impact on
cost as shown in Figure 7.13.
Crashing a schedule can impact performance, affecting the quality of
the work done and ultimately the deliverables. This is usually not an
acceptable option. Another consequence is the need for people to work
longer hours, which may not proportionately improve output.
Do not confuse crashing with fast-tracking. Fast-tracking involves over-
lapping activities that are traditionally done in sequence. This technique
can be used sometimes on parts of a project but involves considerable risk
of extending the schedule and cost.
Revising the business case
If attempts to optimize at the project level do not produce the desired
result, you must resort to reviewing the business case. This requires the
authority of the customer and sponsor and possibly other stakeholders.
The obvious start point is the revision of the deliverables, either quality or
quantity. Reducing the quality of the deliverables may reduce the market
potential so a complete re-evaluation of the initial requirements must be
conducted.
Reviewing this compliance could eliminate some tasks and/or reduce
the estimates of duration. Focus initially on the critical tasks to reduce the
schedule time. If the project is over budget, a cost–benefit analysis is neces-
sary to evaluate the trade-offs of each benefit against the cost using the
work breakdown structure.
If the business case is revised, you must seek approval of the customer and
sponsor before resubmitting the business case to the PST for acceptance.
Whatever solution you finally derive, do not forget to update the key
stage Gantt chart and review the risks on the project risk log to identify
whether any risks have changed category, probability or impact.
With a final Gantt chart produced, you must decide that there is no
further improvement needed or it is the best result you can achieve. Before
you go through the final steps of tidying up your project plan it is advis-
able to present this schedule informally to your customer and project
sponsor to check whether it is acceptable. If it is not, then you must seek
alternative solutions through further optimization. If the schedule is
nominally agreed, you can proceed to the final steps of planning before
seeking PST approval to launch the actual work.
158
l
The programme and project processes and techniques
REVIEWING YOUR PROJECT RISK LOG
Refer to your project risk log and review all the risks identified during the
project definition phase. Ask:
• Have any changed status?
• Are there any new HIGH risks? Identify actions on a risk management
form.
• Are there any new risks identified from planning?
In reviewing risks it is tempting to avoid having any HIGH risks listed –
after all, it saves paperwork, but does it reflect reality? Remember, as
project manager you are responsible for project performance. If you
knowingly misrank a risk, who are you kidding? It could backfire on you
later, so carefully debate the quantifying and ranking of all risks with the
team and agree a result. Identify the triggers for the risks identified.
Planning your project
l
159
PROJECT TITLE:
PROJECT MANAGER:
PROJECT SPONSOR:
CUSTOMER:
PROJECT No:
Prepared by:
Date:
Version No:
CRASH IMPACT SCHEDULE
Key
stage
No:
Line
No:
Current
duration
Priority
Float
time
left
Current
cost £000s
Compressed
duration
Compressed
cost £000s
Cum.
increased
cost £000s
1 AA 15 10 8 18 8 0 5
2AB10 7 6 11 12 0 2
3AC20 16 14 22 18 0 4
4AD12 9 9 11 20 3
5BA18 15 13 20 25 0 3
6BB 6 4 4 6 27 0 1
7BC14 12 10 17 32 0 3
8BD10 8 8 10 34 5
TOTALS 105 81 72 115 34
n
d
51
4
41 20
11
Figure 7.13 Example crash impact schedule
160
l
The programme and project processes and techniques
Examine your plan to identify possible risk areas (refer back to Checklist 9,
p 110):
• tasks on the critical path (and inside a key stage);
• tasks with a long duration (low capacity factors);
• tasks succeeding a merge in the network;
• tasks with little float left (where is the float?);
• tasks dependent on third parties;
• tags and leads;
• START-TO-START relationships;
• tasks using several people (particularly at different times);
• complex tasks;
• anything involving a steep learning curve;
• tasks using new or unproved technology.
If any risks are no longer likely to occur, do not remove them from the log; only
remove the status ranking and leave these columns blank.
Prepare risk management forms for any new HIGH risks identified or
those that have moved up in ranking, and derive risk mitigation plans
where appropriate. These are copied with the risk log appropriately dated
as a new issue into the project file and to the sponsor. Assign responsibili-
ties for day-to-day monitoring of risks to the key stage owners. Stress the
importance of monitoring for the triggers that could signal a risk becoming
an issue. Avoiding a risk is better than a damage limitation exercise later!
Remember – any risk that happens becomes an issue, and this requires you
to take prompt action.
REVIEWING YOUR PROJECT BUDGET
At this point, now that the base plan is complete and you are confident
you have an acceptable schedule, review the project budget. Begin by
updating the project WBS with all the lower-level detail – or at least as
much as you can at this stage. This is the easiest way to work out the cost of
each, based on:
• capital equipment costs;
• resource direct costs – based on cost rates;
• revenue costs for the project team: materials, expenses, etc;
• indirect costs – chargeable overheads, etc.
With the costs of each key stage identified you can produce an operating
budget as a cumulative amount aggregated against the schedule time. This