The Handbook of Project Management: A Practical Guide to Effective Policies and Procedures, 2nd Revised Edition_10 doc
Bạn đang xem bản rút gọn của tài liệu. Xem và tải ngay bản đầy đủ của tài liệu tại đây (271.03 KB, 24 trang )
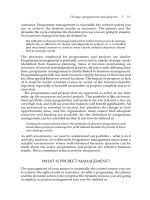
If a key stage is late starting or takes longer than expected to complete,
or the finish suffers a delay, this is shown clearly on the chart. The original
position of the bar on the chart is unchanged; changing it would modify
the baseline. Although doing so covers up the change that has taken place,
you lose the opportunity later to ask why it happened and what everyone
has learnt from the difficulties leading to the change.
Modifications to the plan are recorded as they occur to enable the expe-
rience to be logged for future projects. This may involve moving one or
more tasks away from the original baseline position. This appears odd on
the chart and tempts you to move the baseline with the comment, ‘Well,
we never actually expected it to happen like that!’ When you move
anything on the Gantt chart you are effectively modifying the project
strategy for a reason. There must be a purpose in making a change, and
leaving the baseline unchanged forces you to document fully the changes
to the plan and schedule using the change management process. Later
Executing the project work
l
209
total
float
task duration
Earliest
start time
Earliest
finish time
Latest
finish time
baseline
for task
Task extends into
total float zone –
baseline unchanged.
Project still on schedule
Task starts late and expected to take more time,
extending beyond total float zone
– baseline unchanged.
Project completion potentially delayed
unles
s
time is recovered at some other point
Baseline co-incident
with task duration bar
ORIGINAL PLAN – BASELINE
current
date line of
Gantt chart
Bars hatched or
filled to show
current status –
per cent complete
TASK START DELAYED –
DURATION EXTENDED
TASK START DELAYED
baseline
for task
TASK START DELAYED –
DURATION EXTENDED
Figure 9.7 Showing current status on the Gantt chart
you evaluate the key learning points from the project and all these
changes that occur. Of course, if any of these modifications applies to criti-
cal key stages or tasks then the project’s completion is likely to be delayed.
You then face the difficult task of recovery planning to try to recover the
original project schedule or persuade the customer to accept the extended
completion date.
Deciding what completion means
Ask anyone engaged in project work how they are getting on and you can
expect a reply like ‘Fine, I’m about halfway through.’ What does this really
mean? Is it really true that the work is 50 per cent complete? It is probably
a guess that, depending on the individual, may be accurate or well wide of
the real situation and just gives information you expect to hear!
The bar on a Gantt chart is a linear graphical representation of effort. In
real life, effort is never linear and depends on:
• the accuracy of the detailed planning of the tasks to be done;
• the complexity of the work;
• the amount of interruptions to the work;
• the availability of data and equipment;
• how the individual feels on the day.
The well-proven 80/20 rule applies: 80 per cent of the results come from 20
per cent of the effort and the remaining 20 per cent of the results take 80
per cent of the effort! Completing the last part of a piece of work can often
take considerably longer than expected and extend into or beyond the
total float zone on the Gantt chart. This brings you back to the metrics you
agreed to use to measure progress.
Unfortunately, there are nearly always forgotten tasks that take a signifi-
cant amount of time to complete:
• documentation;
• approval times;
• planning and developing test procedures;
• project reviews;
• project meetings;
• planning reviews;
• replanning meetings;
• customer meetings;
• user group meetings;
• negotiations with suppliers;
• expediting;
• searching for information;
• purchasing administration;
210
l
The programme and project processes and techniques
• training;
• travel and communication;
• updating project records.
These and others occupy time assigned to project work. You presume that
all tasks will be completed on time using the durations entered into the
schedule. Don’t ask for percentage completion assessments when seeking
progress data. You need to know whether the task will finish on time, so
ask for a forecast of when it will be completed. This focuses the individual
responsible for the work to review other commitments due in the same
period and give a more realistic assessment of the time to complete.
If the forecast completion date is then clearly unacceptable when
compared to the schedule, you have the opportunity to take some prompt
corrective action. You should persuade all your key stage owners to get
into the habit of forecasting performance for their key stages. This proac-
tive approach highlights potential problems before they have a serious
impact on the project, allowing you to focus on corrective action.
In addition, forecasting has two other benefits. First, it improves every-
one’s ability to estimate time to do the work; forecasting is a ‘real-time’
activity, not looking into a crystal ball for the distant future. Second, it
creates real targets for the individual doing the work; any delay beyond an
agreed target cannot be tolerated.
The project status report (see Chapter 8) specifically requests that these
forecasts be given when reporting, along with reasons for any changes to
previous forecast completion dates. Encourage the team to use these
reporting templates, and stress the importance of developing expertise in
accurate forecasting. The analysis for variances at all stages must be a
primary concern for the whole team, which must make sure that effective
corrective action is taken when problems and hold-ups occur.
Good monitoring and tracking builds team confidence, anticipates prob-
lems and prepares future success.
CHECKLIST 21: MONITORING AND TRACKING
The main criteria for effective tracking are:
• Work content – is it to estimates (both time and cost)?
• Measurement – is everyone clear how to measure progress?
• Timescales – are work plans being completed on schedule?
Executing the project work
l
211
212
l
The programme and project processes and techniques
• Quality – are standards being met in accordance with specifications?
• Teamwork – are responsibilities being adhered to?
• Changes – are problem-solving tools being used effectively?
• Stakeholders – are they being kept informed, consulted and involved?
Pay particular attention to:
• having regular contact with team members;
• having regular contact with the customer and project sponsor;
• encouraging rapid feedback of progress and problems;
• dealing with difficulties promptly;
• responding to requests for guidance and help;
• maintaining good communication with team and stakeholders;
• focusing everyone on watching out for risks;
• keeping the project records and file updated;
• issues arising:
– resourcing problems;
– technical problems;
– scheduling problems due to poor estimating;
– responsibility conflicts;
• checking that agreed action plans are implemented effectively;
• keeping everyone informed of project status.
At regular intervals, review the business case to ensure that your project is in
compliance.
TAKING CORRECTIVE ACTION
The monitoring and tracking process identifies the problems that are inter-
fering with the schedule and indicates the need for some action. The anal-
ysis for variance should help to expose the causes of the problem; then use
problem-solving tools to derive an acceptable solution.
Taking corrective action has limited possibilities:
• Rearranging the workload(s) if a milestone is going to be missed – find
others to take some of the tasks to relieve the loading, or even reallo-
cate the tasks.
• Have the relevant team member put more effort into the job – not an
easy option to demand in practice.
• Put additional resources into the job – resource constraints may negate
this option.
Executing the project work
l
213
• Move the milestone date, subject to the stakeholder’s approval and
the possibility of recovering time later in the project – difficult with
activities on the critical path.
• Lower the scope and/or quality of the results demanded by the plan –
only possible with agreement of the customer and sponsor. If doing so
changes the business plan, you must consider whether PST approval
is necessary before proceeding with this option.
Corrective action is normally approached using these options in this order.
Record any assumptions you make when deciding action plans; they
could have significance later! Any corrective action has a cost, and your
obligation is to keep this to a minimum. You may have to seek the
sponsor’s approval to release contingency funds to cover this increased
cost.
Before implementing any corrective actions carry out some simple
checks that you have selected the best option based on the available
information.
CHECKLIST 22: TAKING CORRECTIVE ACTION
Identify the possible options:
• Use cause and effect analysis to identify the problem’s cause.
• Use brainstorming techniques to find the possible solutions.
• Use the expertise of the team and others.
• Identify the most flexible area out of scope, cost or schedule.
• Select the two or three most acceptable solutions.
• Record all assumptions.
• Derive a list of actions whereby you can implement the selected
options.
Before deciding which option to use, check whether:
• the critical path will have changed;
• any individual workloads will be adversely affected;
• any milestones will be subject to slippage;
• any new HIGH risks will be exposed;
• any new issues (ie risks that actually occur) will be exposed.
• any cost overruns will be introduced (do these need approval?);
• any localized schedule slippages are controllable (recoverable later?).
214
l
The programme and project processes and techniques
When selecting the option and setting the action plan, ask:
• What is the priority order of the tasks involved?
• Who is responsible for carrying out the actions?
• Who is monitoring implementation of the action plan?
• What is the target completion date?
• Who must be kept informed of progress?
PROBLEM SOLVING
Project work inevitably is faced with an astonishing range of problems.
Some people regard problems as just a challenge to overcome! In the
project a problem exists if you: 1) are faced with an unacceptable gap
between what you currently have and what you desire as an outcome;
2) are unable to see an immediate way to close or remove the gap.
For example, problems in your project can be about:
• the schedule – work takes longer than planned;
• the effort planned – tasks are not carefully detailed to arrive at accu-
rate estimates;
• resources are not available when promised;
• technical difficulties – technology doesn’t work or is inadequate;
• inadequate training of team members – skills are not available;
• unforeseen absence of resources, equipment or materials;
• inadequate control – monitoring is not working effectively;
• failures in communication leading to misunderstandings and
conflicts.
Much of your time goes into controlling the project schedule and taking
prompt action when something unpredictable happens. If everyone
focuses on risk management, you can hope to minimize the number of
unpredictable events. When they do occur, you are faced with a problem
that is treated as an issue to be resolved. Problem solving is dependent on
a sequence of logical steps (Figure 9.8).
Identifying the problem
It is important to frame the right problem. With the team, agree a state-
ment that clearly describes the perceived problem. This may change later
after data gathering is complete. Getting a consensus agreement of this
statement is important as it must embrace everyone’s perception of the
problem. Avoid pre-judging the causes and reasons for the problem occur-
ring now.
Gathering data
Collect information about the perceived problem. Collecting data helps to
analyse the problem and confirm you are looking at the real problem and
not a symptom of a deeper, hidden difficulty. You have limited time to
resolve the problem and sometimes have to take decisions with informa-
tion of doubtful accuracy. Usually a better solution is possible if some time
is devoted to collecting data using sampling techniques to count or
measure the data needed. Limit sampling to relevant data only and review
any available historical data.
Identifying the real cause of the problem
Cause and effect analysis is a powerful tool for project work. It is easy to
use and focuses everyone on a wide range of possible causes. Examining
Executing the project work
l
215
INITIAL
PROBLEM
STATEMENT
IDENTIFY PROBLEM
GATHER DATA
ABOUT
THE
PROBLEM
CAUSE &
EFFECT
ANALYSIS
REWRITE
OR CONFIRM
THE
PROBLEM
STATEMENT
IDENTIFY
OPTIONS
FOR
SOLUTION
SELECT
BEST OPTION.
PREPARE
ACTION PLAN.
IMPLEMENT
& MONITOR
Figure 9.8 The steps of problem solving
all the possible causes under the four headings allows you to develop the
Ishikawa or ‘fishbone’ diagram, which is based on:
• people;
• process or method;
• materials;
• equipment.
An example is given in Figure 9.9. Start the diagram by drawing a large box
on the right-hand side of a large piece of paper and writing the observed
effect in the box. Then draw a horizontal line out to the left from the box
across the paper. Now add four arrows, one for each of the headings from
which causes are expected to come. Add possible causes under each
heading to the relevant arrow to develop a wide range of possible causes
of the effects observed. Some causes will appear on more than one arrow,
but do not restrict them if you believe they are relevant.
When you feel you have enough causes to work with, eliminate any
causes you are confident are obviously false. Then look for repeated causes
on different arrows and link these together. These are possibly primary
causes and you can then identify secondary causes.
216
l
The programme and project processes and techniques
MILESTONE
12
SLIPPED
5DAYS
PEOPLE
EQUIPMENT
MATERIALS
PROCESS
Poor estimates of
2nd level tasks
Reduced
motivation
Lack of
training
Poor
monitoring
Wrong
metrics
Process
procedures
failure
Completion
criteria of tasks
unclear
Poor attention
to detail
Risks not
identified
Poor
records
Risks not
identified
Performance
inadequate
Breakdowns
Test failure
on run-up
Not enough
capacity
Utilization
factor
W rong control
software loaded
Test
failure
Wrong operator
No experience
Poor
quality
Inadequate
specification
Old stock
Stores
shortage
Purchasing
failure
s
W
Figure 9.9 Example of a ‘fishbone’ diagram
Rewrite the problem statement
After analysis, review the problem statement and rewrite if appropriate,
adding the causes identified:
‘The problem is… which we believe to be caused by…’
This statement should now clearly identify the real problem with the prob-
able causes, and is the basis for seeking a solution.
Seeking a solution
Solutions to problems do not just appear. They are based on a mixture of
opinion, historical experience and facts available. Collect the team
together and use brainstorming to derive possible ways to resolve the
problem. Remember to observe the basic rules:
• Write down everything said, regardless of how apparently stupid.
• Suspend all judgement and criticism.
• Seek quantity, not quality.
When the list of ideas is significant, eliminate duplicates and obvious non-
starters and then agree the list of possible solutions. Try to get three options
as possible solutions to the problem and check the consequences of apply-
ing each. You must seek the ‘best’ option under the prevailing circum-
stances, based on cost, resource implications and effects on the schedule.
Implement the selected option
Develop an action plan to implement the agreed solution and confirm that
responsibilities are clearly defined. Use the steps in Checklist 20 (p 205) for
action planning. Then take the decision and monitor that the outcomes are
the same as expected.
PROGRESS MEETINGS
Regular progress meetings are an essential part of the project control
process. These meetings can take a considerable amount of time if you do
not take specific actions to make them effective. Progress meetings give
you an opportunity to:
• maintain team cohesion;
• inform the team of information and decisions you have received from
the sponsor, customer and other stakeholders;
• review the risk and issue logs;
Executing the project work
l
217
• reinforce the importance of the entire team sharing the responsibility
of meeting the project’s objectives.
Include both core team members and part-time team members in the
meeting. Ask everyone to be prepared to give a short verbal active task
report to the meeting to highlight any tasks that should have been
completed but have not been, with reasons and forecast completion dates.
Project progress meetings are not an opportunity for ego boosting with
a huge display of technical ability. All the good things that have happened
before the meeting are good news, but ancient history. You want to know
about the bad things that have happened which you do not yet know
about:
• tasks that have slipped;
• resource conflict problems;
• equipment failures or absence;
• materials not available;
• milestones slipping;
• technical difficulties.
It is useful to ask key stage owners to prepare a look ahead report covering
the next two reporting periods (the period between progress meetings) to
indicate:
• what needs to be done according to the schedule;
• what will not be done according to the schedule, with reasons and
actions to correct the potential slippage;
• the impact on the project schedule, if any.
Remember that time spent in a meeting is time lost to project work, so
keep your meetings to the point, keep them strictly timed and avoid diver-
sions. Effective meetings only come from good control by the leader. Try to
develop a standard agenda and always have an updated version of the
key stage Gantt chart available for reference. Identify the outstanding
issues but do not try to solve them in the meeting; set up a separate discus-
sion with the relevant people.
Always have a flip chart stand in the meeting room and record agreed
actions on the sheet as they occur, with responsibility and target comple-
tion date. In this way there should be no doubt in the team as to who is
responsible for which actions, and they do not have to wait for the
minutes. The action list (Figure 9.10) is the most important document to
come out of the meeting and is the starting point of the next meeting –
checking that all previous actions are completed.
218
l
The programme and project processes and techniques
Avoid letting the meeting get caught up with a long and detailed examina-
tion of a particular issue and its resolution. If a problem takes more than
five minutes to solve, log it for a separate discussion. It is preferable to
leave issue resolution to a separate meeting with the right people present
and no time constraint.
Involvement of the whole team in progress meetings builds ownership
and good team working. Peer pressure is a powerful enabler, and team
members support each other. With the huge increase in electronic means
of communication it is tempting to rely on these methods and hold virtual
meetings. Don’t fool yourself that these can replace the benefits of face-to-
face communication. Body language sometimes conveys a mountain of
meaning to an alert team and helps you recognize many relationship
problems existing between individuals in the team. Run your progress
meetings to make the best use of everyone’s time.
Yesterday is history – you can’t turn back the clock. Focus the team on what
must be done next.
Executing the project work
l
219
ACTION LIST DATE:
Item Action By: Date
No to take whom to finish
Figure 9.10 Prepare an action list on flip chart sheets
220
l
The programme and project processes and techniques
CHECKLIST 23: PROJECT PROGRESS MEETINGS
Always have a timed agenda and keep the meetings short. Set the start and
finish time – and stick to them. Ask questions to identify:
• What has been completed on time?
• Have there been any outstanding exceptions to the work done?
• What actions agreed earlier are incomplete?
• When will outstanding action plans be complete?
• Which milestones have been completed on time?
• Which milestones have slipped?
• Are action plans in place to correct slippages?
• Have any risks escalated to become issues?
• Are there issues still waiting to be resolved?
• Are any resource capacity changes forecast?
• What work is to be done in the next period?
• Which milestones are due in the next period?
• What problems are anticipated in the next period?
• Are there any risks that could affect the work in the next period?
• Are any problems anticipated with third party contracts in the next
period?
• Are there any team performance problems and issues?
Encourage ideas and suggestions from the team but avoid:
• long verbal reports of what has been done;
• problem solving in the meeting – set up a separate meeting to resolve
problems;
• long debates – they detract from the purpose and cause deviation;
• negotiations – they usually exclude most of those present;
• ‘any other business’ – the biggest time-waster.
PROGRESS REPORTING
At the launch of the project you decided the reporting and communication
processes to use (see Chapter 8 to remind yourself). Throughout the execu-
tion phase of the project, check that these processes are working and
providing the right information for effective control. If the methods are
not working well then agree with the team how to improve them. Do not
put this off until later or the next project. Continuous improvement is
important, so grasp any opportunity to do the job better.
Executing the project work
l
221
Check with your customer and the sponsor that they are getting all the
essential information in the reporting process. You do not want to spend
all your time preparing reports, so do make sure the process provides
essential data only and avoids creating an enormous paper trail. It is very
easy to generate large volumes of paper, particularly when using comput-
ers, and most of this information is never read. Keep reports short using
templates, like the status report given in Chapter 8, but expect to make a
more detailed presentation at a full project review.
Project control is dependent on good communication. It is your obli-
gation to keep the process working always to avoid confusion and
misunderstandings.
Project records
It is essential to maintain accurate project records and encourage everyone
involved to accept this obligation from the outset. Write everything down so
that you remember it! The project file is a source of all relevant information –
current and historical – about the project and must be comprehensively
maintained. This includes all latest issues of standardized records, including
those held on computer systems. Do not rely on the integrity or availability
of computer records alone. The information in the file includes at least:
• the stakeholder list;
• the project organization chart;
• the project brief;
• the scope of work statement;
• the project risk log;
• risk mitigation strategies;
• risk management forms;
• the plan schedules and all updates;
• estimating records;
• key stage responsibility charts;
• activity responsibility charts;
• the issue log;
• issue management forms;
• the project milestone schedule;
• status reports;
• meetings minutes/action lists;
• project change requests;
• project review reports;
• contracts;
• financial reports and documentation;
• customer and supplier information;
• closure checklist;
• handover checklist;
• completion certificate(s);
• evaluation report.
Remember, the project file is a living record of the project and becomes an
invaluable source of data for future projects.
The project log book
If you opened a project log book at the start of the project, use it as a daily
diary of events in the project. Always keep it with you and record events
as they happen. The information you note here will help during the evalu-
ation process after handover to the customer.
ENCOURAGING GOOD TIME MANAGEMENT
Your primary objective in project work is to achieve a successful outcome
that is generally interpreted as delivering the right results using processes
that depend on time. Poor time management causes many of the difficul-
ties you will encounter in managing a project. Some people approach their
work in a structured and well-organized manner but sadly for many their
work output is extremely vulnerable with poor time management.
Remember that you are responsible for managing performance.
Performance is directly related to effort that makes the best use of time to
yield an output. Time is your most valuable resource – if lost or misused, it
is gone forever. For you it is therefore a constraint and you must demon-
strate and encourage everyone involved to use effective time management
principles to maximize this resource.
The most significant problem with people and time management is
actually recognizing and accepting that there is a problem. The problem
can then be regarded as an opportunity to develop effectiveness, reduce
stress and improve the probability of success for your project.
Ask yourself some questions:
• Do you have trouble completing work to deadlines?
• How long can you work at your desk before being interrupted?
• How long can you work at your desk before interrupting yourself?
• How many interruptions (typically) occur each day?
• Have you a procedure for handling interruptions?
• Can you set aside a large block of time for something important?
• How much overtime do you work to get the job done?
• How is incoming mail handled?
• How much time do you spend attending meetings?
222
l
The programme and project processes and techniques
• How tough is it to say no?
• Do you carry out work you could allocate to team members?
• Do you make a fresh ‘to-do list’ every day?
• Is your list prioritized?
• How do you approach detailed work when it is necessary?
• Do you have flexibility in your diary for reactive time?
• Is your routine work made easier by having established procedures?
• Does the team understand your time management principles?
Converting time from a constraint to a manageable resource requires you
to work towards dealing with the impact of these questions. As you are
almost certainly doing some of the project work yourself, the barriers to
effective time management affect you just as they do your team members.
Barriers to effective time management
If you spend too much time doing project work yourself then the conse-
quence is a serious impact of all those things that rob you of valuable time
to control the project. If you are unable to say no, you quickly become
burdened with everyone’s problems and the decisions needed to keep the
project moving at every level. Many things can rob you of time, including:
Executing the project work
l
223
• poor communication;
• unclear responsibility and
authority;
• uncontrolled visitors and
phone calls;
• lack of information;
• too many meetings;
• too many project reviews;
• casual conversations in the
office;
• tracing data and information;
• record keeping;
• changing priorities;
• changes without explanation;
• unnecessary crisis
interventions;
• procrastination;
• executive interference;
• too much attention to detail;
• over-commitment to non-
project activities;
• unclear objectives and project
scope;
• lack of support and
commitment from others;
• lack of project tools;
• confirming resource
commitments;
• bureaucracy;
• politics and power games;
• strong functional boundaries;
• fire-fighting – running from
crisis to crisis;
• excessive paperwork;
• coaching inexperienced team
members;
• inability to assess and take
risks;
• desire for absolute perfection;
• lack of clear organization;
• unclear budget and financial
controls;
• lack of business strategy.
You can probably think of many more, all influencing you to some degree
and many having a serious impact on your effectiveness. The consequence
of these robbers of time is a reduction in the working day for you and your
team.
The productive output for most people is about 80 per cent of the avail-
able time, meaning that everyone really works only a four-day week. If
you want proof, try completing a time log sheet for a week, recording
what you are doing every 15 or 30 minutes of the day. Review the findings
at the end of the week – you may learn something about yourself!
What can you do?
Start by addressing some fundamental issues. You cannot hope to encour-
age others in your team to improve their time management if you display
all the symptoms of hopeless disorganization. Use your time effectively by
the following means:
• Allocate work clearly to the team members.
• Delegate some of your authority where and when appropriate.
• Control your own assigned work to keep it to the project schedule.
• Don’t take on more than you really know you can complete on time.
• Consult as required, but take decisions promptly and explain them.
• Prepare your own ‘to-do list’ and update it every day.
• Set your own priorities and generally stick to them.
• Focus on the areas of high risk in the currently active project work.
• Do the difficult tasks first, or when you can concentrate most effectively.
• Avoid unnecessary memos.
• Refuse to do the low-importance stuff.
• Control the time on the telephone – use a block of time for several calls
together.
• Control the project work by exception, reviewing the plan charts each
day.
• Set out a fixed agenda for project meetings.
• Don’t hold meetings for the sake of getting together; have a clear
purpose.
• Avoid wanderlust – monitor effectively when necessary.
• Focus everyone on the project’s objectives.
• Show your concern for success.
• Turn problems into opportunities to progress and learn.
Regularly ask yourself some simple questions:
• What am I doing that really does not need doing?
• What am I doing that someone else could do just as well as or even
better than me?
224
l
The programme and project processes and techniques
• What am I not doing that will not get done anyway if I avoid doing it?
• What have I done to establish clear priorities and targets for me and
my team?
• Have I confirmed that everyone clearly understands what is expected
of them?
• Have I communicated the current priorities to everyone who needs to
know?
• Does everyone know and understand the consequences of ignoring
the priorities?
• Is everyone aware of the high-risk areas and the triggers to identify
potential issues?
The answers will lead you to improve the way you use time and encour-
age others to adopt the same process. Review your performance at the end
of each day and give yourself a reward if you consider you are improving.
Working in a matrix
Most of the projects in an organization are carried out using people in
different departments, divisions or even at different sites and countries.
How can you possibly hope to manage the team members’ effective use of
time and maintain your project schedule in such an environment?
Some actions you can take to help make everyone’s life more comfort-
able include the following:
• Keep the stakeholder list up to date, particularly with the line
managers of all the resources you are using or plan to use in the
future. These people control the time these resources can give your
project and hold the keys to success. Keep them well informed of the
project’s progress and agree with them how the work is to be broken
down into reasonable chunks for effectiveness. Remind them of the
consequences to the business if the project suffers a slippage.
• One of the most significant time-wasters in project work is the effect of
‘back-tracking’. When the project file is opened to start a piece of work
there is inevitably a need to review what was done the last time some
work was done. The time for this ‘back-track’ is often significant, espe-
cially when you add up the number of times it happens in a project
where people are assigned part-time to your project. Add up the total
time used in this way in a project and it is almost frightening.
• Try to get agreement that project work is always given a sufficiently
large chunk of time to achieve some specific measurable output
without any interruptions. Changes of priority are inevitable in
departments you do not control and putting out the fires in opera-
tional areas of the business are essential activities, but try and get line
Executing the project work
l
225
managers to enter into firm commitments that your work will not
suffer unnecessarily.
• Encourage your team members to work out their own time priorities.
Encourage them to expose and discuss their project work priorities
with their line manager so that interruptions can be minimized and
time used effectively. This helps the line manager to control and map
his or her departmental resource utilization.
• With the agreement of the line manager of each resource, set out
personal targets for each member of the team. Continually review
these targets and take into account the slippages and the actions
implemented to correct the time lost. The plan is dynamic and must be
regularly updated for these changes and distributed to everyone
involved.
• Do not allow slippages to go unreported to you and the line manager,
with missed targets pushing your project into fire-fighting mode. Try
to keep proactive, continually monitoring future resource loadings
and commitments so you can assess the impact on your project. The
most significant cause of failure in a matrix-type project is poor
communication. Use the milestone schedule as a means of communi-
cating to everyone the key dates that must not be missed and check
that everyone understands their obligations to meet these dates. Keep
the responsibility charts updated and reissued and insist that you
need to know immediately if there is any doubt or lack of clarity by
anyone about what is necessary or expected to meet those milestones
on time.
Have regular one-to-ones
Many of the time management problems can be reduced and their impact
minimized with quick identification and realization that there is a
problem. Performance management is an essential part of your job, and it
requires regular contact with all your resources and the stakeholders,
particularly if the latter have responsibility for some of the actual project
work. The one-to-one meetings with each team member are essential to
help you:
• demonstrate your concern and interest in their welfare;
• understand the team members as individuals;
• learn about their experience, skills, interests, beliefs and aspirations;
• discover how they feel about their work;
• find what concerns they have about their work;
• learn what problems they have with the work itself;
• discover what difficulties they have with managing their time effectively;
226
l
The programme and project processes and techniques
• agree personal targets aligned to the plan;
• monitor and discuss performance;
• identify areas for future training and development;
• agree any relevant recommendations to pass to their line manager.
The meetings are meant to be informal, but actions agreed are recorded
and reviewed in the next discussion. Allow 30–45 minutes for each
meeting and decide a frequency at the start of the project. Usually a
monthly dialogue of this type is adequate, but it does depend on the
length of the project. Diarized monthly discussions of this type never
prevent ad hoc discussions and do not take the place of regular monitoring
activities.
Your team members are giving a part of their available capacity to your
work. In many situations their own line managers will not have much
contact with them during this work, beyond some general concerns for
their welfare. You have close and detailed information about each team
member’s performance and this needs to pass back to their line manager
as part of the more formalized performance appraisal process. You can
make an objective contribution to this process only through having a
regular dialogue with each team member. A subsequent poor or indiffer-
ent appraisal review interview may be blamed on you, with quite serious
impact on an individual’s motivation!
Remember that you need a similar regular dialogue with your project
sponsor to sustain your own motivation to achieve success.
CHECKLIST 24: ENCOURAGE
GOOD TIME MANAGEMENT
Self:
• Identify your own time management problems.
• Regard time as a manageable resource, not a constraint.
• Focus on priorities, short and medium term.
• Create effective procedures and adopt them as a habit.
• Identify the barriers and time robbers that affect your work.
• Derive an action plan to eliminate the time robbers.
• Review your progress at regular intervals.
The team:
• Have regular one-to-ones to discuss performance.
• Encourage good time management practices.
Executing the project work
l
227
• Support and give guidance where appropriate.
• Encourage self-evaluation and measurement of improvement.
• Create an open atmosphere where time problems are discussed.
Stakeholders:
• Keep up to date with progress and changes.
• Agree an acceptable breakdown of the work, avoiding too many small
chunks.
• Eliminate the opportunities for excessive ‘back-tracking’.
• Keep the focus on the project objectives and strategic priority.
• React promptly to structural barriers hindering the work.
• Escalate co-operation issues promptly to the project sponsor.
• Have regular one-to-ones with your sponsor.
CONTROLLING THE PROJECT COSTS
The control of expenditure is important to all organizations, yet many do
not measure and monitor the costs of their business projects. The highest
proportion of these costs is frequently associated with the resources used,
and this is regarded as part of the operating costs of the business. Control
of your project is not just about controlling the effort and work outputs,
but should involve cost measurement. It is not just the domain of the
finance department. You are keen to demonstrate success, and this is total
only if you do not exceed the budget.
The data for setting up a budget and gathering expenditure information
exist in every management information system. Often the projects have a
low priority with finance people, who are mainly concerned to produce
business operating statements rapidly each month. In many organizations
the only way you can obtain accurate and up-to-date information on how
much you have spent is to record it yourself. Once you make a commit-
ment to spend some money in your project, it is out of your budget. The
finance report may still not record this commitment until an invoice
appears several weeks or months later. The budget report still shows you
have more money left than is really true!
Of course, cost control is effective only if all costs are measured, includ-
ing the costs of people working on the project. This means that everyone
must record his or her time spent on project work so that this can be
costed, with cost rates derived by the finance people. Cost rates often
include all indirect costs such as rents, heating, lighting, etc for the organi-
zation. If the time data are not collected in a consistent and disciplined
228
l
The programme and project processes and techniques
way then you cannot control the costs accurately. Your monitoring process
must therefore include accurate measurement of:
• the time spent on each task;
• the resources used on all tasks;
• cost of materials (including wastage) used;
• the cost of equipment time used;
• capital expenditure committed (this may be treated separately);
• revenue expenditure committed (this may be included as an overhead
in resource costs).
Normally you make these measurements over a specific period of two or
four weeks or by calendar month.
For effective control you need information on:
• the project budget, a cumulative total divided into accounting
periods;
• the costs incurred in the current accounting period;
• the costs incurred to date from the start;
• the work scheduled for completion according to the plan in the
current period;
• the total work scheduled for completion to date;
• the work actually completed in the current period;
• the total work actually completed to date.
You can use the WBS and the key stage Gantt chart as the basis for collect-
ing these data.
Cost performance
A graph showing cost planned and actual cost may seem to be a simple
solution. An example is shown in Figure 9.11. However, although this
chart can give you useful information, the information is incomplete. First,
it does not tell you whether work planned is getting done. It shows only
the rate of expenditure; expenditure above the planned level could be due
to the work being ahead of schedule. Second, it does not tell you how up
to date the cost data from the finance team are; accounting lag times can be
four to eight weeks behind the current date.
It would seem from Figure 9.11 that the project will ultimately be over
budget, but this chart cannot tell you what to forecast for the costs of the
remaining months of the project. To get an accurate picture you need to
measure the planned and actual costs of the work done. This is done with
earned value analysis.
Executing the project work
l
229
Cost control measures
To use earned value analysis, four essential measures are used for the
control of project costs:
1. BAC – budget at completion
Budget at completion is based on the operating budget developed from
the WBS for the whole project.
2. BCWS – budgeted cost of the work scheduled
At any specific time, the schedule shows that a certain amount of work
should be completed. This is presented as a percentage completion of the
total work of the project at that time. Then:
Scheduled completion × BAC = BCWS
230
l
The programme and project processes and techniques
Jan Feb Mar April May June
Planned, £000’s 100 200 225 200 140 50
900
800
700
600
500
400
300
200
100
0
Actual , £000’s 150 230 250
Cost over/(under) 50 30 25
COST, £000s
PROJECT BUDGET
Project:
Project Manager:
Project Sponsor:
Planned
cumulative cost
Actual
cumulative cost
Jan Feb Mar April May June
Planned, £000s 100 200 225 200 140 50
Actual, 150 230 250
Cost over/(under) 50 30 25
PROJECT BUDGET
Project:
Project Manager:
Project Sponsor:
Planned
cumulative cost
Actual
cumulative cost
£000s
Figure 9.11 Planned versus actual project cost
3. BCWP – budgeted cost of the work performed
At any specified time the actual work measured as complete is compared
with the scheduled amount and the real percentage completion calculated.
Then:
Percentage actual completion × BAC = BCWP
The BCWP is known as the earned value of the work because it is the value
of the work completed.
4. ACWP – actual cost of work performed
The actual cost of work performed at any specified time is the actual cost
incurred for the work. The timing of the actual cost measurement coin-
cides with the percentage completion progress measurement so that the
actual cost can be compared with earned value (BCWP).
Other terms often used include:
5. FTC – forecast to completion
Forecast to completion is a forecast of the cost to be incurred to complete
the remaining work. This may be an extrapolation using an analysis model
or simply the costs to date added to your best estimates of all the costs to
complete the project, eg:
FTC = BAC (ACWP/BCWP)
6. CV – cost variance
Cost variance is the difference between the value of the work performed
and the actual cost for that work, ie:
CV = BCWP – ACWP
If the actual cost is above budget, the CV becomes negative!
7. CV% – cost variance per cent
Cost variance per cent is the cost variance divided by the planned cost, ie:
CV% = CV/BCWP
If CV% is positive, it means that the work was performed under budget,
whereas a negative figure shows that the project is running over budget at
the point of measurement.
8. SV – schedule variance
Schedule variance is the difference between the value of the work
performed and the value of the work that was scheduled to be performed,
at the same measurement point in time, ie:
Executing the project work
l
231
SV = BCWP – BCWS
If the work done is behind schedule, the SV becomes negative!
9. SV% – schedule variance per cent
The schedule variance per cent is the schedule variance divided by the
budgeted cost of work scheduled to be complete at the date considered, ie:
SV% = SV/BCWS
A positive SV% shows that more work has been completed than originally
scheduled by the date considered. A negative SV% is bad news because it
means less work than planned in the schedule has been done.
The variance measures are often used for trend analysis, because of their
sensitivity to changes as the project progresses.
The cost control diagram
A convenient way to show the relationships between the cost measures in
a graphic format is known as the cost control diagram. The ACWP and
BCWP curves in Figure 9.12 are exaggerated to show the relationships
clearly. In practice, both measures tend to cycle with time both above and
below the budget curve (BCWS), and a mean curve is drawn through the
scatter of points. The most accurate way is to tabulate all data using a
spreadsheet program on a computer to calculate and update the data at
regular intervals.
Using a spreadsheet on a computer makes it easier to incorporate any
amendments to the budget resulting from major changes to the project.
The data are then used to generate the diagram automatically for each
reporting period.
The cost control diagram is a good tool for one project. For programmes
and projects with several sub-projects a different charting approach can be
used.
Cost and schedule performance chart
The cost and schedule performance chart shows at a glance the performance
for several projects on one diagram. An example of a radar-type chart is
shown in Figure 9.13.
Plot each project and sub-project as bullets using the values calculated
for SV% and CV%; you can immediately see the relative performance of
all the projects. Sponsors can use this type of performance chart for all the
programmes and projects for which they are accountable. It is also useful
for the PST, to help it effectively take an oversight view of the status of the
organization portfolio of programmes and projects.
232
l
The programme and project processes and techniques