The Risk Management of Safety and Dependability_7 pot
Bạn đang xem bản rút gọn của tài liệu. Xem và tải ngay bản đầy đủ của tài liệu tại đây (384.92 KB, 30 trang )
Managing risk in the design and development process 167
© Woodhead Publishing Limited, 2010
8.2.1 Probability of failure
The probability of failure has to be based on an assessment of the required
operating hours and an acceptable risk of failure. Based on, say, an accept-
able failure of one per cent for an operating period of 1000 hours, the
required failure rate can be found by assuming an exponential life
characteristic:
The probability of failure P = 1 − e
−λt
[8.1]
where λ is the failure rate, t is the operating hours and P is the probability
of failure.
The risk of designing and developing the product to achieve this can be
assessed by comparison with the generic failure rate of a similar product,
which can be found from the equipment generic database given in reference
1 (see appendix). If the required failure rate exceeds that of the generic
failure rate then the product has a high risk of failure unless some new
technology is to be applied. In the case of a new component it may be that
the life characteristic is normal and the assumption of an exponential life
characteristic is too conservative, as will be explained later.
8.2.2 Design risk
The design of any product that is based on proven technology and the use
of well-proven components, either in-house or from established suppliers
will pose very little risk. In other cases the risk can be ranked based on the
degree of research data available and the amount of experience gained in
its application. A suggestion for this is illustrated in Table 8.1.
Table 8.1 Design risk ranking
Completely
new
application
1
Extrapolation
of experience
2
Interpolation
of experience
3
Within
experienced
parameters
4
New technology
with little data
11 2 3 4
Well researched
technology with
adequate data
22 4 6 8
Proven technology
by others
33 6 9 12
Proven in-house
technology
44 8 12 16
168 The risk management of safety and dependability
© Woodhead Publishing Limited, 2010
In the mid-twentieth century there was a well-established electric motor
manufacturer who received a large order from a mining company in Africa
for electric motor-driven mine ventilation fans. Soon after delivery they
received a repeat order. Unfortunately the machines had to be modifi ed
with a new bearing design that failed in operation. The cost of dealing with
this led to their bankruptcy. This is an important lesson for manufacturers
of bespoke machinery. A large bulk order is also a large risk. Beware of
giving too large a discount without allocating more funds for reliability
testing.
Another example is when Rolls-Royce went into bankruptcy in the 1970s.
This was caused by their attempt to develop and use a new material, carbon
fi bre, in the design and development of a new jet engine. It was a failure
and the failed investment caused their demise before they were rescued
and reconstituted.
The case of the Nicoll Highway collapse is an example of ignoring the
risk. In Singapore the Mass Rapid Transport system had to be extended
and the contractor chose the cut and cover method to construct a section
near the Nicoll Highway. This section was to be 33 metres deep and 20
metres wide. With this method, a large cavity, with retaining concrete walls,
is progressively excavated from ground level to tunnel depth, which in this
case was 33 metres. As the cavity gets deeper, the retaining walls are
braced with a strut-waler support system. This system comprises steel bars
(struts), which are connected to bars running parallel to the walls (walers).
The purpose of the walers is to distribute the forces exerted by the struts
along a larger surface area of wall. When work is completed within the
cavity, it is fi lled with soil. The operation was beyond the contractor’s pre-
vious experience, which was limited to shallower excavations. At about
3.30 pm on 20 April 2004, when the cavity had reached a depth of 30
metres, a collapse occurred at part of the excavation site, which was directly
adjacent to the Nicoll Highway. As a result four people were killed and
three injured. As with most accidents a complete failure of risk manage-
ment had occurred; this could have been prevented as adequate warning
of impending failure was ignored. Tackling any project that is outside of
‘in-house’ experience has a high risk of failure and needs careful manage-
ment. In this example, as stated in the investigation report:
2
‘Reliance on
past experience was misplaced and not properly adapted to other localised
incidences in the project. “Standard” but undifferentiated remedial mea-
sures were ineffectual.’
8.2.3 Limiting risk
As shown, it is important to keep within proven experience. Materials and
components should be sourced from established specialist suppliers. Use
Managing risk in the design and development process 169
© Woodhead Publishing Limited, 2010
should be made of the technical support available to ensure that operating
parameters are well within the supplier’s recommendations. The risk is then
limited to any unique material or component that is needed specifi c to the
product. These will need to be proven by rig testing under simulated operat-
ing conditions. Designing and building the complete product should only
be contemplated when the component has been proven to be acceptable.
The component is only proven after testing within the product and fi nally
proven in service with customers.
8.3 Reliability testing
To reduce the probability of unreliable products the concept of a type test
was introduced in the middle of the last century. A type test is a programme
of testing for an agreed period of time. The unit would be tested and modi-
fi ed until a type test could be completed without showing any sign of a
defect after strip examination. The product was then considered ready for
manufacture for operational use. For more certainty the concept of MTTF
was introduced. On completion of a type test, a number of units are then
tested to failure so that a MTTF can be found. Alternatively, for failures
that can be repaired, one or more units are required to be tested to failure,
repaired and tested to failure, and so on to obtain a MTTF. This is obtained
by the sum of the running time to each failure divided by the number of
failures, N:
MTTF = (t
1
+ t
2
+ t
3
+ t
4
. . . + t
n
}/N [8.2]
These are crude procedures; they cannot predict the expected life of the
equipment, for this, a life characteristic has to be found.
8.4 Life characteristics
Life characteristics can vary considerably in shape and size, transiting
between three types.
8.4.1 Normal characteristic
A normal failure characteristic is associated with failure of a component
due to age, as caused by fatigue, wear, corrosion or material degradation.
Due to variations in material properties, manufacturing differences and
operating conditions the time to failure is scattered around a mean (see Fig.
8.1). This shows the probability density function (PDF) of a normal distribu-
tion characteristic curve. This gives the probable number of failures to be
expected at any given time, t. The distribution about the mean can be wide
or narrow and the start can be immediate or there could be a period of no
170 The risk management of safety and dependability
© Woodhead Publishing Limited, 2010
failures. The shape of the distribution can therefore vary considerably. For
a normal distribution the greatest number of failures will be the time at the
apex. This is also the MTTF or average so that the areas under the curve
on each side are the same.
μ=4989.1070, σ=1739.9687, ρ=0.9835
Time, (t)
f(t)
0.000 20000.0004000.000 8000.000 12000.000 16000.000
0.000
3.000E-4
6.000E-5
1.200E-4
1.800E-4
2.400E-4
Data 1
Normal-2P
RRX SRM MED FM
F=20/S=0
Pdf Line
8.1 Normal probability density function (PDF).
Time, (t)
f(t)
0.000 20000.0004000.000 8000.000 12000.00016000.000
0.000
2.000E-4
4.000E-5
8.000E-5
1.200E-4
1.600E-4
Data 1
Lognormal-2P
RRX SRM MED FM
F=20/S=0
Pdf Line
μ=8.5162, σ=0.5876, ρ=0.9862
8.2 Log normal type probability density function (PDF).
Managing risk in the design and development process 171
© Woodhead Publishing Limited, 2010
8.4.2 Lognormal characteristic
Lognormal characteristic is usually associated with a unit mostly made up
of ageing components with varying MTTF. The time to failure is a normal
characteristic slewed to the right. As with a normal distribution the shape
and size can vary considerably. By plotting failures against the Ln of
the time to failure, a normal characteristic can be obtained, hence the title
Lognormal (Fig. 8.2).
8.4.3 Exponential characteristic
Capital equipment is usually specifi ed for continuous operation and a
20-year life. In reality such equipment usually suffers from many failures.
Typically it needs a major overhaul every 25000 hours. In between it suffers
random failures or failures of specifi c items with a more limited life. These
are repaired or replaced and the equipment is returned to service as good
as new. This is the basis and origin of the assumption of an exponential
characteristic, which exhibits a constant failure rate. As a result it is common
practice to assume that all mechanical equipment has an exponential life
characteristic equation and hence a constant failure rate. It is easy to apply
because:
Failure rate
MTTF
λ =
1
[8.3]
Time, (t)
f(t)
0.000 20000.0004000.000 8000.000 12000.00016000.000
0.000
2.000E-4
4.000E-5
8.000E-5
1.200E-4
1.600E-4
Data 1
Exponential-1P
RRX SRM MED FM
F=15/S=0
Pdf Line
λ=0.0002, ρ=0.9274
8.3 Exponential failure probability density function (PDF).
172 The risk management of safety and dependability
© Woodhead Publishing Limited, 2010
NORM\Data 1:
LOGN\Data 1:
LAMDA\Data 1:
Time, (t)
Unreliability, F(t)=1-R(t)
0.000 10000.0002000.000 4000.000 6000.000 8000.000
0.000
1.000
0.200
0.400
0.600
0.800
Unreliability
LAMDA\Data 1
Weibull-2P
RRX SRM MED FM
F=15/S=0
Data Points
Unreliability Line
LOGN\Data 1
Weibull-2P
RRX SRM MED FM
F=20/S=0
Data Points
Unreliability Line
NORM\Data 1
Weibull-2P
RRX SRM MED FM
F=20/S=0
Data Points
Unreliability Line
Normal
Lognormal
Exponential
β=0.9949, η=4664.8522, ρ=0.9542
β=2.1082, η=6470.2755, ρ=0.9854
β=3.3997, η=5534.5120, ρ=0.9787
8.4 Comparisons of different life characteristics.
The probability of failure is then indicated by equation [8.1].
However, the probable failures at any given time, t, is found by differen-
tiating equation [8.1] so that the number of failures, f, for a given time
becomes:
f = λe
−λt
[8.4]
Therefore the exponential life characteristic curve shows that at zero hours
the possible failures will be the value of λ. That is the reciprocal of the
MTTF (Fig. 8.3).
All the above fi gures are based on a MTTF of around 5,000 hours and it
can be seen that the fraction of items that will fail at the same MTTF will
depend on the life characteristic.
Engineers are usually more interested in the probability of failure for a
given operating period. The PDF needs to be converted to a CDF (cumula-
tive density function) by integration. This then shows the total number of
failures up to a given time. The above three different characteristics are
compared in Fig. 8.4.
It can be seen that that for an exponential failure characteristic probably
63% will have failed by the MTTF whereas in the case of a normal or log-
normal distribution only 50% will have failed. If the required mission time
is 1000 hours the difference in the probability of failure is even more
Managing risk in the design and development process 173
© Woodhead Publishing Limited, 2010
marked. This demonstrates that the common assumption of an exponential
characteristic with a constant failure rate is a conservative one that is easy
to apply and so is commonly used. In the development of a new product
more caution is needed to avoid unnecessary time and expense.
3
8.4.4 Weibull
As the exponential characteristic has a defi ned shape with a constant failure
rate there is a universal equation [8.1] that can be applied. There is no
universal equation for the other life characteristics because their shapes can
vary. This problem was solved by Weibull who derived an equation that
could defi ne any type or shape of life characteristic:
P = 1 − e
^
− [(t − γ)/η]
β
[8.5]
where:
• P the probability of failure at time t;
• η is the characteristic life;
• γ is the location factor; it is the time up to which there is no probability
of any failure;
• β is the shape factor.
As can be seen the Weibull equation involves three factors. In most cases
γ, the location factor, is 0 and so the Weibull equation becomes:
P = 1 − e
^
− [t/η]
β
[8.6]
• A normal distribution is characterised by a two-factor Weibull where
the β shape factor is around 4.
• A lognormal distribution is also characterised by a two-factor Weibull
where the β shape factor is around 2.
• An exponential failure distribution is characterised by a one-factor
Weibull where the β shape factor is exactly 1 and η is the characteristic
life, which in this case is the MTTF.
• A reducing failure rate characteristic monitors reliability improvement
and is indicated by a two-factor Weibull where the β shape factor is less
than 1.
These concepts should be used from the onset of a project as a means of
reducing the uncertainty of the product reliability as its development
progresses.
8.5 Reliability target
At the start of any project the expected operating hours, t, and what prob-
ability of failure, P, is acceptable should be considered. This could be usage
174 The risk management of safety and dependability
© Woodhead Publishing Limited, 2010
for the warranty period of one year, and the economically acceptable per-
centage of returns. By assuming an exponential life characteristic the
required failure rate, λ, can be found by inserting the values for P and t in
the equation [8.1]. The probability of failure depends on the user operating
conditions (see Table 8.2). The K factor is the increase in probability due
to adverse conditions. Conversely the required probability of failure under
test bed conditions denoted K = 1 should be reduced accordingly. Note that
these factors are in general for all types of equipment and must be used
with discretion. For example instrumentation and electronic equipment is
much more susceptible to vibration and is usually tested in a vibration-free
controlled environment.
When a component or product obviously has a normal life characteristic,
then the required characteristic life, η, should be found by assuming a β
shape factor of 4 as a rough estimate and inserting the required values of
P and t. The Weibull equation becomes:
ln(1 − P) = −[t/η]
β
so
η = −t/ln(1 − P)
1/β
[8.7]
8.5.1 Type testing
The concept of a type test would appear to be a valid procedure for reli-
ability development. However, by taking into account the reliability target
required some direction can be given to a suitable type test period. It has
been proposed that if a machine completes a type test of hours, T, then its
probable failure rate is:
4
Table 8.2 Environmental stress factors
Environmental conditions K
1
% of component
nominal rating K
2
Ideal, static conditions 0.1 140 4.0
Vibration free, controlled environment 0.5 120 2.0
General purpose, ground based 1.0 100 1.0
Ship, sheltered 1.5 80 0.6
Ship, exposed 2.0 60 0.3
Road 3.0 40 0.2
Rail 4.0 20 0.1
Air 10.0
Managing risk in the design and development process 175
© Woodhead Publishing Limited, 2010
T =
05.
λ
[8.8]
Based on assuming equation [8.1], P = 1 − e
−λt
applies.
However, it is possible to use this to determine the required test running
time, T, if the required failure rate is known. It should also be noted that:
T == =
05
05 05
.
λ
ηMTTF
It is interesting to note that the probability of failure for this time is:
P = 1 − e
−0.5
= 0.3934
This means that if a type test on one unit can be completed in this time
without a failure then there is a reasonable probability that it will meet the
required reliability. Assuming that the type test for other life characteristics
can be based on the same probability of failure, P, then the required type
test period for these can be found based on rearranging the Weibull equa-
tion [8.4]:
(1 − P) = e
^
− [t/η]
β
as P = 0.3934 then 0.6065 = e
^
− [t/η]
β
and taking ln −0.5 = −[t/η]
β
therefore the required test time T = η 0.5
1/β
[8.9]
The assumed shape factors allow an estimate of the life characteristic equa-
tion and a suitable type test period to be estimated. This will be the best
that can be used for planning purposes until reliability testing can be carried
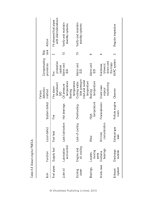
out to fi nd a more applicable one. A worked example is given in Table 8.3.
This shows a signifi cant saving in time and cost to develop a new component
or product with differing life characteristics. The fi gures found are just esti-
mates. They are a glimmer of light into the unknown. The type test running
Table 8.3 Comparison of different life characteristics for probable failure
where: P = 0.1 for t = 1000 hrs
Life characteristic
Shape
factor β
Characteristic life
η = t/(0.1054)
1/β
Type test
T = η 0.5
1/β
Normal 4 1755 1474
Lognormal 2 3080 2178
Exponential 1 9487 = 1/λ 4743
176 The risk management of safety and dependability
© Woodhead Publishing Limited, 2010
hours are just an indication. They can be rounded off. Even if successfully
completed, engineering judgement will be needed as to whether the product
has been developed suffi ciently. Nothing is certain.
8.6 Statistical data
Life characteristics are unique for a given set of circumstances and must be
based on the relevant statistical data. To be truly representative a few thou-
sand data sets are needed. One data set is the time to failure of one item.
As past history is being used to predict the future; forecasts based on any-
thing less than 35 data sets are considered to be unreliable. Firstly the data
sets must be listed in the order of the times to failure. The maximum time
rounded up to a suitable number is then the length of the base, which is
then divided into suitable sectors of time. A histogram is then made of the
number of failures that have occurred in each sector. Figure 8.5 is an
example of a PDF histogram for a normal distribution. The median point
for each sector is marked as shown. A curve for the PDF characteristic can
then be constructed using the median point of each sector as the data points.
From the PDF curve the CDF curve is constructed. The characteristic curve
obtained will be unique and so its equation cannot be predetermined.
However, in the case for an exponential distribution the characteristic is
determined once the failure rate, λ, has been found.
The traditional statistical approach is of no use to engineers. Develop-
ment of a large machine costing many millions of pounds has to depend on
component rig testing and at most one or two full-scale machines. Even in
the development of the Dyson vacuum cleaner, reliability was not assured
0
5
10
15
20
25
30
0 500 1000 1500 2000
Hours
Failures
8.5 PDF histogram for a normal distribution.
Managing risk in the design and development process 177
© Woodhead Publishing Limited, 2010
with its market launch as reported by consumer surveys. Better reliability
prediction techniques need to be adopted.
The assumption of an exponential life characteristic is usually valid for
machines made up of a complex assembly of many different parts and sub-
assemblies. In the reliability development of such equipment it is necessary
to segregate the times to failure of lower life specifi c items for analysis and
development. For example:
• motor car batteries and belt drives;
• gas turbine combustion system;
• diesel engine fuel injection nozzles.
When developed to an acceptable degree they will form part of the general
failure characteristics of the main equipment. However maintenance plan-
ning for these items should be based on the item life characteristic as shown
in Fig. 8.4. To fi nd a life characteristic involves the test of a number of items
to failure. In the case of a repairable machine, it will be necessary to run a
number of test cycles to failure, repair and retest. The accuracy of the results,
however, is a function of the number of data sets available. A dozen or more
is a good target but a minimum should be no less than six. The data sets
must then be ranked in order of the running times to failure. Firstly the
failure criteria must be defi ned so that the data sets that are not applicable
are removed (censored). The result can then be converted to the fraction
of data sets that failed at a given time. This data is still crude and can be
enhanced for better accuracy before analysis.
8.7 Data enhancement
With just a few data sets, when a minimum of 35 is needed, some means to
enhance the data available should be used. Three methods in common use
1
are given as follows.
8.7.1 Mean Order Number
Reliability testing to failure must be in accordance with strict criteria as to
what is a failure. For example, if a new design of machine is being tested,
failure could be defi ned as failure associated with a new sub-assembly.
Failures from other causes are disregarded (censored). Censored data is lost
data with wasted running hours. Mean Order Number (MON) is a method
to make use of the censored data sets. If they had not failed due to other
reasons, then when they might have failed can be considered. As this is
uncertain the procedure is to make an adjustment to the order number in
the following data set so that instead of increasing by one data set the rank
increment is adjusted by:
178 The risk management of safety and dependability
© Woodhead Publishing Limited, 2010
MON MON
MON
ii
i
i
N
S
=+
+
()
−
+
−
−
1
1
1
1
[8.10]
N is the number of data sets; this to include the censored ones as the effect
of them are being considered. Note that N is increased by one because it is
likely a data set with a longer time is possible. S
i
is the number of units
running just before the time of failure, plus one, as explained above. The
censored data sets are still ignored but the qualifi ed failure data set order
(rank) numbers have been adjusted to accommodate some possible failures
that could have occurred.
8.7.2 Median Rank Number
With limited data sets, the data points are points that could have occurred
within the histogram constructed from thousands of data points. Bernard’s
approximation provides a means to convert the data points to Median Rank
Numbers:
Median Rank =
−
+
j
N
03
04
.
.
[8.11]
Where N is the number of data sets and j is the data rank number or MON.
8.7.3 Confi dence limits
A further advantage of using Median Rank Numbers is that there are tables
available to provide 95% and 5% confi dence limits for each data point
based on the number of data points obtained from the test.
1
Median Rank
Numbers are based on the theory that the test results will have a normal
distribution and so the median will be where the results are most likely to
be. The best likely results will be at the 5% limit, usually of no interest, and
the worse likely results will be at the 95% limit, which the reliability engi-
neer needs to consider. The 90% limit will be that at the fi rst quartile of a
normal distribution. Table 8.4 gives the confi dence limits up to 10 data sets.
Note that the values are given in percentages.
8.7.4 Hazard plotting
An alternative procedure to the above is that proposed by Nelson.
5
This
makes use of all the units that are running just before a qualifi ed failure. It
makes use of the concept of a hazard rate where:
S = number of units running just before a qualifi ed failure
h = hazard rate; h(t) = 1/S
Managing risk in the design and development process 179
© Woodhead Publishing Limited, 2010
Table 8.4 Median Rank confi dence limits
Median Ranks (5% confi dence line)
Rank
order
Sample size
12345678910
1 5.0 2.53 1.70 1.27 1.02 0.85 0.73 0.64 0.57 0.51
2 13.54 13.54 9.76 7.64 6.28 5.34 4.64 4.10 3.68
3 36.84 24.86 18.93 15.32 12.88 11.11 9.77 8.73
4 47.29 34.26 27.13 22.53 19.29 16.88 15.00
5 54.93 41.82 34.13 28.92 25.14 22.24
6 60.70 47.93 40.03 34.49 30.35
7 65.18 52.93 45.04 39.34
8 68.77 57.09 49.31
9 71.69 60.58
10 74.11
Median Ranks (95% confi dence line)
Rank
order
Sample size
12345678910
1 95.00 77.64 63.16 52.71 45.07 39.30 34.82 31.23 28.31 25.89
2 86.46 86.46 75.14 65.74 58.18 52.07 47.07 42.91 39.42
3 98.30 90.24 81.07 72.87 65.87 59.97 54.96 50.69
4 98.73 92.36 84.68 77.47 71.08 65.51 60.66
5 98.98 93.72 87.12 80.71 74.86 69.65
6 99.15 94.66 88.89 83.12 77.76
7 99.27 95.36 90.23 85.00
8 99.36 95.90 91.27
9 99.43 96.32
10 99.49
Cumulative hazard rate at time
t
n
= H(t) = 1/S
1
+ 1/S
2
+ 1/S
3
+ . . . 1/S
n
[8.12]
So that the probability of failure:
F(t) = 1 − e
^
[−H(t)] . . . or P [8.13]
The values found from the Nelson procedure are used as an alternative to
the use of Median Ranks and also takes into account the running hours
accumulated from the censored data sets.
180 The risk management of safety and dependability
© Woodhead Publishing Limited, 2010
8.8 Test data processing
Having recorded some raw data sets that are listed as they occur, it will
then be necessary to arrange them in rank order. That is to rearrange them
based on the time to fail, with the shortest time fi rst, as shown in Table 8.5.
F indicates a failure and C indicates a censored item. Based on this data it
is necessary to predict the probability of failure for an operating period of
200 hours.
8.8.1 Crude analysis
Crude analysis is used to fi nd the MTTF using equation [8.2] and to assume
an exponential life characteristic. There are only fi ve true failures recorded
with their running hours and so the MTTF is:
MTTF = (670 + 1504 + 3200 + 4200 + 5400)/5 = 2995;
so as 1/MTTF = λ then:
λ is 334 × 10
−6
Using equation [8.1] the probability of failure for 200 hours can be found:
P = 1 − e
^
− (334 × 10
−6
) × 200 = 1 − 0.935 = 0.064
8.8.2 Weibull analysis
Using the same raw data in rank order as shown in Table 8.5, Weibull analy-
sis requires the data to be converted to cumulative failure data. This is given
in Table 8.6, with only the true failure data sets shown. The cumulative
failure rank increases from 10% to 100% when all have failed. Common
Table 8.5 Raw data rearranged in rank order
Raw test data
Data set 1 234567Failures
Status Failure F F C C F F 5
Hours 1504 3200 5400 2250 960 4200 650 Failure hours
t 1505 3200 5400 0 0 4200 650 14955
Rearranged in rank order
Ranked 1 234567
Status Failure C F C F F F
Hours 670 960 1504 2250 3200 4200 5400
Managing risk in the design and development process 181
© Woodhead Publishing Limited, 2010
sense indicates that if more tests were to be carried out the failure at 5400
hours cannot be the last. This is the logic behind the Bernard’s approxima-
tion equation [8.11] and this has been applied with the results shown as the
Median Rank. Bernard’s equation gives the Median Rank as a fraction. This
needs to be converted to a percentage for plotting on to the Weibull graph
paper. From this the Weibull factors can then be found:
β = 1.2 , η = 3000 hours and a probability of failure of 0.03 for a time of
200 hours. These results are similar to those obtained using the Nelson
procedure of hazard plotting as seen in Table 8.10 below.
The application of MON on censored data sets and the adjustment to
Median Rank for the same raw data is shown in Table 8.7.
Note the following:
• Only the failure data sets have MON.
• N + 1 = 8, where N = 7 is the number of data sets both censored and
failed.
• S is the number running at the time of failure.
• For Median Ranks as N = 7, so N + 0.4 = 7.4.
The Median Rank gives the CDF and so gives the value of P the probable
failure at time t (see Table 8.8). Although there are seven ranked events
there are only fi ve data sets as two have been censored. The ranks have
been revised accordingly with the values for the confi dence limits taken
from Table 8.4 based on a sample size of fi ve.
8.8.3 Test data processing by the Nelson procedure
Using the raw data in rank order as given above, Table 8.9 shows the Nelson
procedure processed data. Note that h(t) = 1/S and H(t) = Σh(t) equation
[8.12] and 1 − R = P equation [8.13] (see paragraph 8.7.4).
8.8.4 Use of Weibull graph paper
By plotting the processed data sets on Weibull graph paper
6
the value of
the Weibull factors can be found. This is shown in Fig. 8.6 on page 184 with
Table 8.6 Weibull crude data sets
Hours 670 1504 3200 4200 5400
Failures 1 1 1 1 1
Rank j 1234 5
Cumulative 20 40 60 80 100
Median Rank 12.9 31.5 50 68.5 87
182 The risk management of safety and dependability
© Woodhead Publishing Limited, 2010
data plotted from Table 8.8. Note that the graph paper gives P as a percent-
age and the chosen scale for time starts at 100 hours. The shape factor
β is found by drawing a line parallel with the line through the data
points starting at the intersection of where the η line meets the y axis. The
value for β is then read off the x scale at the top of the graph paper. P is
Table 8.7 Data processed to Mean Order Number and to Median Rank
Ranked data sets converted to MON equation [8.10]
Ranked Time
Data
set Status 1 + S 8 − MON
i−1
8
1
1
MON
i
S
−
+
MON
i
1 670 1 Failure 8 8 1
2 960 Censored – –
3 1504 2 Failure 6 7 1.1666 2.1666
4 2250 Censored – –
5 3200 3 Failure 4 5.8333 1.458 3.6246
6 4200 4 Failure 3 4.3754 1.458 5.0830
7 5400 5 Failure 2 2.9169 1.458 6.5414
MON converted to Median Ranks equation [8.11]
Ranked Time
Data
set Status MON
i
(j)j − 0.3
Median
Rank (P)
1 670 1 Failure 1 0.7 0.0945
2 960 Suspended
3 1504 2 Failure 2.1666 1.8666 0.252
4 2250 Suspended
5 3200 3 Failure 3.6246 3.3246 0.4492
6 4200 4 Failure 5.0830 4.783 0.6463
7 5400 5 Failure 6.5414 6.2414 0.8434
Table 8.8 Median Rank confi dence limits
Rank
revised Time
Median
Rank (P)
Median Rank
percentage 95% limit 5% limit
1 670 0.0945 9.45 45.07 1.02
960
2 1504 0.252 25.2 65.74 7.64
2250
3 3200 0.4492 44.92 81.07 18.93
4 4200 0.6463 64.63 92.36 34.26
5 5400 0.8434 84.34 98.98 54.93
Managing risk in the design and development process 183
© Woodhead Publishing Limited, 2010
Table 8.9 Nelson procedure processed data
Ranked Time S Status h(t) H(t) R = e
^
[−H(t)] P
1 670 7 Failure 0.1428 0.1428 0.8669 0.1331
2 960 Suspended
3 1504 5 Failure 0.2 0.3428 0.7098 0.2902
4 2250 Suspended
5 3200 3 Failure 0.3333 0.6761 0.5086 0.4914
6 4200 2 Failure 0.5 1.1761 0.3085 0.6915
7 5400 1 Failure 1 2.1761 0.1135 0.8865
also indicated for any required t. However, by substituting the values of the
factors found into the Weibull equation the relationship between P and t is
given for the indicated life characteristic. In a similar manner the data
obtained from the Nelson procedure can be plotted on the special graph
paper so that the Weibull factors can be found in the same way. The summary
of the results are shown in Table 8.10. From the plotted results shown in
Figure 8.6 the fi ve per cent confi dence probability of failure at 200 hours is
only a fraction of one per cent, which is much lower than needed. As the
highest probability of failure should be considered, only the 95% confi -
dence limit is shown. The 90% confi dence limit obtained by software is also
shown for comparison.
8.9 Test data analysis
When only limited test results are used for reliability prediction the results
are just a glimmer in a crystal ball. As the number of data sets increase
Table 8.10 Summary of results
Weibull
parameter
Crude
analysis
Median
Rank
90%
confi dence
95%
confi dence Nelson
Characteristic
life η
2991 3945 2221 1833 3530
Shape factor β Assumed
= 1
1.324 1.006 0.945 1.224
Location
constant γ
00000
P at t = 200
hours
0.067 0.02 0.085 0.116 0.03
Life
characteristic
Exponential Lognormal Exponential Improving Lognormal
184 The risk management of safety and dependability
© Woodhead Publishing Limited, 2010
6.0
4.0
3.0
2.0
1.6
1.4
1.2
1.0
0.9
0.8
0.7
0.6
0.5
99.90
99.00
95.00
90.00
80.00
70.00
60.00
50.00
40.00
30.00
20.00
10.00
5.00
3.00
2.00
1.00
0.50
0.30
0.20
0.10
200 500 1000 5000
β
η
8.6 Median Rank Weibull data plot (source: www.weibull.com).
Managing risk in the design and development process 185
© Woodhead Publishing Limited, 2010
towards 35 the degree of uncertainty will diminish. The cost of increased
testing, however, has to be weighed against the consequences due to uncer-
tainty. Some of the uncertainty can also be reduced by engineering judge-
ment. The results of the Weibull analysis in the above example can be used
to illustrate this. The table shows that the results could indicate a life char-
acteristic anywhere from improving to a lognormal. It also shows that a
crude analysis gives an approximation but the assumed life characteristic
could be in error. It also shows that on average the chance of failure is two
per cent but in the worst case it could be 12%. The probability of failure at
any time, t, can be read off the graph. As the Weibull factors have also been
found, the probability of failure can also be found by solving the Weibull
equation [8.5].
The type of failures being experienced can enable an engineering judge-
ment to be made. If they are all due to age/wear then a lognormal charac-
teristic is most likely. If the failures are a mixture of random components
from a complex assembly of parts then it could be exponential. Whether
the test results are acceptable will depend on the acceptable probability of
failure for the required operating time and the acceptable risk of failure. If
a lognormal life characteristic were expected, then the adoption of the
Nelson result would seem to be reasonable. As already stated the failure
modes found and engineering knowledge of the product should be used
to give guidance on what to believe. If a decision to go into production is
taken, it must be taken on the basis of sound engineering judgement. A
programme of product development based on warranty data feedback
should then be put in place as a basis for further reliability improvement if
found necessary.
8.10 Warranty analysis
Warranty data analysis requires a record of the number of items in service
for a given number of failures for a set period of operation. As the equip-
ment is outside the direct control of a test engineer, to obtain the data sets
needed requires some thought. In the case of consumer goods, insisting that
the date of purchase is provided with every warranty claim does this. Major
running equipment is often fi tted with running hour recorders so that the
time to failure is known. It is also important to ensure that data relating to
any new failure mode found in service is censored for specifi c analysis.
An example is a situation where items are shipped and put into service,
where no censoring is required. The data regarding the items in service and
the related failures up to six months from commencement are given in Table
8.11. From the table the number of units in operation for a given period
and the number of failures experienced in the time can be obtained. In this
way the percentage of failures for each running month period can be found
186 The risk management of safety and dependability
© Woodhead Publishing Limited, 2010
Table 8.11 Failure data up to June
Month
shipped
Number
shipped
Total in
service
Failure in each month
Jan Feb March April May June
Jan 100 100 1 2 3 5 4 3
Feb 120 220 0 2 2 3 3
March 130 350 1 2 3 0
April 150 500 0 2 1
May 150 650 1 0
June 200 850 1
Table 8.12 Warranty failure data sets
Month in
operation, t
Number in
operation
Number
of failures
Percentage
failure in
the month
Percentage
cumulative
failures (P)
1 850 4 0.47 0.47
2 650 8 1.23 1.70
3 500 9 1.80 3.50
4 350 8 2.28 5.78
5 220 7 3.18 8.96
6 100 3 3.00 11.96
(the f(t)). From these the percentage cumulative failures (the F(t)) can be
derived. This is shown in Table 8.12. The data sets can be plotted on Weibull
graph paper. P is plotted against t, with the timescale being in months. The
Weibull factors for the life characteristic taken from the graph shows a
shape factor of 1.8 and a characteristic life of 17 months. This will also
enable the probable warranty returns for the future to be predicted and
will indicate if further reliability improvement is needed.
8.11 Summary
The design and production of any new product for the market has risks that
must be managed. How the risks can be identifi ed and managed has been
explained. The use of Weibull analysis for the planning, reliability develop-
ment and testing of the product to ensure its success together with proce-
dures to monitor its reliability in service has been provided. The procedure
for analysis using Weibull graph paper has been given. However, it should
be noted that Weibull software packages are available that are convenient
Managing risk in the design and development process 187
© Woodhead Publishing Limited, 2010
to use if large data sets are involved. Microsoft Excel also have Weibull and
other statistical functions available for spreadsheet use.
8.12 References
1 moss, t. r. (2005) The Reliability Data Handbook, J Wiley, ISBN 1 86058 444 6
2 committee of inquiry, Nicoll Highway Collapse, Issue 5 May 2005, Ministry of
Manpower, ref 20050513
3 wolfram, j. (2006) ‘On assessing the reliability and availability of marine energy
converters: the problems of a new technology’, I Mech E proceedings Part O, The
Journal of Risk and Reliability, vol 200, June, pp 55–68
4 byant, r. (2007) ‘Estimation of component failure rates for use in probabilistic
safety. Assessment in cases of few or no recorded failures’, The Journal of the
Safety and Reliability Society, vol 27, No 1
5 nelson, w. (1996) ‘Hazard plotting for incomplete data plotting’, Journal of
Quality Technology, I, 27–52
6 Weibull plotting paper, download from www.weibull.com
© Woodhead Publishing Limited, 2010
188
9
Asset integrity: learning about the cause and
symptoms of age and decay and the need
for maintenance to avoid catastrophic failures
Abstract: The safety and reliability of any facility is an asset that has
to be managed to ensure its integrity. Integrity means to perform as
intended. Where failures have disastrous consequences, equipment must
be taken out of service before they occur. This requires the means of
detecting and predicting residual life expectancy. It also requires an
understanding of the mechanisms that cause failure and the ways in
which failure can be predicted.
Key words: assets, management, strategy, breakdown, planned, hidden
failure, opportunity, risk-based inspection, condition monitoring,
vibration, probes, accelerometers, velocity pickup, criteria, spectrum,
effi ciency, detection, materials, temperature, creep, thermal, fatigue,
corrosion, erosion, stress, pitting, galvanic, cathodic, residual life, risk
assessment, spare parts, labour, service contracts.
9.1 Introduction
Although facilities may be designed for a 25-year life or even longer, it
does not mean that everything will last that long. Bridges fall down,
motorways wear out, trains stop due to signal failure, water mains burst,
electricity supplies fail, and these are just a few examples. Facilities com-
prise buildings, plant and equipment; each made up of myriad parts and
components with individual life characteristics, some long and some short.
Everything has a fi nite life and fail due to a variety of reasons as shown in
Fig. 9.1.
When they no longer function they have to be replaced or repaired. To
enable this, in the planning of any new facility, provision has to be made
for:
• facilities for access and maintenance space;
• space and access for removal and replacement of equipment;
• installation to be designed to allow testing in situ;
• lifting facilities for assembly and disassembly;
• storage and transport of tools and spare parts;
Cause and symptoms of age and decay 189
© Woodhead Publishing Limited, 2010
• offi ces and workshops for maintenance staff;
• fi rst aid and rescue facilities;
• fi refi ghting facilities.
When things break down, production, services or operations are disrupted;
they become unavailable and are no longer able to generate income. They
need to be repaired and returned to service as quickly as possible.
At the design stage a spare item has to be installed for any equipment
that causes an unacceptable disruption in availability. However, this can be
very costly and must be balanced against the lost revenue and goodwill of
a breakdown. In other cases, instruments for condition monitoring will need
to be installed as a safeguard against catastrophic failure or to provide
advance warning of major repair works. Any advance warning of a failure
provides time for the marshalling of the resources needed to ensure rapid
return to service.
The integrity of any asset must therefore depend on the measures pro-
vided in its design to ensure its dependability. Thereafter management of
the asset has the objective of:
• ensuring its safety and dependability;
• making fi nancial provision for future major repairs;
• optimising the resources needed for maintenance;
• minimising the time to return to service of any failure;
• mitigating possible obsolescence and providing for fi nal disposal.
Modes of failure
Deformation
Seizure
Movement
Degradation
Fracture
Vibration, etc
Environmental factors
Ageing
Erosion
Corrosion
Time
Load, force, etc
Chemical, biological, radiation, electrical stray currents
Pressure, temperature
Indentation,
bending, etc
Fatigue, etc
9.1 Failure mechanisms.
190 The risk management of safety and dependability
© Woodhead Publishing Limited, 2010
These are interdependent: major civil works need to be fi nanced, lack of
spare parts or manpower affects the time taken to return to service, and
that then affects its dependability.
9.2 Maintenance strategies
Maintenance strategies need to be chosen based on assessing the risk and
the consequence of failure. This requires a review of the total plant
or machine so that all failure modes are identifi ed. In doing this it is
helpful to subdivide the plant into production units or the machine into
sub-assemblies. Once all the failure modes are identifi ed, then the conse-
quences for each failure can be defi ned. This will enable the failures to be
ranked in accordance with their impact on safety and cost. Cost could be
lost output and/or high cost of repair. Failure of a machine or plant requires
a maintenance response for it to be returned to operation. This requires
manpower and material resources. The aim is to arrive at an optimum
balance of all these factors. The procedure can be formalised with the steps
shown in Table 9.1. Note that Pareto, an Italian engineer and statistician,
showed that where there are multiple tasks there are only a small minority
that have the most effect. The task is to identify them, as this gives the
maximum return for the least effort. Fault Tree Analysis (FTA), a method
to identify the root causes of failure, can be used.
Having identifi ed the failure modes, they then need to be categorised and
ranked in accordance with their consequences. Obviously those that have
an impact on safety are critical together with those with the highest impact
on dependability (causes the most downtime) and cost. These are shown in
Table 9.2.
The selection of a suitable maintenance strategy must then be based on
the need to mitigate or avoid the risk of the consequences. Operating
requirements differ from industry to industry and these differences also
affect the required period of availability and the scheduling of maintenance.
The various maintenance strategies to be considered are as follows.
9.2.1 Breakdown maintenance
Breakdown maintenance is applicable for equipment where failure is not
critical to the safety and dependability of the facility. Usually where there
is adequate redundancy in a system and the increased risk during the down-
time of one item is acceptable.
9.2.2 Planned (preventative) maintenance
Planned (preventative) maintenance is required for equipment that is
dependability or safety critical that is subject to deterioration in service.
Cause and symptoms of age and decay 191
© Woodhead Publishing Limited, 2010
Table 9.1 Steps in analysis
Steps required Action needed
1 System defi nition Acquisition of data on the operating and
reliability requirements, develop block
diagrams for analysis
2 Operating envelope Identify intended purpose, operating limits for
normal and all expected transient conditons
3 Identify the maintenance-
signifi cant items
Using FTA and Pareto analysis as needed. Find
the items whose failure will signifi cantly
threaten safety or increase cost due to lost
production or have a high cost of repair
4 Identify the failure
modes
Using FMEA. Find the causes of failure and how
they could be detected
5 Select the maintenance
strategy
For each failure mode decide what can be done
to reduce its likelihood of occurrence, or to
mitigate its consequences
Implementation
1 The formation of a task list into a workable plant-wide schedule with
organisational responsibilities, manpower loading and material
requirements
2 Implementation of the work schedule with sustained feedback of in-service
data for periodic review and update
Table 9.2 Consequence categories
Category Description
1 Hidden failure Not detected during normal operation but affects
safety and/or reliability. Applies to non-operating
standby equipment and non-fail-safe protective
equipment
2 Safety/environmental
consequences
Failures that cause loss of function or secondary
damage that could have a direct impact on
safety or the environment
3 Operational
consequences
Failures that have a direct adverse effect on
operational capability
4 Non-operational
consequences
Failures that do not affect operations, for example
where there are installed redundancies
Based on operating experience scheduled inspection and the repair or
replacement of critical components can reduce costs and avoid a major
shutdown or a risk to safety. This is typically applied in the case of aircraft,
vehicles, elevators, passenger lifts, public electrical and gas installations,
steam boilers, etc.