Controlling strategy management and performance measurement_5 potx
Bạn đang xem bản rút gọn của tài liệu. Xem và tải ngay bản đầy đủ của tài liệu tại đây (634.22 KB, 21 trang )
number of parking spaces and market demographics, later proved to
have an influence on profitability, the aggregated index used for deci-
sion-making lacked any predictive ability.
Based on strategic data analysi s, the company was able to justify
marketing, training, and other initiatives that were previously difficult
to justify on a financial basis. Strategic initiatives began to be focused on
activities with the largest economic benefits (e.g., employee turnover
and injuries), and the results provided a basis for selecting valid per-
formance indicators for assessing store performance.
Target setting in a computer manufacturing firm
Any control system requires targets to determine success or failure.
Many companies we studied followed a ‘more is better’ approach
when setting targets for non-financial measures such as customer sat-
isfaction. However, this assumption causes serious problems when the
relation between the performance measure and strategic or economic
performance is characterized by diminishin g or negative returns. With-
out some analysis to determine where or if these inflection points occur,
companies may be investing in improvement activities that yield little or
no gain.
Such was the case with a leading personal computer manufacturer.
Like many firms, the company used a five-point scale (1 ¼ very dissat-
isfied to 5 ¼ very satisfied) to measure customer satisfaction. One of the
primary assumptions behind the use of this measure was that very
satisfied customers would recommend their product to a larger number
of potential purchasers, thereby increasing sales and profitability. Con-
sequently, the performance target was 100 per cent of customers with a
satisfaction score of 5.
This target was not supported by subsequent data analysis. Figure 4
shows the association between current customer satisfaction s cores and
the number of positive and negative recommendations in the future
(obtained through follow-up surveys). The analysis found that the key
distinction linking satisfaction scores and future recommendations was
whether customers were very dissatisfied, not whether they were very
satisfied. Customers giving the company satisfaction scores of 1 or 2 were
far more likely to give negative recommendations and far less likely to
give positive recommendations (if at all). Between satisfaction scores of 3
to 5 there was no statistical difference in either type of recommendation.
FROM STRATEGIC MEASUREMENT TO ANALYSIS 93
The appropriate target was not moving 100 per cent of customers into the
5 (very satisfied) catego ry, but removing all customers from the 1 or 2
categories, with the greatest po tential gain coming from eliminating very
dissatisfied customers (1 on the survey scale).
Value driver analysis in a financial services firm
One of the primary criticisms of traditional accounting-based control
systems is that they provide littl e information on the underlying drivers
or root causes of performance, making it difficult to identify the specific
actions that can be taken to improve strategic results. Yet many non-
financial measures used to assess strategic results are also outcome
measures that shed little light on lower-level performance drivers. For
example, a number of companies in our study found significant rela-
tions between customer or employee satisfaction measures and finan-
cial performance. But telling employees to ‘go for customer satisfaction’
is almost like saying ‘go for profits’—it has little practical meaning in
0
0.2
0.4
0.6
0.8
1
Mean number of positive
recommendations
123 45
Prior wave self-reported customer satisfaction
0
0.2
0.4
0.6
0.8
1
Mean number of negative
recommendations
12345
Prior wave self-reported customer satisfaction
1 = very dissatisfied;
5 = very satisfied
1 = very dissatisfied;
5 = very satisfied
Figure 4 Computer manufacturer study linking customer satisfaction scores to
subsequent product recommendations
94 CHRISTOPHERD.ITTNER&DAVIDF.LARCKER
terms of the actions that actually drive these results. The question that
remains is what actions can be taken to increase satisfaction. Unfortu-
nately, many of these companies did not conduct any quantitative or
qualitative analyses to help managers understand the factors that im-
pact customer satisfaction or other higher-level non-financial measures.
As a result, managers frequently became frustrated because they had
little idea regarding how to improve a key measure in their performance
evaluation. More importantly, the selection of action plans to improve
higher-level measures continued to be based on management’s intu-
ition about the underlying drivers of non-financial performance, with
little attempt to validate these perceptions.
Strategic data analysis can help uncover the underlying drivers of
strategic success. A major financi al services firm we studied sought to
understand the key drivers of future financial performance in order to
develop their strategy and select action plans and investment projects
with the largest expected returns. In this business, increases in customer
retention and assets invested (or ‘under management’) have a direct
impact on current and future economic success. What this company
lacked was a clear understanding of the drivers of retention and assets
invested. Initial analysis found that retention and assets invested were
positively associated with the customer’s satisfaction with their invest-
ment adviser, but not with other satisfaction measures (e.g. overall
satisfaction with the firm). Further analysis indicated that satisfaction
with the investment adv iser was highly related to investment adviser
turnover—customers wanted to deal with the same person over time.
Given these results, the firm next sought to identify the drivers of
investment adviser voluntary turnover. The statistical analysis examin-
ing the drive rs of adviser turnover is provided in Figure 5. The level of
compensation and work environment (e.g. the availability of helpful and
knowledgeable colleagues) were the strongest determinants of turnover.
These analyses were used to develop action plans to reduce adviser
voluntary turnover, and provided the basis for computing the expected
net present value from these initiatives and the economic value of
experienced investment advisers.
Predicting new product success in a consumer products firm
In the absence of any analysis of the relative importance of different
strategic performance measures, companies in ou r study adopted a
FROM STRATEGIC MEASUREMENT TO ANALYSIS 95
variety of approaches for weighting their strategic performance meas-
ures when making decisions. A common method was to subjectively
weight the various measures based on their assumed strategic import-
ance. However, like all subjective assessments, this method can lead to
considerable error. First, it is strongly influenced by the rater’s intuition
about what is most important, even though this intuition can be incor-
rect. Second, it introduces a strong political element into the decision-
making process. For example, new product introductions were a key
element of a leading consumer products manufacturer’s strategy. To
support this strategy, the company gathered a wide variety of measures
on product introduction success, including hypothesized leading indi-
cators such as pre-launch consumer surveys, focus group results, and
test market outcomes, as well as lagging indicators related to whether
the new product actually met its financial targets. However, the com-
pany never conducted any rigorous analysis to determine which, if any,
of the perceived leading indicators were actually associated with greater
probability of new product success.
An internal study by the company found that this process caused a
number of serious problems. First, by not linking resource allocations to
those pre-launch indicators that were actually predictive of new product
success, resources went to the strongest advocates rather than to the
Level of compensation
Challenge/achievement
Workload/life balance
Senior leadership
Work environment
Investment advisor turnover
Customer satisfaction
Assets invested
Customer retention
+++
++
+
++
+++
−
+
+
Notation: +/− refers to a strong statistical positive/negative link;
more +/− signs reflect stronger statistical associations
(precise numbers are not reported at company request)
Figure 5 Analysis linking employee-related measures to customer purchase
behaviour in a financial services firm
96 CHRISTOPHER D. ITTNER & DAVID F. LARCKER
managers with the most promising products. Second, because the lead-
ing indicators could be utilized or ignored at the manager’s discretion
and were not linked to financial results, the managers could accept any
project that they liked or reject any project that they did not like by
selectively using those measures that justified their decision. These
consequences led the company’s executives to institute a data-driven
decision process that used analysis of the leading indicator measures to
identify and allocate resources to a smaller set of projects offering the
highest probability of financial success.
Barriers to strategic data analysis
Given the potential benefits from strategic data analysis, why is its use
so limited? And, when it is performed, why do many firms find it
extremely difficult to identify links between their strategic performance
measures and economic results? Our research found that these ques-
tions are partially explained by technical and organizational barriers.
Technical barriers
Inadequate measures
One of the major limitations identified in our study was the difficulty of
developing adequate measures for many non-financial performance
dimensions. In many cases, the concepts being assessed using non-
financial measures, such as management leadership or supplier rela-
tions, are more abstract or ambiguous than financial performance, and
frequently are more qualitative in nature. In fact, 45 per cent of BSC
users surveyed by Towers Perrin (1996 ) found the need to quantify
qualitative results to be a major implementation problem. These prob-
lems are compounded by the lack of standardized, validated perform-
ance measures for many of these concepts. Instead, many organizations
make up these measures as they go along.
The potential pitfalls from measurement limitations are numerous.
One of the most significant is reliance on measures that lack statistical
reliability. Reliability refers to the degree to which a measure captures
random ‘measurement error’ rather than actual performance changes
FROM STRATEGIC MEASUREMENT TO ANALYSIS 97
(i.e. high reliability occurs when measurement error is low). Many com-
panies attempt to assess critical performance dimensions using simple
non-financial measures that are based on surveys with only one or a few
questions and a small number of scale points (e.g. 1 ¼ low to 5 ¼ high).
1
Statistical reliability is also likely to be low when measures are based on a
small number of responses. For example, a large retail bank measured
branch customer satisfaction each quarter using a sample of thirty
customers per branch. With a sample size this small, only a few very
good or very bad responses can lead to significantly different satisfaction
scores from period to period. Not surprisingly, an individual branch
could see its customer satisfaction levels randomly move up or down
by 20 per cent or more from one quarter to the next.
Similarly, many companies base some of their non-financial meas-
ures on subjective or qualitative assessments of performance by one or a
few senior managers. However, studies indicate that subjective and
objective evaluations of the same performance dimension typically
have only a small correlation, with the reliability of the subjective evalu-
ations substantially lower when they are based on a single overall rating
rather than on the aggregation of multiple subj ective measures (Hene-
man 1986; Bommer et al. 1995). Subjective assessments are also subject
to favouritism and bias by the evaluator, introducing another potential
source of measurement error. The retail bank, for example, evaluated
branch managers’ ‘people-related’ performance (i.e. performance man-
agement, teamwork, training and development, and employee satisfac-
tion) using a superior’s single, subjective assessment of performance on
this dimension. At the same time, a separate employee satisfaction
survey was conducted in each branch. Subsequent analysis found no
significant correlation between the superior’s subjective assessment of
‘people-related’ performance and the employee satisfaction scores for
the same branch manager.
A common response to these inadequacies is to avoid measuring non-
financial performance dimensions that are more qualitative or difficult
to measure. The Conference Board study of strategic performance
measurement (Gates 1999), for example, found that the leading road-
block to implementing strategic performance measurement systems is
avoiding the measurement of ‘hard-to-measure’ activities (55 per cent
of respondents). Many comp anies in our study tracked the more quali-
tative measures, but de-emphasized or ignored them when making
1
For discussions of issues related to the number of questions, scale points, or reliability
in performance measurement, see Peter (1979) and Ryan et al. (1995).
98 CHRISTOPHER D. ITTNER & DAVID F. LARCKER
decisions. When we asked managers why they ignored these measures,
the typical response was lack of trust in measures that were unproven
and subject to considerable favouritism and bias. Although these re-
sponses prevent companies from placing undue reliance on unreliable
measures or measures that are overly susceptible to manipulation, they
also focus managers’ attention on the performance dimensions that are
being measured or emphasized and away from dimensions that are not,
even if this allocation of effort is detrimental to the firm. As a result, the
performance measurement system has the potential to cause substan-
tial damage if too much emphasis is placed on performance dimensions
that are easy to measure at the expense of harder-to-measure dimen-
sions that are key drivers of strategic success.
Information system problems
The first step in any strategic data analysi s process is collecting data on
the specific measures articulated in the business model. Most com-
panies already track large numbers of non-financial measures in their
day-to-day operations. However, these measures often reside in scat-
tered databases, with no centralized means for determining what data
are actually available. As a result, we found that measures that were
predictive of strategic success often were not incorporated into BSCs or
executive dashboards because the system designers were unaware of
their availability.
The lack of centralized databases also made it difficult to gather the
various types of strategic performance measures in an integrated format
that facilitated data analysis. Gathering sufficient data from multiple,
unlinked legacy systems often made ongoing data analysisof the hypothe-
sized strategic relationships extremely difficult and time-consuming.
Data inconsistencies
While the increasing use of relational databases and enterprise resource
planning systems can help minimize the information system problems
identified in our research, a continuing barrier to strategic data analysis
is likely to be data inconsistencies. Even within the same company, we
found that employee turnover, quality measures, corporate image, and
FROM STRATEGIC MEASUREMENT TO ANALYSIS 99
other similar strategic measures often were measured differently across
business units. For example, some manufacturing plants of a leading
consumer durables firm measured total employee turnover while others
measured only voluntary turnover, some measured gross scrap costs
(i.e. the total product costs incurred to produce the scrapped units)
while others measured net scrap costs (i.e. total product costs less the
money received from selling the scrapped units to a scrap dealer), and
some included liability claims in reported external failure costs while
others did not. Inconsistencies such as these not only made it difficult
for companies to compare performance across units, but also made it
difficult to assess progress when the measures provided inconsistent or
conflicting information.
Inconsistencies in the timing of measurement can also occur. A lead-
ing department sto re’s initial efforts to link employee and customer
measures to store profitability were unsuccessful because different
measures were misaligned by a quarter or more. Only after identifying
this database problem was the company able to identify significant
statistical relations among its measures. Similarly, a shoe retailer
found that its weekly data ended on Saturdays for some measures and
on Sundays for others. Since weekends are its primary selling days, this
small misalignment mad e it difficult to identify relationships. Correct-
ing measurement and data problems such as these was necessary before
the companies could effectively use data analysis to validate their per-
formance measures or modify their hypothesized business models.
A related issue is measures with different units of analysis or levels of
aggregation. One service provider we studied had fewer than 1,000 large
customers, and sought to determine whether customer-level profitabil-
ity and contract renewal rates were related to the employee and cus-
tomer measures it tracked in its executive dashboard. However, when it
went to perform the analysis, the company found that the measures
could not be matched up at the customer level. Although customer
satisfaction survey results and operational statistics could be traced to
each customer, employee opinion survey results were aggregated by
region, and could not be linked to specific customers. The company
also had no ability to link specific employees to a given customer,
making it impossible to assess whether employee experience, training,
or turnover affected customer results. Furthermore, the company did
not track cus tomer profitability, only revenues. To top it off, there was
not even a consistent customer identifi cation code to link these separate
data files. Given these limitations, it was impossible to conduct a rigor-
ous assessment of the links between these measures.
100 CHRISTOPHERD.ITTNER&DAVIDF.LARCKER
Organizational barriers
Lack of information sharing
A common organizational problem is ‘data fiefdoms’. Relevant perform-
ance data can be found in many different functional areas across the
organization. Unfortunately, our research found that sharing data across
functional areas was an extremely difficult task to implement, even when
it was technically feasible. In many organizations, control over data
provides power and job security, with ‘owners’ of the data reluctant to
share these data with others. A typical example is an automobile manu-
facturer that was attempting to estimate the economic relation between
internal quality measures, external warranty claims, and self-reported
customer satisfaction and loyalty. The marketing group collected exten-
sive data on warranty claims and customer satisfaction while the oper-
ations group collected comprehensive data on internal quality measures.
Even though it was believed that internal quality measures were leading
indicators of warranty claims, customer satisfaction levels, and future
sales, the different functional areas would not share data with each other.
Ultimately, a senior corporate executive needed to force the two func-
tions to share the data so that each would have a broad er view of the
company’s progress in meeting quality objectives.
Even more frequent was the reluctance of the accountants to share
financial data with other functions. Typical objections were that other
functions would not understand the data, or that the data were too
confidential to allow broader distribution. However, our research
found that one of the primary factors underlying these objections was
the fear that sharing the data would cau se the accounting function to
lose its traditional role as the company’s performance measurement
centre and scorekeeper, thereby reducing its power.
Uncoordinated analyses
The lack of incentives to share data is compounded by the lack of
incentives to coordinate data analysis efforts. Most companies pe rform
at least some analyse s of performance data, but these analyses are
frequently done in a piecemeal fashion. For example, the marketing
department may examine the drivers of customer satisfaction, the qual-
FROM STRATEGIC MEASUREMENT TO ANALYSIS 101
ity function may investigate the root causes of defects, and the human
resource department may explore the causes of employee turnover, with
little effort to integrate these analyses even though the company’s stra-
tegic business model suggest they are interrelated. The lack of inte-
grated analyses prevents the company from receiving a full picture of
the strategic progress, and limits the ability of the analyses to increase
organizational learning.
More problematically, the ability of different functions to conduct
independent analyses frequently results in managers using their own
studies to defend and enhance their personal position or to disparage
someone else’s. In these cases, the results of conflicting analyses are
often challenged on the basis of flawed measurement and analysis. By
not integrating the analyses, it is impossible to determine which of the
conflicting studies are correct.
Fear of results
As the preceding examples suggest, performance measurement systems
and strategic data analysis are not neutral; they have a significant influ-
ence on power distributions within the organization through their role
in allocating resources, enhancing the legitimacy of activities, and de-
termining career paths. As a result, some managers resist strategic data
analysis to avoid being proved wrong in their strategic decisions. We
found this to be particularly true of managers who were performing well
under the current, underanalysed, strategic performance measurement
system. While strategic data analysis could confirm or enhance the
value of their strategic decisions, it could also show that their perform-
ance results were not as good as they originally appeared.
Organizational beliefs
Finally, more than a few of the organizations we studied had such strong
beliefs that the expected relations between their strategic performance
measures and strategic success existed that they completely dismissed
the need to perform data analysis to confirm these assumptions. We
repeatedly heard the comment that ‘it must be true’ that a key perfor m-
ance indicator such as customer satisfaction leads to higher financial
102 CHRISTOPHERD.ITTNER&DAVIDF.LARCKER
returns. As our earlier examples indicated, these relationships fre-
quently are not that straightforward. What often drives these strong
beliefs is management intuition and past experience. However, even
though management intuition and past history play important roles in
strategic decision-making, the strategic control literature points out that
competitive environments change and must be continually evaluated.
Strategic choices and performance measures that were previously de-
terminants of long-term economic success may no longer be valid.
Strategic data analysis provides one mechanism to evaluate the ongoing
validity of these organizational beliefs.
Conclusions
Recent discussions of strategic accounting and control systems have
emphasized the development of new performance measurement sys-
tems that better reflect strategic objectives and their drivers. Our re-
search indicates that the implement ation of effective strategic
performance measurement systems can be greatly enhanced by adding
substantial sophistication to the choice and analysis of strategic per-
formance measures and targets. This requires companies to move away
from the overreliance on generic performance measurement frame-
works and management intuition that currently guide many strategic
performance measurement initiatives, and to place more emphasis on
the use of quantitative and qualitative analysis techniques for selecting
the measures that are actually leading indicators of strategic perform-
ance, determining the relative importance to be placed on the various
measures based on their contribution to desired results, and assessing
the measures’ appropriate performance targets.
Even when data analysis indicates that the selected measures do not
exhibit the expected relations, the results provide a mechanism for
promoting the dialogue and debate that underlie effective strategic
control. The contrary results can be due to incorrect assumptions in
the strategic plan and business model, limitations in the measures,
database problem s, or organizational barriers that prevent improve-
ments from reaching the bottom line. If managers strongly believe that
hypothesized relations exist, efforts should be made to determine which
of these explanations is true.
Finally, we found that successful data analysis and interpretation
efforts require clear assignment of responsibilities for conducting ana-
FROM STRATEGIC MEASUREMENT TO ANALYSIS 103
lyses, strong execut ive support to ensure the availability of adequate
resources and cross-functional cooperation, and regularly scheduled,
ongoing reassessment of the results. The need for ongoing analysis is
particularly important. Dynamic changes in a company’s life cycle,
corporate strategy, and competitive environment can change the rela-
tions in the strategic business model over time, or even make the entire
business model obsolete. Regular, ongoing analyses allow the company
to verify that the strategy, business model, and hypothesized linkages
remain valid.
References
Ahrens, T. and Chapman, C. S. (2005). ‘Management Control Systems and the Crafting of
Strategy: A Practice-Based View’, in C. S. Chapman (ed.), Controlling Strategy: Manage-
ment, Accounting and Performance Measurement. Oxford: Oxford University Press.
Argyris, C. (1982). Reasoning, Learning, and Action. San Francisco: Jossey-Bass.
Bommer, W. H., Johnson, J. L., Rich, G. A., Podsakoff, P. M., and MacKenzie, S. B. (1995). ‘On
the Interchangeability of Objective and Subjective Measures of Employee Performance:
A Meta-Analysis’, Personnel Psychology, 48(3): 587–605.
Gates, S. (1999). Aligning Strategic Performance Measures and Results. New York: The
Conference Board.
Hansen, A. and Mouritsen, J. (2005). ‘Strategies and Organisational Problems: Constructing
Corporate Value and Coherence in Balanced Scorecard Processes’, in C. S. Chapman
(ed.), Controlling Strategy: Management, Accounting and Performance Measurement.
Oxford: Oxford University Press.
Hayes, R. H., Wheelwright, S. C., and Clark, K. B. ( 1988). Dynamic Manufacturing: Creating
the Learning Organization. New York: Free Press.
Heneman, R. L., Moore, M. L., and Wexley, K. N. (1987). ‘Performance-Rating Accuracy:
A Critical Review’, Journal of Business Research, 15(5): 431–48.
Ittner, C. D., and Larcker, D. F. (2003). ‘Coming up Short on Nonfinancial Performance
Measurement’, Harvard Business School Press, 81(11): 88–95.
—— —— , and Randall, T. (2003). ‘Performance Implications of Strategic Performance
Measurement in Financial Services Firms’, Accounting, Organizations and Society,
28(7/8): 715–41.
Julian, S. D. and Scifres, E. (2002). ‘An Interpretive Perspective on the Role of Strategic
Control in Triggering Strategic Change’, Journal of Business Strategies, 19(2): 141–59.
Kaplan, R. S. and Norton, D. P. (1996). The Balanced Scorecard: Translating Strategy Into
Action. Boston, MA: Harvard Business School Press.
Lorange, P., Scott Morton, M. F., and Ghoshal, S. (1986). Strategic Control Systems. St. Paul,
MN: West Publishing Company.
Marr,B.(2004). Business Performance Management: Current State of the Art. Cranfield:
Cranfield School of Management and Hyperion.
Miller, P. and O’Leary, T. (2005). ‘Capital Budgeting, Coordination and Strategy: A Field
Study of Interfirm and Intrafirm Mechanisms’, in C. S. Chapman (ed.), Controlling
Strategy: Management, Accounting and Performance Measurement. Oxford: Oxford Uni-
versity Press.
104 CHRISTOPHERD.ITTNER&DAVIDF.LARCKER
Muralidharan, R. (1997). ‘Strategic Control for Fast-Moving Markets: Updating the Strategy
and Monitoring Performance’, Long Range Planning, 30(1): 64–73.
Peter, J. P. (1979). ‘Reliability: A Review of Psychometric Basics and Recent Marketing
Practices’, Journal of Marketing Research, 16(1): 6–17.
Ryan, M. J., Buzas, T., and Ramaswamy, V. (1995). ‘Making CSM a Power Tool’, Marketing
Research, 7(3): 10–16.
Sandt. J., Schaeffer, U., and Weber, J. (2001). ‘Balanced Performance Measurement Systems
and Manager Satisfaction—Empirical Evidence from a German Study’. Working paper,
WHU—Otto Beisheim Graduate School of Management.
Schreyogg, G. and Steinmann, H. (1987). ‘Strategic Control: A New Perspective’, Academy of
Management Review, 12(1): 91–103.
Simon, H. A., Kozmetsky, G., Guetzkow, H., and Tyndall, G. (1954). Centralization Versus
Decentralization in Organizing the Controller’s Department. New York: Controllership
Foundation.
Towers Perrin (1996). Compuscan Report. New York: Towers Perrin.
FROM STRATEGIC MEASUREMENT TO ANALYSIS 105
Management Control Systems
and the Crafting of Strategy:
A Practice-Based View
Thomas Ahrens and Christopher S. Chapman
Managing their relationships with customers is a vital capability of
organizations. Even though the role of accounting and management
control systems (MCS) in this process has long been conceptualized
under the label of strategic management accounting (Simmonds 1981,
1982), recent studies found it difficult to trace the influence of this
concept on strategic organizational practices (Tomkins and Carr 1996 ,
Guilding et al. 2000; Roslender and Hart 2003). This chapter draws on
practice theory as a way of understanding the strategic potential of MCS.
It focuses specifically on the day-to-day uses of MCS for the m anage-
ment of customer relationships in head office (HO) and local units.
In strategy literature, the relationship between strategy-making by
senior management and the day-to-day activities of operational man-
agement is only beginning to be systematically explored (Whittington
2002; Johnson et al. 2003), despite the much earlier notion of ‘crafting
strategy’ (Mintzberg 1987). The resource-based view of strategy has
proved an important development in the attempt to relate organiza-
tional missions with organizational capabilities through the notion of
routines (Johnson et al. 2003). Strategic capabilities and resources are
thus grounded in day-to-day organizational action (Feldman 2004). In
organization studies, the interest in hypercompetitive environments
has resulted in a reconceptualization of the strategy-making process
from an episodic to a continuous endeavour (Brown and Eisenhardt
1997).
In MCS literature we have witnessed two related developments. The
balanced scorecard (BSC) originated as a relatively straightforward call
for greater levels of non-financial performance measurement (Kaplan
and Norton 1992). Subsequent developments sought to posi tion the BSC
at the heart of organizational strategy-making—in terms of strat egy
development, implementation, and refinement (Kaplan and Norton
1996, 2000). A difficulty in working with such ideas is the complex
nature of the relationship between strategy, MCS, and operational
management (e.g; Roberts 1990; Simons 1990; Ahrens 1997; Mouritsen
1999; Ahrens and Chapman 2002, 2004a, b).
In this chapter we suggest a form of analysis that may provide new
insights into the nature of management control and strategy, and the
relationship between the two. We seek to understand the relationship
between management control and strategy through the detailed exam-
ination of management practice (Ahrens and Chapman 2004b). Practice
theorists share a concern over the neglect of action in social theory
(Schatzki et al. 2001). A practice perspective would seek to foreground
the roles of individual organizational members in the context of the
webs of organizational routines, none of which can typically pre-empt
strategic choice (Child 1972).
In this way our practice perspective on the crafting of strategy through
MCS can begin to address the ways in which the efforts of local man-
agers might be harnessed to pursue continuously the agendas of the
organizational centre. MCS hold out the promise of measuring out small
achievable steps throughout an organization’s operations that give local
managers a sense of their contribution to organizational strategies. This
is impor tant because apart from very simple and stable situations, the
conceptual linkages between organizational strategy and operational
action cannot rely on mechanical cause-and-effect relationships. In
relating MCS and strategy it would thus be important for the organiza-
tional centre to avoid simply replacing local efforts with their central
instructions. In many organizations the significance of local informa-
tion and local autonomy means that strategy as organizational practice
only comes into its own through the day-to-day activities of individual
managers. Whether the strategic tasks lie in customer selection and the
active shaping of their preferences, or in identifying what the customer
wants, the crafting of strategy benefits from a detailed understanding of
the financial implications of strategic choices through MCS.
Practice theory
Even though there are almost as many practice theories as practice
theorists, a shared concern has been the relationship between action
and the systematic properties of its contexts (Schatzki et al. 2001).
According to Ortner (1984) practice theory explains ‘the relationship(s)
that obtain between human action, on the one hand, and some global
entity which we call ‘‘the system’’ on the other’, where the system can be
MCS AND THE CRAFTING OF STRATEGY 107
analysed as political, economic, cultural, or combinations between
these.
Its concern with volition makes practice theory of immediate interest
to strategy theorists. For practice theorists, as much as for other social
scientists, volition is conditioned by aspects of ‘the system’ as well as
by extant action, especially routines. Importantly, however, practice
theory introduces a concern with the moment of action in which the
actor is showing a certain knack, an immediate familiarity with the
situation and the possibilities that it presents. For Bourdieu (1992) the
‘sens pratique’ shows itself for example in the timing of action to convey
urgency, commitment, loyalty, distance, aloofness, etc., in just the right
measures.
Compared with the actor’s unspoken mastery of certain situations,
explicit decision rules seem unwieldy and, very often, unrealistic. At the
individual level, expert actors tend not to articulate explicit decision
rules and ‘apply’ them to situations like a novice would (Dreyfus and
Dreyfus 1988). Experienced drivers, for example, understand traffic situ-
ations holistically and act immediately. There is, literally, ‘no time to
think’. Novice drivers who get caught up in chains of reasoning lose
control of the situation and crash. Novice management accountants
tend to lack the ability to think through organizational situations with
the conceptual sch emes that they stud ied during their training (Ahrens
and Chapman 2000). The usefulness of those schemes for practice only
becomes apparent thro ugh experience.
Cognition in practice is thus not the application of ‘thought tools’ to
certain situations to achieve certain ends, because in practice the pro-
cesses in which situated actors come to know involves simultaneous
changes of context, knowledge, and ends. Cognition becomes a process
that is ‘distributed—stretched over, not divided among—mind, body,
activity and culturally organized settings (which include other actors)’
(Lave 1988:1). It can generate new organizational strategies as much as it
is informed by existing strategies that give it certain ends and context
descriptions to work with. Conceptualized as distributed across differ-
ent organiz ational elements, cognition is implicated in the ways in
which the different ends of many actors intermingle with their various
actions.
The notion of strategy as organizational practice is also highlighted in
the dynamics between formal power and the resistance of those who are
to be co-opted into an organizational strategy. de Certeau (1988) based
his scheme of practices on the distinction between powerful actors who
could rely on recognized power bases, such as governments, scientific
108 THOMAS AHRENS & CHRISTOPHER S. CHAPMAN
institutions, wealthy corporations, etc., and the powerless to whom they
addressed themselves through laws, scientific advice, consumer prod-
ucts, services, and advertisements. For de Certeau, strat egy was the
province of the powerful who could afford to develop and impress
them on a public whose only recourse lay in mobile tactics to variously
circumvent strategies or absorb them into temporar y arrangements with
the powers that be. An important implication of this distinction between
strategy and tactics is to highlight the significance of the opportunities
for adjustment and resistance within strategies and the manner in which
those opportunitie s are seized by organizational members.
This is not to appeal to a stereotype of grass-roots resistance to top–
down strategies but to open up for detailed investigation the spectrum of
possible local responses and accommodations to central strategies,
many of which may be spurred on by strategic ignorance of local cir-
cumstances and, conversely, local ignorance of central strategic prior-
ities. Rather than see tactics as nested snugly within layers of overarching
strategies, a practice view would emphasize the potential innovations of
skilful situated actors and their subsequent impact on organizational
strategy.
Research design
Our analysis is grounded in an in-depth longitudinal field study of MCS
in Restaurant Division, a UK-based restaurant chain. In order to dem-
onstrate the potential of a practice approach in helping to develop our
understanding of the relationship between MCS and strategy, this chap-
ter analyses the ways in which strategic resources for identifying, under-
standing, and satisfying the customer were constructed in Restaurant
Division. First, we will analyse the ways in which customer relationships
were analysed and managed in individual restaurants. We will then
explore the ways in which HO marketing analysts and operations staff
sought to draw on MCS as a way of engendering strategically informed
routine behaviours in restaurants.
We approached fieldwork with the aim of dev eloping a comprehen-
sive view of the nature and role of MCS in one of the largest full-service
restaurant chains in the UK. All restaurants were wholly owned by the
company and were run by salaried managers. Restaurant Division had
enjoyed substantial returns on sales and sales growth over a period of
years. This growth had been attained partly through acquisition of
MCS AND THE CRAFTING OF STRATEGY 109
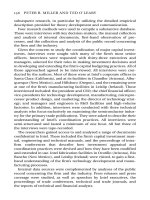
smaller chains but mainly through addition of new units. More than 200
restaurants were organized as profit centres, which reported into areas
and then regions of operationa l management. Restaurant Division was
wholly owned by and reported to a leisure group quoted on the London
Stock Exchange, but it was also registered as a company with limited
liability and had its own board of directors (Figure 6).
Our fieldwork over a period of a little over two years involved inter-
views, examination of archival records, and direct observation of meet-
ings and workshops. Table 3 details what might be thought of as formal
data collection. Starting from a definition of MCS as ‘the formal, infor-
mation-based routines and procedures managers use to maintain or
alter patterns in organizational activities’ (Simons 1995: 5), we carried
out a series of semi-structured interviews aimed at building a general
picture of how the interviewees, from waiters to the managing director,
thought about their roles, and what, if any, part was played by formal
information and control systems in supporting these roles.
Restaurant Division
managing director
Area managers
Restaurant
managers
Operations
regional managers
Operations
director
Central financial
services
Marketing
director
Human resources
director
Finance and
commercial
director
Group board
of directors
Commercial
MIS
Finance
Based away from head office
Figure 6 Restaurant Division organization chart
110 THOMAS AHRENS & CHRISTOPHER S. CHAPMAN
These interviews lasted about seventy minutes on average. Most of
them took place with both researchers present, were tape-recorded, and
subsequently transcribed. Where this was not possible notes were taken
during the interview, and more detailed notes were written up aft er-
wards as soon as possible. Over the course of the study we interviewe d
the entire divisional board and executive committee, together with
various other HO managers and staff specialists across all functions. In
the operations hierarchy we interviewed both regional and area man-
agers, and restaurant managers.
We reviewed internal planning, control and financial documents,
materials used in internal training, com puter data entry and reporting
screens, etc. These materials were often presented and discussed during
interviews, giving interviewees opportunities for talking to us through
their work.
Table 3 Information on formal fieldwork activity
Functional breakdown of interviews carried out
Central financial services 1
Head office—Commercial 6
Head office—Finance 11
Head office—HR 4
Head office—Managing Director 1
Head office—Marketing 5
Head office—MIS 2
Head office—Operations 4
Area managers 2
Restaurant managers 9
45
Observations and attendance at meetings
Area business development meetings 2
Cross-functional meeting to discuss the food margin 1
Eating of ‘control’ 3 course meals by both researchers 2
Area manager—restaurant manager performance reviews
(held at individual restaurants)
6
Observation of kitchen operation 2
Residential control workshops 2
Various finance meetings 4
19
MCS AND THE CRAFTING OF STRATEGY 111
We carried out observations at the HO and in restaurants, as well as
several residential training sessions. We made visits to fifteen restaur-
ants, sometimes more than once, where we either observed perform-
ance reviews between restaurant managers and their area manager or
interviewed restaurant managers and had shorter meetings with various
assistant managers, chefs, and waiting staff. We also took the opportun-
ity to observe restaurants (including kitchens) during opening hours. On
two occasions we ordered the same three-course meals in order to
assess the standardized nature of portions and presentation.
Informally, our presence at coffee breaks and meals during and after
our formal observations and interviews meant that we could listen to
participants’ observations of, and, reactions to, the meetings. On such
occasions we also learned about a rich stream of organizational gossip,
jokes, and stories, which we used to test our developing understan ding
of the role of MCS in Restaurant Division.
An important issue in qualitative fieldwork is knowing when to exit
the field (Miles and Huberman 1994). Qualitative research aims for deep
contextual understanding of the kind that enables the researcher to
gradually become able to predict organizational members’ responses
to certain kinds of issues. This is known as theoretical saturation
(Glaser and Strauss 1967; Strauss and Corbin 1990). Depending on the
issues under study and the complexity of the organization studied,
saturation is achieved over varying lengths of time. We decided to
terminate our fieldwork after we felt that we had developed a clear
sense of the role of MCS within Restaurant Division. Formal feedback
on our understanding was provided through discussions of a report on
our findings with the divisional financial controller and the divisional
finance director.
Analysis of rich field material is a creative ongoing process. As such
various modes of analysis were overlapping and iterative (Ahrens and
Dent 1998). Interview transcripts and field notes were organized chrono-
logically, and the common issues in the material were analysed to
understand areas of agreement and disag reement between organiza-
tional actors and groups. Findings that did not appear to fit emerging
patterns identi fied in this process were marked for subsequent discus-
sion as the research continued. Archival records were used to elaborate
and confirm issues that arose in interviews and observations. We also
dissected and reorganized the original transcripts around emerging
issues of significance to our understanding of MCS.
112 THOMAS AHRENS & CHRISTOPHER S. CHAPMAN
The construction and management of the customer
in restaurants
For the restaurant managers a key task was to mesh their understanding of
customers with HO’s strategy as communicated through MCS. The
achievement of targets in individual restaurants required the continuous
reconciliation of central expectations with the local situation. Customer
satisfaction was a key non-financial performance measure for restaur-
ants. Understanding how to achieve high customer satisfaction within
budget constraints was an important skill of restaurant managers. For the
individual managers this was nota matter of simply balancing satisfaction
with costs. Rather, to make the central strategy work in their outlet they
needed to understand the priorities of their particular clientele through
their financial implications. MCS were used to structure the customer
relationship in ways that allowed them to retain flexible control over it.
Taken together, Restaurant Division’s perfor mance measurement sys-
tems described a model of restaurant operation that balanced economic
efficiency (such as customers per waiter or ingredients per dish) with
service-level expectations according to centrally determined standards.
Given this organizational set-up the overall balance of control in the
organization might appear highly centralized, with restaurant managers
expected to simply implement HO standards. This would however be
too static a view. The implementation of standards in an actual restaur-
ant required the continuous reconciliation of central expectations with
the local situation. In the context of a full-service restaurant this turned
out to be a complex task. In order to illustrate this point we offer the
following stylization of the challenges of restaurant management during
a single serving session.
Based on their current performance against budget, managers planned
their restaurant’s operational resources before each session.With a budget
surplus, it would be possible to plan for generous staffing levels that might
translate into improved customer service, greater customer satisfaction,
and enhanced spend-per-head. Likewise, certain pre-prepared food
items, e.g. baked potatoes, allowed for faster service, but might ultimately
go to waste. A deficit against budget would suggest a different operational
set-up. The restaurant manager might fill in as grill chef or help the waiting
staff. There would be only minimal pre-preparation of food.
During each session these decisions could be finessed as the session
unfolded. For instance, could the restaurant accommodate a large party
without a reservation? The restaurant manager needed to consider the
MCS AND THE CRAFTING OF STRATEGY 113