Quantitative Economics How sustainable are our economies by Peter Bartelmus_4 potx
Bạn đang xem bản rút gọn của tài liệu. Xem và tải ngay bản đầy đủ của tài liệu tại đây (524.55 KB, 22 trang )
68 4 Statistics and Indicators
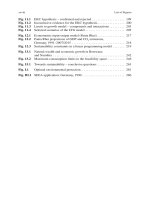
Box 4.1 Environmental topics in the CARICOM compendium
1–3 Background information
Geography, policy issues, socio-economic characteristics
4 Environmental health
Water and sanitation, environmental diseases
5 Tourism
6 Freshwater
Water abstraction, supply, use, treatment and quality
7 Coastal and marine resources
Water quality, vulnerable areas and protection, fisheries and aquaculture
8 Land use and agriculture
Land use, biochemicals
9 Forests
10 Biodiversity
Threatened species, protected areas
11 Minerals, energy and transport
12 Air
Greenhouse gas emissions, ozone-depleting substances, other, air quality
13 Waste
14 Natural and environmental disasters
Source: CARICOM (2003).
Pressure
State
Response
Human
activities
State of the
environment
and of natural
resources
Economic
and
environmental
agents
Information
Pressures
Resources
Informa-
tion
Societal
responses
Societal responses
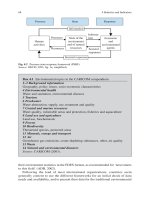
Fig. 4.2 Pressure-state-response framework (PSRF)
Source: OECD (1993, fig. 1a, simplified).
their environment statistics in the FDES format, as recommended for ‘newcomers
to this field’ (ADB, 2002).
Following the lead of most international organizations, countries seem
generally content to use the different frameworks for an initial check of data
needs and availability, and to present their data for the traditional environmental
media of air, water, land and, sometimes, human settlements. This allows
flexibility, but introduces a certain degree of arbitrariness in selecting and
presenting environment statistics.
The remaining question is what are the actual needs for and uses of a com-
prehensive environment statistics publication? One of the first assessments of
an environment statistics compendium in Finland
3
came up with the surprising
result of high schools as the main user. Most decision-makers apparently con-
tinued to rely on their own databases, tailored to their specific needs such as
water data for a water department or hydrological institute. Of course, such
specialization impairs data integration across institutions and environmental
and socio-economic fields.
Policymakers tend to ignore the extensive and difficult-to-read measurement
of environmental issues in large statistical compendia. The reason might be
their preference for more selective and aggregate indicators related to pressing
policy concerns. Moreover, statistical compendia rarely specify concrete use
and applications, beyond generics like the objective of ‘sustained monitoring
and evaluation of the state of the environment and sustainable development’
(CARICOM, 2003). Perhaps the most important use of a common framework
for environmental topics and statistical variables is to foster better communi-
cation between data producers and users.
4.1.2 Integrating Economic, Environmental
and Social/Demographic Statistics
4
Chapter 2 identified interactions and repercussions between the environment and
socio-economic activities as the cause of potential non-sustainability of economic
activity. Obviously, environmental statistics cannot assess these interactions on
their own, but need to be linked to the other statistical fields.
Figure 4.3 illustrates the numerous interrelationships among the stocks and
flows of the three basic areas of economic, environmental and demographic (and
social) statistics. The figure thus elaborates on Fig. 2.1, the environment-economy
interface, in terms of statistical topics and variables. The (highlighted) sequence
of flows of pollutants from production and consumption (flows 6 and 7) illustrates
this interaction. Emissions are partially controlled by environmental protection
(8), or escape control and accumulate in environmental media (14); subsequent
‘consumption’ of pollutants by humans is shown as part of ‘other’ population
activities (18). A further extension of this sequence refers to health and welfare
effects from pollution (19) and natural disasters (15).
3
Oral communication by a representative of Statistics Finland at a United Nations expert group
meeting.
4
This section is based on Bartelmus (1987).
4.1 Statistical Frameworks 69
70 4 Statistics and Indicators
Real-world complexities and interactions call for better and transparent link-
age of the statistical systems across their conventional boundaries. The FDES
offers some linkage through its information categories of economic activities,
environmental impacts and social responses. The flexible structure of the FDES
appeals as a tool for the coordination and connection of all basic statistical
areas. Table 4.3 thus applies FDES criteria to the SNA and SSDS in order to
outline an overall Framework for Statistical Integration (FSI) (or put more mod-
estly, for statistical coordination). Contrary to a systems approach, the frame-
work does not try to relate variables through strict functional or accounting
relationships. It should help, though, developing common concepts, definitions,
classifications and tabulations.
SNA FDES SSDS
(Economy) (Environment) (Population)
ACTIVITIES
(flows)
ASSETS
(stocks)
Consumption
Accumulation
Productive
capital
Use of natural
resources
Emission
Natural
events
Environmental
capital
Population
movement
Social
services
Other
activities
Human and
social capital
(1)
(2)
(3)
(6)
(7)
(14)
(4)
(5)
(9)
(10)
(11) (12)
(13)
(15)
(16)
(17)
(19)
(8)
(18)
Production
Fig. 4.3 Real world and statistical systems
(1) Goods and services for private and public consumption; (2) Capital goods; (3) Supply of social
services and use of goods in ‘other activities’; (4) Use of natural resources in production; (5) Fixed
capital consumption; (6) Emission of waste and pollutants from production; (7) Emission from
consumption; (8) Pollution control, environmental protection; (9) Consumption of natural
resources (subsistence, physiological); (10) Capital formation; (11) Construction of shelter and
infrastructure; (12) Depletion of natural resources; (13) Destruction of human settlements and
natural resources by natural disasters; (14) Ambient concentrations in the human environment;
(15) Loss of life and limb from natural disasters; (16) Net population growth; (17) Labour; (18)
Human consumption of pollutants; (19) Health and welfare effects.
Source: Bartelmus (1987, fig. 1, modified).
The FSI largely maintains the original subject areas or topics of SNA, FDES and
SSDS. On the other hand, it organizes these subjects around the FDES information
categories. These categories simply reflect the common interest of all statistical
systems in describing the state and changes of the real world, as well as the major
activities responsible for these changes. Marking the first column of the framework
as opening assets and adding a last column of closing assets could display accounting
relationships. This is the approach taken in greening the national accounts (Section
7.2). Given ever-changing social concerns, the framework should also facilitate the
evaluation of established but under- or overused statistical series, and reveal new
data needs.
The category of social response is unusual in traditional statistics. Much of the
dissatisfaction with conventional statistics stems from ignoring policy responses
and their evaluation. This is one reason for the interest of policymakers in more
flexible ‘indicators’ that relate to policy objectives and can be readily adapted to
changing concerns and priorities.
Table 4.3 Framework for statistical integration (FSI)
Information
category
Statistical
system
(subject area) Assets Activities
Impacts on
assets
Responses to
impacts
SNA (economy) - Financial assets
- Net tangible
assets
- Production
- Consumption
- Accumulation
- Distribution
- Rest of the
world
- Saving
- Net capital
formation
- Other volume
changes
- Macroeconomic
policies
FDES (environment) - Stocks/reserves
of natural
resources and
environmental
assets
- Human settle-
ments
- Use of natural
resources
- Emissions
- Natural events
- Construction
and use of
shelter and
infrastructure
- Resource
depletion or
increase
- Ambient con-
centrations of
substances
- Ecological
impacts
- Environmental
policies and
programmes
- Environmental
management
- Welfare effects
SSDS (population) - Population - Population
movements
- Other social
activities
- Population
increase or
decrease
- Changes in
public health
- Other changes
in human
capital
- Population
policy
- Employment
policy
- Provision of
social services
Source: Bartelmus (1987, table 1, modified).
4.1 Statistical Frameworks 71
72 4 Statistics and Indicators
4.2 From Statistics to Indicators ‘for’ Sustainable
Development
4.2.1 Indicator Selection: Reducing Information Overload
The main drawback of the FDES is the generation of nearly 500 statistical variables in
its follow-up methodological publications (United Nations, 1988, 1991). International
organizations advanced, therefore, shorter lists of ‘core’, ‘key’ or ‘headline’ indicators
of both the environment [FR 4.3] and sustainable development [FR 4.4].
Selecting key statistics as indicators for environmental assessment and policy
analysis blurs the distinction between environmental statistics and broader indi-
cators. Most definitions stress, indeed, the capability of an indicator to represent
a social concern beyond the immediate meaning of the underlying statistic(s)
(Box 4.2).
Indicator selection and definition are first steps towards aggregation of data for
assessing the state of the environment or sustainable development. The inherent sub-
jectivity in choosing indicators for multidimensional sustainable development, and a
call by the Rio Summit to nonetheless develop indicators for the paradigm (United
Nations, 1994, ch. 40) are the reasons for a flurry of different indicator proposals.
International organizations, governments, NGOs and experts in the field proposed
Box 4.2 Indicator definition
The social indicator movement of the 1970s is probably the best-known
attempt to reflect the standard of living by selected non-monetary statistics.
It brought about a large and confusing variety of definitions and terms for
indicators, statistics and indices (e.g. Gallopín, 1997). Most definitions refer
to the broader ‘representativeness’ of a selected statistic or combination of
statistics. This suggests the generic definition of an indicator as:
simple average of a statistical variable or ratio of variables that provides an image
beyond the immediate attribute or observation of the variable or ratio itself.
Besides selection of the statistics, the interpretation of the overall image
introduces a further subjective element into indicator use. A good example is
average life expectancy that is generally taken as a measure of population health.
In contrast to an average of statistical variables, an index is a combination
of indicators. The index is usually calculated as a weighted or unweighted
(equally weighted) indicator average; other more complex aggregation
methods also apply (see Section 5.1).
widely differing indicator sets, undeterred by the largely negative experience of the
social indicator movement in the 1970s [FR 4.3]. Indicator lists of varying length and
contents reflect the concerns or interests of their authors [FR 4.4]. Typically these
concerns refer to some or all of the following topics:
●
Population (growth, migration, refugees)
●
Human needs (health, food, housing, education, equity, security, etc.)
●
Renewable and non-renewable natural resources
●
Environmental quality (air, water, land)
●
Ecosystems (acidification, eutrophication, biodiversity)
●
Economic activities (and their impacts, including emissions, natural resource
use, production and consumption patterns, technologies)
●
Natural and man-made disasters
●
Global environmental problems (climate change, ozone layer depletion)
●
Globalization
●
Institutions.
Clearly, these topics overlap. Determining the desired scope and coverage, mini-
mizing overlap and choosing the best indicators for different topics requires a
more systematic selection process – than ad hoc choices by interested parties.
Urging the use of good criteria for indicator selection and definition, such as
those of Box 4.3, may help improve indicator quality and validity. However,
admonition will not do: what we need is a clear procedure, which identifies
4.2 From Statistics to Indicators ‘for’ Sustainable Development 73
Box 4.3 Principles and criteria for sustainable development indicators
Bellagio principles ( />●
Guiding vision and goals, holistic perspective, essential elements of sus-
tainable development
●
Adequate scope (temporal and regional)
●
Practical focus (categories and framework, limited issues and indicators,
standardization, targets and thresholds)
●
Openness, effective communication, broad participation
●
Ongoing assessment (iterative and adaptive indicator development) and
institutional capacity
to which one could add OECD (2003) criteria:
●
Representativeness of indicators
●
Comparability for international comparison
●
Analytical soundness and measurability
74 4 Statistics and Indicators
quantifiable topics of broad concerns and relates the topics to the appropriate data
system. This is indeed the approach of the above-described FDES and similar
indicator frameworks.
4.2.2 A Framework for Sustainable Development Indicators
As shown in Section 4.1.2, the FDES is capable of presenting different statistical fields
in terms of stock and flow categories. The FDES also facilitates linking these variables
across the different fields and categories through its action-impact-reaction structure.
In principle the – expanded – FDES could thus facilitate the transparent selection and
definition of a reasonable number of sustainable development indicators.
The Earth Summit’s Agenda 21 (United Nations, 1994; see also Fig. 1.1) reflects
international agreement on the scope and coverage of sustainable development. For
developing a Framework for Sustainable Development Indicators (FSDI) (Bartelmus,
1994b),
5
Table 4.4 groups the Agenda 21 programmes under the economic, social,
environmental and institutional dimensions of sustainable development. Cross-
classification with the FDES information categories obtains a framework, which
combines the concerns of potential data users (reflected in Agenda 21) with those
of the data producers (presented as FDES-type statistical topics). Most indicator
proposals applied, at least initially, some version of FSDI (mostly under the PSR
label), but without resort to the statistical database [FR 4.4].
In the environmental field, the contents of the FSDI consist mostly of FDES
statistical topics. For sustainable development indicators, new topics stem from
other statistical fields for the economic, social and institutional dimensions of
sustainable development.
The impacts/effects column shows the physical impact of economic activity on
the state of the environment and on humans as welfare effects of these impacts;
these are the symptoms of environmental non-sustainability of socio-economic
development. The activities/events category refers to the causes (driving forces and
pressures) of impacts and effects from production and consumption, population
dynamics, natural resource use, emission of pollutants and waste, and natural and
man-made disasters. The social response to impacts and effects can be carried out
through natural resource management, pollution control, macro-policies of sustainable
development, private sector adaptation and institutional change. Inventories/stocks
describe the economic and environmental capacities of supporting sustainable
growth and development in the long term; they are a key element of environmental
sustainability and accounting.
5
The original proposal was for a framework for indicators of sustainable development. The rela-
belling as Framework for Sustainable Development Indicators’ is more in line with distinguishing
between indicators ‘of’ and ‘for’ sustainable development (see Section 4.3).
Table 4.4 Framework for Sustainable Development Indicators (FSDI)
a
Agenda 21 clusters
FDES information categories
Socio-economic activities,
events Impacts and effects Responses to impacts
Inventories, stocks, back-
ground conditions
Economic issues
2. Cooperation,
4. Consumption,
33. Finance,
16/34. Technology,
8. Decision-making
- Economic growth
- Trade
- Production and consumption
patterns
- Sustainability of economic
performance and growth
- Private sector responses
- Sustainability policies and
programmes
- Fiscal instruments
- Environmentally sound
technology
- Economic situation
- Produced capital stock
Social and Demographic Issues
3. Poverty,
5. Demographics,
36. Education, training,
6. Human health
- Population growth and
change
- Distribution of income and
wealth
- Human health and contami-
nation
- Private sector response
- Social policy and pro-
grammes
- Demographic and
social conditions
- Human capital stock
Environmental Issues
9. Air/climate,
10/12–14. Land/soil,
17/18. Water,
11/15. Other natural resources,
19–22. Waste,
7. Human settlements and natural
disasters
- Emission into air, water
- Application of biochemicals
- Waste
- Use of natural resources
(fish, land, water, other)
- Quality of air, land/soil, water
- Change in stock/depletion
(fish, water, minerals, etc.)
- Impacts of disasters
- Human health, contamination
- Pollution monitoring and
control
- Resource management and
rehabilitation
- Private sector response
- Natural resource stocks
(agriculture, fishery,
hydro-systems, fauna,
flora, minerals, lithos-
phere, ecosystems)
- Weather, climate
Institutional Support
35. Science,
34. Capacity-building,
23/32. Roles of groups,
38-39. Institutional, legal arrange-
ments,
40. Information for decision making
- Private sector response
- Environmental law and
legislation
- Environmental data,
information
- Institutional capacities
Note:
a
Based on Bartelmus (1994b), table 3.
76 4 Statistics and Indicators
The importance of frameworks in tracing generic concerns down to statistics
becomes evident when indicators need to be defined rigorously and transparently
in terms of their underlying statistics. Unfortunately, data users mostly ignore
this aspect when negotiating for indicator lists that serve different policy agendas.
Note that in comparison to the core FDES topics the statistical topics of socio-
economic and institutional sustainability dimensions are quite undeveloped in
the FSDI. This may have contributed to the later abandonment of the FSDI by
data users. Typically, data users are less concerned or familiar with the nitty-gritty
statistical work.
Table 4.5 shows – in the FSDI format and for the example of freshwater –
different indicators advanced by the original FSDI, the United Nations and the
European Environment Agency (EEA). Some relabelling and break-ups of the
FSDI columns do not really alter the original framework.
6
Other organizations also
use the general pressure-state-response idea for their own environmental and sus-
tainability concerns. However, applying similar information categories to differing
or differently clustered environmental and socio-economic concerns still generates
different indicator sets [FR 4.3, 4.4].
Deviations from the FSDI and the DSR framework reflect an unwillingness by
national and international data users to be bound by the – non-binding – recom-
mendations of Agenda 21 and the resulting large number of over 100 indicators.
7
The OECD thus limited its ‘core’ environmental indicators to 40–50 indicators and
reduced these further to 10–13 ‘key’ indicators as ‘signals to policymakers’ (OECD
2003). Similarly, the EEA uses 12 indicators in its summary of the Environmental
Signals 2002
8
report.
The same motivation seems to be behind the abandonment of the DSR framework
by the United Nations in a more recent publication: on the one hand, policymakers
did not want to be bothered by a cumbersome data framework, which, ‘although
suitable in environmental context, was not as appropriate for the social, economic,
6
The DPSIR framework of the EEA distinguishes explicitly between a state category (‘impact’ in
the FSDI/FDES) and an impact category (‘effects’ in the FSDI/FDES); the framework also
extends the activities/events category by introducing ‘drivers’ (of economic sectors) and present-
ing activities and events as ‘pressures’ (of natural resource use and emissions). The DSR frame-
work of the United Nations simply renames the FISD categories of activities/events as ‘driving
force’ and impacts/effects as ‘state’. Note also that the omission of a stock category shifts the
availability of natural resources such as groundwater or mineral reserves to the state category in
the DSR framework, and to the response (reservoir stocks) categories in the EEA’s DPSIR frame-
work (indicated by arrows in Table 4.5).
7
An initial ‘starter set’ of FSDI indicators (Bartelmus, 1994b) came up with 107 indicators; later,
the DSR framework generated 130 indicators (United Nations, 1996).
8
(summary); discontin-
ued in the EEA 2004 Signals which present the full set of 30 indicators (opa.
eu/signals-2004/en/ENSignals2004web.pdf).
Table 4.5 FSDI and related frameworks: Freshwater indicators
Frameworks Activities/events Impacts/effects Responses
Inventories/
stocks
FSDI (statistical
topics)
a
- Fisheries
- Water use
- Emissions into
inland waters
- Fish stock changes
- Water resource changes
- Water quality
- Resource man-
agement and
rehabilitation
- Pollution
monitoring and
control
- Fish stocks
- Hydro-
logical
systems
DSR (indicators)
b
Driving force:
- Annual with-
drawal of
ground and
surface water as
per cent of total
available water
- Domestic con-
sumption of
water per capita
State:
- BOD in water bodies
- Concentration of
faecal coliform
[- Groundwater
reserves]
d
®
Response:
- Wastewater
treatment cov-
erage
- Density of
hydrological
networks
DPSIR
(indicators)
c
Drivers and
pressures:
Drivers:
- Emissions of
nitrates and
phosphates from
urban waste-
water treatment
Pressures:
- Emissions of
organic matter
and hazardous
substances
- Mean water
allocation for
irrigation
- Water exploita-
tion index
- Water use by
sectors and in
urban areas
State and Impact:
State:
- Concentration of
ammonium, BOD,
nitrates, phosphates,
hazardous substances,
nutrients, organic
matter in rivers
- Bathing water quality
- Drinking water quality
- Biological quality of
lakes
- Hazardous substances,
phosphates in lakes
(eutrophication)
- Nitrates, pesticides in
groundwater
Impact:
- National river classifi-
cation schemes
- Non-indigenous
species in rivers and
lakes
- Saltwater intrusion
- Water exploitation
index
Responses:
[- Overall
reservoir ®
stocks]
d
- Urban waste
water
treatment
(effectiveness)
- Water prices
- Water use
efficiency
Notes:
a
Table 4.4.
b
United Nations (1996); DSR is the acronym for Driving force, State, Response.
c
European Environment Agency (
DPSIR stands for Driving forces, Pressures, States, Impacts and Responses.
d
Arrows indicate a misplacement of stock variables in the respective frameworks.
4.2 From Statistics to Indicators ‘for’ Sustainable Development 77
78 4 Statistics and Indicators
and institutional dimensions of sustainable development’ (United Nations, 2001b).
On the other hand, discarding a framework that might reveal large data gaps, allowed
ignoring missing issues and data, and facilitated agreement on a short ‘core set’ of
58 indicators for selected policy ‘themes’.
The sometimes-heated discussion of theme and indicator selection reveals
another dichotomy between data users and official (governmental) data produc-
ers. Impatient data users are eager to obtain rough-and-ready information, even
at the cost of less clarity and accuracy, whereas statisticians may question the
validity of crude estimates. This dichotomy carries over into the assessment of
the sustainability of economic growth and development by means of ad hoc
compilations of indices (Ch. 5) and more systematic environmental accounting
(Chs. 6 to 8).
4.2.3 Indicator Use: Alert, Action or Evaluation?
Policymakers are usually unable to specify their data needs beyond generics such
as to ‘provide solid bases for decision-making’ (United Nations 1994, ch. 40),
‘reporting on the state of sustainable development’, ‘fulfillment of governmental
goals and targets’ (United Nations 2001b), or ‘to support and illustrate country
environmental performance’ (OECD 2003). A ‘short list’ of 14 ‘structural indica-
tors’ is to measure progress towards the somewhat conceited goal of the European
Union ‘to become the most competitive and dynamic knowledge-based economy in
the world capable of sustainable economic growth with more and better jobs and
greater social cohesion.’
9
Three general purposes of indicator use can be distinguished:
●
Early warning about hazardous impacts of economic activity
●
Assisting in policy formulation
●
Evaluation of policy performance.
Implicit or explicit extrapolation of trends of environmental and social impacts
of economic growth can alert us to risks of environmental degradation, exhaus-
tion of natural resources and social problems. More sophisticated modelling of
impacts and repercussions between environment and economic growth can
provide more accurate prediction, if based on realistic assumptions and valid
data (Ch. 11).
9
2000 Lisbon European Council Presidency Conclusions ( />summits/lis1_en.htm). The structural indicators can be found on Eurostat’s web site: http://epp.
eurostat.ec.europa.eu/portal/page?_pageid = 1133,47800773,1133_47803568&_dad = portal&_schema
= PORTAL.
Policy formulation and evaluation require the specification of goals, targets
or benchmarks, for which policy instruments need to be specified and against
which progress or failure can be assessed. The political process of selecting
themes and sustainable development indicators by the United Nations Commission
on Sustainable Development did not succeed in specifying such targets. Rather,
the weak assumption is that the indicators ‘implicitly reflect the goals of sustain-
able development’ (United Nations, 2001b). The most the United Nations could
do was listing goals, targets and standards from international conventions and
conferences for the different themes in an annex, but without direct link to the
proposed indicators.
The Millennium Development Goals (MDG) indicator programme is a collab-
orative effort of the United Nations Statistics Division, the International Monetary
Fund, the World Bank and OECD. It went further, using the goals and their time-
bound targets (Box 3.3) to develop and compile 48 indicators for each goal and
target. Table 4.6 illustrates this approach for the access-to-water-and-sanitation
target. Simple extrapolation of the 1990 and 2000 indicators to 2015 indicates
that for attaining the target of halving non-access by 2015 greater strides need to
be made, especially in rural areas. Such oversimplified analysis also reveals the
limitations of indicator use, due to lack of data: a linear extension of a decade’s
first- and last-year data is not a valid prediction of what could happen 15 years
into the future. Data availability is, of course, better in rich countries. For assess-
ing progress towards sustainable development, the OECD presents for its member
states full time series of indicators and confronts them with various national and
international standards and targets (OECD, 2003).
An interesting variation of policy evaluation guides China’s search for indicators
of ‘sustainable and harmonious development’. A focus on the performance of local
government officials reflects the continuing influence of the hierarchical structure
of the Communist Party (Box 4.4).
The indicators in the above-mentioned examples show progress or regress in the
particular areas they represent. They do not show the relative significance of any
specific area or target. The reason is incomparability of the indicators used for dif-
ferent areas. Indicators may indeed alert us to negative trends and urge action where
particular limits are at risk of transgression. However, they cannot set priorities for
4.2 From Statistics to Indicators ‘for’ Sustainable Development 79
Table 4.6
Trends towards meeting MDG targets for access to water and sanitation
Sustainable access to improved water
sources (% of population)
Access to improved sanitation
(% of population)
1990 2000 2015 1990 2000 2015
Urban 94 95 96.5 [97.5] 81 85 91 [92.5]
Rural 64 71 81.5 [85.5] 28 40 58 [70]
Note: 2015: linear extrapolation; target values in brackets.
Source: />80 4 Statistics and Indicators
action according to the importance of different concerns. Stakeholder groups might
pick up indicators for prodding government into action, but would of course
advance their own priorities and agendas.
Scattered indicator use and proliferation of indicator ‘menus’ serving different
policy agendas revived the idea of a common framework. It remains to be seen if
the United Nations Commission on Sustainable Development, which rejected such
a framework (Section 4.2.2), is now ready to reverse this decision after doubts
about the relevance of its indicator work. An expert group addressed this critique
and called for a ‘capital-based’ framework, which would combine the capital main-
tenance concept of sustainability accounting with the policy agenda of the MDG
(Pintér, Hardi & Bartelmus, 2006).
4.3 Global Warming: The Indicator ‘of’ (Non)Sustainable
Development?
Assessing the overall sustainability or non-sustainability of economic growth and
development requires aggregation. Simple listings of indicators ‘for’ sustainable devel-
opment cannot capture composite notions of social progress. This might explain
why national policymakers tend to ignore long and complex indicator sets.
Box 4.4 Evaluation indicators for local government officials in China
China’s focus on rapid economic growth largely ignored environmental trade-
offs. A recent indicator project (CCICED, 2005; Li et al., 2007) aims to
‘change the bias’ towards economic growth by refocusing governmental
policy on a ‘scientific approach to development and harmonious society’.
Measurement of the performance of local officials by new indicators is seen
as ‘a conductor’s “baton” that manipulates government works’.
Two categories of the proposed indicators either provide ‘scores’, which
can be added up for performance evaluation, or ‘veto’ (prohibit) further activ-
ity because its effects are measured as a violation of environmental or social
limits. The claim, based on case studies, is that the indicator system ‘is able
to … stimulate the local government to pay more attention to social develop-
ment as well as ecological and environmental protection, and to give more
respect to social justice and life’.
This assessment seems now to be overly optimistic: the recent ‘quashing’
of two reports on ‘green GDP accounting’ [FR 8.2] and of data on deaths
from pollution (by the World Bank) ‘appeared to suggest reluctance at the top
of China’s government to acknowledge the seriousness of environmental
degradation’ (M. Landsberg, Los Angeles Times, 24 July 2007). Other experts
blame the resistance of local officials to any attempt at evaluating their
environmental performance.
Understandably, they prefer to respond to a ‘nutshell’ indicator of the environment
or sustainable development that caters to the social concern en vogue.
Environmentalists have drawn attention to what they consider the greatest threat to
human survival: global warming. In this they found broad support, owing to public
media campaigns such as former Vice-President Al Gore’s ‘Inconvenient Truth’ or the
‘Live Earth’ concerts [FR 4.5]. Even corporations flaunt their concern about climate
change and cash in on lucrative tradables of greenhouse gas (GHG) emissions.
10
Estimates of the impacts of global warming vary widely (cf. Table 1.1), however.
There is still uncertainty about the degree of warming itself, and more so about its
effects on natural systems, human health, and human capability of dealing with
these effects. The latest report of the Intergovernmental Panel on Climate Change
(IPCC, 2007) puts global warming since pre-industrial times at about 0.8 °C and
predicts a temperature increase between 1.8 and 4.0 °C by the end of the century
(Box 4.5). Plate 4.1 dramatizes the impact and distribution of global warming by
the third and last decade of the century [FR 4.5].
Eco–nomics plays an important role in keeping particular environmental
concerns such as climate change in perspective, especially with regard to other
environmental and economic goals. The Stern (2007) ‘review of the economics of
climate change’ might have succeeded in doing this by monetizing the different,
mostly non-comparable environmental effects of global warming. However, the
review shows some bias in its valuations that makes the results questionable.
10
The Economist of 9 September 2006, ‘The heat is on, a survey of climate change’. The conven-
ience of a surrogate indicator for environmental impacts has made CO
2
emissions, the main GHG,
also a favourite of index calculations (Section 5.2) and modelling (see Part IV).
4.3 Global Warming: The Indicator ‘of’ (Non)Sustainable Development? 81
Box 4.5 IPCC (2007) report on climate change – key results
●
Greenhouse gas (GHG) concentrations increased ‘markedly’ due to fossil
fuel use and land-use change since 1750.
●
Global warming is, with 90% probability, the net effect of human
activities.
●
Total temperature has increased since 1850 by 0.76 °C.
●
‘Best estimates’ indicate a global temperature increase within the 21st
century of 1.8–4.0 °C (lowest and highest scenario).
●
Effects of global warming in the 21st century:
- Snow cover and sea ice is ‘likely’ to decrease
- The intensity of tropical cyclones is ‘likely’ to increase
- Precipitation is ‘very likely’ to increase in high latitudes and ‘likely’ to
decrease in the subtropics
●
Even with GHG stabilization, global warming and sea level rise are
expected to continue for centuries.
82 4 Statistics and Indicators
Plate 4.1 Projected surface temperature increase in the 21st century
a
Note:
a
“Best estimates” for the high-impact scenario, compared to 1980–1999.
Source: IPCC (2007) – Climate Change 2007: The Physical Science Basis, Summary for
Policymakers. Intergovernmental Panel on Climate Change (See Colour Plates).
The review uses cost-benefit analysis for evaluating the stabilization of
climate change at a desirable level. Damage of non-action is measured as a welfare
loss ‘equivalent to a reduction in consumption per head of between 5-20%’
(‘now and in the future’). The net benefit is determined by comparing this
welfare loss, deemed also to be 5–20% of world GDP, to the relatively low
annual action cost of 1% of world GDP. A number of methodological flaws
impair the estimates, including:
●
The combination of different welfare valuations for health and environmental
damage, and their incompatibility with the market values of GDP and consump-
tion (see Section 8.1.3)
●
The normative (ethical) choice of low social discount rates for international and
intergenerational equity (cf. Section 2.3.2)
●
The use of particularly pessimistic model assumptions, albeit with indications of
risks and uncertainties.
The current media hype surrounding climate change risks ignoring or downgrading
other environmental and sociol costs, e.g. of pollution or poverty. It is no surprise
that in most countries proclaimed policies of sustainable development continue to
focus on economic growth, catering to sustainability with some measures of energy
saving and CO
2
emission control. Box 4.6 illustrates this reductionist view. As dis-
cussed in Section 3.3.2, one reason for this view is a persisting EKC mentality in
economic policy; the expectation is that the transition to a dematerialized service
economy will solve most other environmental problems.
The reductionist view overlooks, however, that
●
Rich countries achieved some of their environmental successes by depleting the
natural resources of developing countries and, in some cases, by translocating
dirty production processes – in other words, by importing sustainability.
●
Services and information technology still require large amounts of energy and
material inputs, and infrastructure.
●
Risks of new (notably genetics and nanotechnology) and old (nuclear energy)
technologies loom large.
●
Rich countries mostly ignore ‘pollution of poverty’, i.e. poverty itself and
environmental impacts in poor regions of the world (natural disasters, water
shortage, soil degradation, deforestation, urban and indoor air pollution, and
epidemic diseases).
One cannot dismiss, of course, the considerable ramifications and risks of an
undeniable human-made global warming trend. But the potentially disastrous
effects remain risks. Selecting one particularly ominous environmental problem
and diverting funds from other social, economic and environmental concerns can
only be justified when there is no doubt about an imminent disaster that dwarfs
all other problems. The further reading section refers to some doubt, though,
about exceedingly high damage cost of global warming and relatively low cost
of tackling the damage without delay [FR 4.5]. Much of this book is therefore
about comparison and evaluation, based on a comprehensive measurement of the
environment-economy interaction rather than cost-benefit analysis of particular
issues. The next chapter examines whether popular compound indices are up to
the task of an overall assessment of interrelated environmental, social and eco-
nomic concerns.
Further Reading
FR 4.1 Basic Statistical Systems
Figure 4.1 presents the main statistical systems and frameworks of the United
Nations, recommended for worldwide application. Ward (2004) gives an overview
of the history of all statistics developed and promoted by the United Nations.
Further Reading 83
Box 4.6 A reductionist view
SUSTAINABLE DEVELOPMENT
⇓
SUSTAINABLE ECONOMIC GROWTH
⇓
ENVIRONMENTALLY
SUSTAINABLE GROWTH
⇓
[Climate change]
⇓
Economic growth with CO
2
control
84 4 Statistics and Indicators
The System of National Accounts (SNA) (United Nations et al., 1993) evolved
out of interest in financing the Second World War mobilization and post-war recov-
ery through economic growth. The initial focus on national ‘income’ accounting
soon expanded to record all economic activity related to production, consumption,
investment and foreign trade. A more concise introduction to the voluminous
publication facilitates access to the complex accounting system for data users and
‘first-time accountants’ (United Nations, 2004). Another handbook of national
accounting discusses use in policymaking and modelling, including green account-
ing (United Nations, 2002b).
In analogy to the SNA, the System of Social and Demographic Statistics
(SSDS) (United Nations 1975) presented stocks and flows of individuals and
social groups and their economic and social activities in an accounting system
of life sequences, time budgets and cost-benefit distributions. Lacking a
common numéraire and unifying theory, the United Nations Statistical Office
abandoned the system approach for a Framework for developing and integrat-
ing Social and Demographic Statistics (FSDS) (United Nations, 1979); the
result is a framework for the development of social indicators [FR 4.3].
In the field of environment, the same reasoning about the lack of a numéraire
and theory brought about the Framework for the Development of Environment
Statistics (FDES) (United Nations, 1984). The framework represents a combina-
tion of four common approaches (United Nations, 1982): the environmental
media, stress-response, accounting, and ecological approaches. The latter repre-
sent a particular field of statistical analysis, referred to, often synonymously, as
ecological statistics or statistical ecology (see, e.g. the journal Environmental and
Ecological Statistics).
FR 4.2 Cross-disciplinary Statistical Systems
Figure 4.1 also displays cross-disciplinary statistics as interfaces in the Venn
diagram. Besides the environmental-economic accounts of the MFA and SEEA
( discussed in Chs. 6 to 8), Social Accounting Matrices (SAM) record the inter-
actions between social groups and the economy. They expand the national
accounts for the measurement of income distribution and labour market activities
(United Nations et al., 1993, ch. XX). Data systems of environment-population
interaction are least developed. The Population Division of the United Nations
(2005) developed a Population, Resources, Environment and Development
(PRED) databank, which seeks to capture some of the relations between these
areas. Ehrlich and Holdren (1971) advanced in the early 1970s the I = PAT
identity (see Ch. 13, Introduction). Harrison and Pearce (2000) used the equa-
tion as a framework for an atlas on population and environment; Waggoner and
Ausubel (2002) applied IPAT for a systematic approach to ‘sustainability
science’ (cf. FR 2.2).
FR 4.3 Social and Environmental Indicators
Social and environmental indicators were developed independently. The social
indicator movement of the 1970s aimed at measuring the human quality of life
as an alternative to economic (monetary) indicators (Drewnowsky, 1970,
1974; OECD, 1973, 1976). However, the quality of life and social indicator
movements fizzled out when no agreement on the concept and its measure-
ment could be reached (Hankiss, 1983). At the global level, only a ‘minimum
list’ of social indicators for the follow-up of United Nations conferences on
children, population and development, social development, and women sur-
vived (
It remains to be seen if new attempts at a revival of quality of life measurement
(Fergany, 1994, Henderson et al., 2000) will succeed in establishing these
measures in recurrent (official) statistics.
Many national environmental agencies compile now environmental indicators as
part of, or separate from, state of the environment reports. At the international level,
the OECD compiles regularly ‘core’, ‘key’ and ‘sectoral’ environmental indicators
(OECD, 2003). The European Environment Agency publishes ‘environmental
issues’ and ‘environmental headline’ indicators, and ‘environmental signals’
reports ( />FR 4.4 Sustainable Development Indicators
The pressure-state-response framework and its derivatives are now widely accepted
tools for identifying, defining and organizing sustainable development indicators.
The resulting indicators still differ, however, because the frameworks encompass
different aspects of sustainable development, including particular ‘themes’
(Adriaanse, 1993; United Nations, 2001b; Eurostat: />portal/page?_pageid = 1998,47433161,1998_47437052&_dad = portal&_schema
= PORTAL), ‘issues’ (Kerr, 1997 for Environment Canada; OECD, 2003), ‘syndromes’
(Lüdeke & Petschel-Held, 1997), ‘(sub)systems’ (Bossel, 1999) or ‘policy fields’
(Guinomet et al., 1997 for the European Union). Moldan et al. (1997) give an overview
of approaches to developing indicators of sustainable development.
Time will show whether the ‘core set’ of indicators of sustainable development
of the United Nations (2001b) or its current attempt at revision (.
org/esa/sustdev/natlinfo/indicators/isd.htm) will become the standard tool of
assessing sustainable development. At present, the more practical, but limited (as
far as sustainability is concerned) Millennium Development Goal indicators of
the United Nations (
appear to be more popular on the international stage. The International Institute
for Sustainable Development (IISD) hosts a web site, which permits entries by
indicator developers into a ‘Compendium of Sustainable Development Indicators
Further Reading 85
86 4 Statistics and Indicators
Initiatives’; in March 2004, the Compendium included about 600 initiatives by
individuals, governments, NGOs and international organizations (http://www.
iisd.org/publications/pub.aspx?id = 607).
FR 4.5 Climate Change Assessment
The fourth assessment report by the Intergovernmental Panel on Climate Change
(IPCC 2007; provides the most authoritative assessment and
prediction of global warming and its effects. The Climate Analysis and Indicators
Project of the World Resources Institute presents climate indicators for countries
and economic sectors in support of the United Nations Climate Convention (http://
climate.wri.org/cait-project-93.html). Section 6.2 (Fig. 6.1) describes the green-
house effect as a change in the global energy balance.
Mainstream economists expressed doubts about previous findings of the IPCC,
stressing uncertainties in predicting the impacts of global warming (Beckerman,
1992; Nordhaus, 1998). Nordhaus and Boyer (2000) argue, with an optimal growth
model, that setting limits to greenhouse gas emissions in the Kyoto Protocol lacks an
assessment of implementation costs and benefits and achieves little in mitigating
potentially high long-term damage. As discussed in the text, the Stern (2007) Review
( />climate_change/stern_review_report.cfm) does estimate the costs and benefits of
tackling climate change. A Wikipedia web site provides an overview of first (positive
and negative) reactions to the Review ( />Sounds and sights of Al Gore’s ‘An inconvenient truth’ can be found on the movie
trailer (
For world coverage of the Live Earth concerts see />Review and Exploration
●
A picture is said to be worth a thousand words. A statistical table may be worth
a thousand pictures?
●
Explain the difference between a statistical framework and system.
●
Why do we need cross-disciplinary data frameworks? Describe the flows of nat-
ural resources in Fig. 4.3.
●
What is the purpose of an indicator, as compared to a statistical variable? How
can they help decision-making?
●
Do the different indicator lists assess sustainability in economic growth and
development? If so, how?
●
Is there a communication gap between data users and producers? See also
Sections 7.1 and 8.4.
●
Does global warming adequately represent environmental and sustainability
problems? What do cost and damage estimates tell us?
Chapter 5
Aggregation: From Indicators to Indices
Chapter 3 raised the question of quantifiability of the broad notion of develop-
ment and its sustainability. The tentative conclusion was that the all-encompassing
paradigm’s promise of wealth and well-being for everyone appears to be rather
empty, in the absence of verifiable results. The presentation of indicators for
sustainable development in Chapter 4 neither confirms nor repeals this conjecture:
assorted indicators fail to establish their contributions to sustainable development
in a comparative manner; they cannot assess, therefore, overall progress towards
implementing the paradigm’s goals. For this, we need an index of sustainable
development, which is built up comprehensively and consistently from the basic
data. This chapter reviews critically different aggregation methods and the resulting
indices as to their ability of conveying a coherent picture of sustainability.
The flaws of these approaches direct us to the more systematic physical accounts
and balances of Chapter 6.
5.1 Aggregation Methods
Building a compound index from indicators or statistical variables requires weight-
ing the component variables according to their contribution to the overall index
goal. The weighting problem is critical to both, ad hoc index calculations and to
more systematic accounting (dealt with in Chs. 6–8). A brief review of different
aggregation methods [FR 5.1] helps evaluate the numerous attempts at assessing
environmental quality and sustainable development. Aggregation methods can be
roughly categorized as judgemental, mathematical, scientific and empirical.
5.1.1 Judgemental Methods of Indicator Evaluation
Judgemental methods range from relatively informal, qualitative evaluations of dif-
ferent indicators to explicit procedures of reaching consensus in such evaluations.
P. Bartelmus, Quantitative Eco-nomics, 87
© Springer Science + Business Media B.V. 2008
88 5 Aggregation: From Indicators to Indices
Facial icons added to indicators of the European Environmental Agency (EEA)
(Table 5.1) are an example of a qualitative evaluation of a relatively short list of envi-
ronmental indicators. The Environmental Signals report
1
describes these icons as
J Positive trend, moving towards target
K Some positive development, but either insufficient to reach target or mixed
trends within the indicators
L Unfavourable trend.
Even then, the reader will be hard-pressed to give an overall evaluation of the
European environmental state and its potential trend. Traffic lights, ranging from
red alert, via yellow wait-and-see, to green o.k., are a similar, more advocatory
presentation.
A first step from personal indicator evaluation to aggregative assessment is the
simultaneous presentation of indicators in a geographical context, i.e. by overlaying
indicators in maps. Such overlaying implies a possible correlation of one or more
1
/>Table 5.1
EEA indicator assessment
Environmental issue Indicator Assessment
Tackling climate change
Emissions of green-
house gases
Trend in emissions and distance to 2008–2012 Kyoto
target
K
Nature and biodiversity – protecting a unique resource
Forest resources Annual tree fellings
J
Land resources Land take and fragmentation of large habitats
L
Emissions of acidify-
ing substances
Trend in emissions and distance to 2010 EU target
J
Environment and health
Emissions of ozone
precursors
Trends in emissions and distance to 2010 EU target
K
Urban air quality Exceedance of ozone, fine particles, SO
2
, NO
2
K
Freshwater pollution Concentration of phosphate and nitrate in rivers
K
Sustainable use of natural resources and management of wastes
Material consump-
tion
Total material requirement (vs. GDP)
K
Fish stocks Spawning stock biomass of the North Sea cod stock
L
Urban waste genera-
tion
Trends in levels of municipal waste collected
L
Water use Water exploitation index
K
Land take by devel-
opment
Trends in built-up area, population and road network
density
L
Source:
/>indicators with regional characteristics. Plate 5.1 puts the above-described environmental
surrogate of global warming into the world geography. The first part of the figure
depicts a possible link of global warming to the colder areas of the Northern hemi-
sphere. The figure also shows the limitations of such presentation, leaving a general
impression of beneficial milder climates in the North. The lower part of the picture
indicates, however, reduced precipitation and drought in subtropical countries as a fur-
ther potential effect of global warming. Combining the two maps (and other mapped
effects such as natural disasters) is not a solution since it would overload the graphical
presentation. Judgemental selection, implicit equal weighting of indicators, and limited
presentational capacity are the drawbacks of overlay mapping.
Plate 5.1 Overlay mapping: global warming and precipitation effects
Source: UNEP/GRID-Arendal (2005), Vital Climate Change Graphics. (See Colour Plates)
5.1 Aggregation Methods 89