Quantitative Economics How sustainable are our economies by Peter Bartelmus_6 pdf
Bạn đang xem bản rút gọn của tài liệu. Xem và tải ngay bản đầy đủ của tài liệu tại đây (539.92 KB, 22 trang )
112 6 Energy and Material Flow Accounting
6.2.3 Energy Theory of Value
Exergy and emergy accounts convert different material and energy flows into the
common numéraire of energy units of joule or watt. The purpose is to compare the
relative importance of these flows for different final uses in particular production proc-
esses, natural systems, society or the biosphere. There is however a major difference
between exergy and emergy accounting with regard to the reach of energy valuation.
Exergy analysis can link up with economic activity by including a further
primary production factor, energy, in addition to labour and capital in the produc-
tion function of the economy (Ayres & Warr, 2002). Exergy accounting thus serves
productivity, efficiency and growth analyses of particular production processes or
the whole economy. It does not attempt to replace economic valuation and analysis
with a theory of energetic value. Consequently, exergy analysis appears to have
found an accepted niche in economic-environmental analysis.
3
In contrast, emergy accounts adhere to the above-described energetic dogma.
From this point of view, expressing the value of goods and services in energy terms
permits to avoid bias in economic preferences and valuation. As a consequence,
‘human-centred’ (utility) values are rejected in favour of a ‘valuation system free of
human bias’: ‘emergy is a biosphere value, it is the energy the biosphere invests in its
goods and services (including the goods and services of society)’ (Brown & Ulgiati,
1999). Science should thus overrule short-sighted human preference when its findings
indicate that the ultimate limits of energy supply are about to be reached.
This deeply environmentalist reasoning assumes that the biosphere’s ‘priority’ is
its own preservation. Accounting for the – physical – energetic inputs needed for
maintaining natural systems would determine the necessary minimum level of pres-
ervation and sustainability. There is thus less interest in the outputs of natural sys-
tems for meeting human needs and wants. This becomes quite obvious when
describing emergy flows in terms of economic accounting principles and tech-
niques such as input-output tabulation. Costanza (1980) showed that treating final
economic consumption as just another energy input into the ‘human ecosystem’
justifies expressing all product flows in embodied energy values. As a result the
only final output remaining in this expanded system is net capital accumulation.
4
It is no surprise that economists and policymakers did not accept this paradigm
of human activity, which sees capital accumulation, rather than welfare-creating
goods and services, as the only output (purpose?) of economic activity. Still, such
accounting presents an interesting, albeit extreme ecological perception of humans
and their environment. The validity of this view depends of course on the closeness
of mankind to environmental disaster: imminent catastrophe would indeed override
any economic valuation in favour of nature’s goal of self-preservation.
3
However, official statistics still ignores energy accounting in both conventional and green
accounting (Chs. 7, 8).
4
Modified physical input-output tables take a similar approach, in terms of the mass (weight) of
material flows (see Section 6.3.4).
Still, energy accountants seek to construe some links to economic analysis by
couching energy accounts in money values. The idea is to relate circulating money
or GDP to emergy flows. Assuming constancy of the emergy/money ratio across
economic sectors, sectoral emergy use could be expressed in so-called em-dollars
(em$) by dividing a sector j’s emergy E
j
by the E/GDP ratio (Wall, 2001a, Odum,
2002). One study does indeed indicate a high correlation between sectoral output
in dollars and embodied energy, except for primary energy use (Costanza, 1980).
However, the interpretation of the national em$ flow as the ‘money circulation,
whose buying power is supplied by use of a quantity of emergy’ (Odum, 2002), or
(globally) as ‘the amount of GWP [gross world product] that results from the emergy
flow’ (Brown & Ulgiati, 1999) is rather obscure.
5
In the final analysis, the purpose
of em$ valuation seems just to raise the popularity of emergy accounting ‘since
people do not think in emergy units’ (Odum, 2002).
Apart from possible ignorance about energy accounting and analysis by social
scientists and national accountants, there are three major obstacles to making such
accounting a standard tool of assessing sustainability:
●
Inconvertibility (in practical measurement) of matter and different energy
sources into a common energy unit
●
Lack of knowledge about, and differing measurement methods for, a multitude
of energy transformation processes, and most importantly,
●
Incompatibility of energy value theory with economic choice and preferences.
The following section introduces material flow accounts as an alternative to energy
accounting. Material flows are easier to observe and measure while covering com-
prehensively both energy and non-energy materials. On the other hand, their use of
weight units raises questions similar to those of energy valuation.
6.3 Material Flow Accounting
The relative ease of definition and measurement of material flows appeals to
national statistical offices under pressure to launch environmental accounting.
Physical accounting can be added to their statistical work without affecting the
centrepiece of official statistics, the national accounts (cf. Section 7.3). Ecological
economists agree with this focus on physical accounts. As discussed in Section
2.4.2, they advocate material throughput analysis for assessing the ecological non-
sustainability of economic activity.
European countries were the first to implement material flow accounts (MFA).
In response, the statistical office of the European Commission, Eurostat (2001),
prepared a methodological guide as a first step towards harmonizing concepts and
5
Is it the one, or the other? How does GWP ‘result’ from the emergy flow? What is the connection
of purchasing power with money circulation?
6.3 Material Flow Accounting 113
114 6 Energy and Material Flow Accounting
methods. More ambitious physical input-output tables connect material flows to
economic sectors and provide thus a direct link to economic accounting and
analysis [FR 6.2].
6.3.1 Concepts, Methods and Indicators
Georgescu-Roegen’s admonition that matter – just as energy – is ruled not only by
the first but also by the second thermodynamic law provides the incentive to
account for both energy and material flows. Ayres and Kneese (1969) first proposed
material and energy balances (MEB). Later, Ayres (1976) presented these balances
as a framework for environment statistics to the international community. The MEB
seek to measure material and energy inputs from the environment to the economy,
their transformation in economic production and consumption processes, and their
return to the environment as wastes and residuals.
The United Nations Statistical Commission rejected this presentation as ‘a good
paper for the long term’ (United Nations, 1977a). The rejection delayed the further
development of MEB for almost 20 years that is until the United Nations Statistics
Division advanced the System for integrated Environmental and Economic
Accounting (SEEA) (United Nations, 1993). The SEEA incorporated material and
residual flows in somewhat aggregated form in its physical accounts. The revised
SEEA-2003 (United Nations et al., in prep.) takes up the ‘economy-wide MFA’ but
takes a dim view of their policy use (Section 8.4.1).
The main difference between MFA and MEB is that the MFA treat the economy
as a black box. The MFA thus focus on the big picture of an economy’s sustainability,
in terms of overall natural resource supply to and disposal of residual output from
the national economy (or a particular region). This allows ignoring the myriad of
intra-economy processes, summing up the primary inputs and imports, and residual
outputs and exports, with accumulation of materials in the economy as the balance.
To this end the MFA apply a common measuring rod, the weight of materials. The
MEB, on the other hand, use different units of measurement for different material
inputs and outputs at different transformation stages.
Plate 6.3 depicts the material throughputs through the (blue-coloured) black box
of the economy as inputs and outputs from and to the environment. The plate also
shows ‘translocations’ of unused primary natural resources that had to be moved in
generating the national product. These ‘ecological rucksacks’ do not become a part
of a product but their movements may create considerable environmental distur-
bance. Plate 6.4 shows that an environmental rucksack can exceed by far the weight
of the product itself. According to the Wuppertal Institute for Climate, Environment
and Energy, we need a 2,000 kg rucksack of moving earth and sand to produce a 5 g
gold wedding band.
Plate 6.3 refers to Total Material Requirement (TMR) as the measure of total
input during an accounting period, including the movement of unused materials. As
indicated in the plate, this key indicator of MFA can be related to economic output
6.3 Material Flow Accounting 115
Plate 6.3 Material flows through the economy (See Colour Plates)
Source: S. Bringezu (2000). Ressourcennutzung in Wirtschaftsräumen. Berlin: Springer, cover
page (translated by the author); with permission by the author, VisLab/Wuppertal Institute for
Climate, Environment and Energy, and Springer Science and Business Media.
Plate 6.4
Ecological rucksack of a wedding band: ‘too heavy to marry?’ (See Colour Plates)
Source: Seppo Leinonen, with permission by the artist.
116 6 Energy and Material Flow Accounting
as material or resource productivity (GDP/TMR), or material intensity of a population’s
resource use (TMR p.c., p.a.). Table 6.1 shows the accounting definitions of TMR
and other input and output indicators.
All these indicators endeavour to measure environmental impacts from material
throughput. However, the weight of ecological rucksacks frequently overwhelms
the weight of material inputs and of the ultimate products. Ignoring the rucksacks
contained in TMR allows the compilation of simplified indicators, in particular
Direct Material Input (DMI) and Domestic Material Consumption (DMC). DMI
consists of domestic extraction and import of primary materials; it includes materi-
als that are exported. DMC deducts these exports to describe the use of materials in
the national economy. Both indicators are in fact more consistent with national
accounts conventions.
TMR measures the overall pressure from the use of raw materials on natural
systems by adding up the inputs and ecological rucksacks of primary materials in
tons. Such a pressure is deemed to be indicative of actual and potential environmen-
tal impacts of natural resource use. Reducing the pressure by decreasing material
inflows into the economy represents the ecological sustainability concept of dema-
terialization (Section 2.4). Dematerialization reflects thus a precautionary approach,
which anticipates potentially disastrous and largely unknown environmental effects
(Hinterberger et al., 2000).
On the output side, Total Material Output (TMO) measures the generation of
waste and residuals. The measurement of particularly noxious substances as
selected outputs could assess the success or failure of the ‘detoxification’ of pro-
duction and consumption by pollution control. The EU’s strategy of sustainable
natural resource use (Commission of the European Communities, 2005) views
detoxification as a supplement to dematerialization in a combined strategy of
‘double decoupling’ (see Section 13.3.1). However such a view looks like overkill
since dematerialization eventually decreases wastes and residuals on its own.
TMO and other output indicators seem thus to be less relevant for anticipatory and
comprehensive sustainability analysis. Still, they may help check MFA balances
and ensure the consistency and comprehensiveness of environmental (emission
and waste) statistics.
Net Additions to Stock (NAS) are the balancing item in the accounts. The meaning
of the NAS is controversial. They represent the materials stored in inventories or
durable goods such as buildings, machines and infrastructure. As an environmental
Table 6.1 Material flow balance and derived indicators
Inputs Outputs
Domestic extraction + import Emissions and waste
DMI (Direct Material Input) DPO (Domestic Processed Output)
+ Ecological rucksack (hidden flows) + Disposal of ecological rucksack
+ Export (X)
= TMR (Total Material Requirement) = TMO (Total Material Output)
= DPO + X + NAS (Net Additions to Stock)
pressure index NAS reflect to some extent increased land use through built-up
areas. However, area statistics are probably better (direct) measures of land use.
Another interpretation views the accumulation of materials in the economy as
physical growth of the economy (Bringezu & Moriguchi, 2002). Daly (1996), on
the other hand, considers aggregate throughput as the physical growth indicator
when calling for zero growth in a ‘steady-state economy’.
6.3.2 Results
Figure 6.2 presents, for the region of the European Union (EU), the material flows
depicted in Plate 6.3. Total material input of 18.5 billion tons exceeds total output
by 3.7 billion tons, i.e. by the accumulation of materials in the region. The highly
aggregated flows do reveal some structural characteristics of material flows in and
out of the EU (Bringezu, 2002):
Fig. 6.2 Material flow balance of the European Union 1996 (million tons)
Source: Bringezu (2002), fig. 2.1.
6.3 Material Flow Accounting 117
118 6 Energy and Material Flow Accounting
●
The movement of abiotic (non-renewable) raw materials is four times the flow
of biotic (renewable) materials.
●
The ecological rucksack of intra-EU extraction of abiotic resources exceeds the
used-in-production part of these resources by 11%.
●
Biotic agricultural resources are associated with an ecological rucksack of 0.5
tons erosion per ton of biomass.
●
NAS are about 20% of total material input, indicating physical economic growth
of the region.
●
Waste dumping is 11 times the amount of controlled waste disposal.
Note that water inputs and (waste water) outputs are excluded because the inclusion of
their huge amounts would indeed ‘drown’ the TMR by several orders of magnitude.
The purpose of dematerialization is to delink economic growth from the consump-
tion of primary materials and its potential environmental impacts. Figure 6.3 plots the
changes of TMR per capita against growth of GDP per capita for selected countries.
TMR per capita seems to be levelling off for the industrialized countries at about 80
tons p.a., except for Japan, at 40 tons, due to its low per capita energy consumption.
Low TMR per capita in Poland and China reflects these countries’ relatively low levels
of per capita economic output (in the 1990s). Upward-pointing arrows indicate that
these (and probably other developing and transition countries) might well catch up
with the high-material-intensity economies of industrialized nations.
0 5 10 15 20 25 30
USA
Germany
West-Germany
Japan
Netherlands
Poland
TMR per capita (t)
Finland
China
GDP per capita (‘000 US$)
b
0
20
40
60
80
100
120
Fig. 6.3 Material use and economic growth in selected countries
a
Notes:
a
China 1989–1996, Germany 1991–1996, Japan 1975–1994, Poland 1992–1997, USA
1975–1994, West Germany 1975–1990.
b
GDP in 1990 prices and exchange rates.
Source: Bringezu (2002, fig. 2.3).
In general, there is some relative delinkage from growing GDP. However, relative
dematerialization implies growing material use and pressure on natural systems with
faster growing GDP. Most of the economies presented in Fig. 6.3 have thus not
dematerialized in absolute terms and are still a far cry from sustainability standards
such as Factors 4 or 10. Japan seems to comply with the Factor 4 standard of about
half the other industrialized countries’ TMR per capita and growing GDP. However,
an upward trend of material use signals increasing ‘materialization’ of the economy.
Germany is also an exception for more political reasons. Diminished overburden
from the closure of unprofitable lignite mines in the new States (neue Länder) after
the country’s reunification explains the absolute decrease in TMR per capita.
Converging arrows of Germany and West Germany indicate that West Germany’s
production and consumption patterns and concomitant constant high level of mate-
rial use might soon prevail.
Figure 6.4 illustrates the huge inflation of material use if one accounts for ecological
rucksacks (about two thirds of TMR in the average). Import from other countries
generates much of these rucksacks. Except for the USA and China, whose TMR is
largely domestic (Bringezu et al., 2004), at least part of the economic growth has been
facilitated by importing sustainability, possibly from developing countries. Such
‘burden shifting’ of environmental pressure to other countries is particularly relevant
in the EU, whose member states appear to rely increasingly on foreign resources
(op. cit.). Globalization, together with domestic resource depletion, are significant
factors in this outsourcing of natural resource supply (Section 14.1).
6.3.3 Critique: Ton Ideology, Early Warning or Policy Guide?
In their aggregate form, MFA provide better warning about environmental trends
than indices based on averages of selected indicators (cf. Section 5.3). The grounding
0
10
20
30
40
50
60
70
80
90
USA Czech
Rep.
Japan Poland
Rucksack
TMR
Neth. China
Fig. 6.4 TMR per capita and ecological rucksack (tons)
Source: Bringezu et al. (2004), table 2, p. 102; with permission by the copyright holder, Elsevier.
6.3 Material Flow Accounting 119
120 6 Energy and Material Flow Accounting
on physical laws and comprehensive accounting makes the MFA internally consistent
and applicable to a wide range of environmental concerns. However, the total weight
of primary materials used does not adequately reflect natural resource depletion and
environmental degradation. There is no clear and direct link between material inputs
and the depletion of stocks of (renewable) natural assets. Nor do material flows cre-
ate uniform and equally hazardous damages when they are used in production and
consumption and disposed of as waste and pollutants. Weighting by the weight of
materials ignores different impact potentials of materials and excludes other envi-
ronmental functions and effects such as land use, biodiversity, the ethical and aes-
thetic appreciation of nature, and the effects of physical impacts on human health
and well-being. There are at least two attempts at countering this criticism.
One is to modify the MFA indicators by weighting them with environmental
impact factors. A report commissioned by the EU (van der Voet et al., 2005) intro-
duces an Environmentally weighted Material Consumption (EMC) indicator. The
EMC calculates the weights for different materials consumed by means of life cycle
analysis, which assesses the environmental impacts of each material from its cradle
(extraction, import) to its grave (disposal) (see Section 9.1.2). Admittedly, the EMC
faces a number of ‘obstacles’, which include
●
Distinguishing raw materials from finished materials and a corresponding risk
of double-counting materials and impacts
●
Tracing and combining (by equal weighting!) the different impacts for each
material into one impact factor
●
Omission of depletion, i.e. impacts of permanent losses of renewable resource
stocks
●
Uncertainties about toxicity.
The reference to toxicity indicates that physical impact weights still do not cap-
ture health and welfare effects – neither in terms of physical damage to humans
and non-humans, nor by some kind of valuation or evaluation by those suffering
the damage. Finally, correlation of the weighted EMC with unweighted direct
material consumption (DMC) is low (R
2
= 0.56); the easier-to-compile DMC of
the standard MFA does not accurately present, therefore, actual or potential envi-
ronmental impacts.
Another attempt at ensuring the validity of MFA softens the analytical use of its
indicators. MFA-derived radical prescriptions such as the tenfold reduction of
material inputs (Factor 10 Club, 1994) drew fears of ‘eco-dictatorship’ and ‘ton
ideology’ (Gawel, 1998).
6
Later interpretations of Factors 4 or 10 view these targets
as ‘guard rails’ rather than strict policy objectives (Section 2.4.2). Such guard rails
refer to an environmental corridor, within which economic activities can be played
6
There has been some heated argument on the risks and merits of material flow analysis vs. neoclas-
sical environmental economics in Germany: see in particular Gawel (1998) criticizing ‘material
flow economics’ for its inefficiency and interventionist ideology, with Hinterberger et al. (1999)
presenting the counter-critique.
out without harming the environment. The Factor X authors, or at least their disciples,
seem thus to have grown doubts about the use of MFA as a decision-making tool;
they appear to favour using MFA indicators for warning about violations of a
largely unspecified environmental space (cf. Section 2.4.1).
A first step towards throwing some light on the environmental space available for
national economic performance is to find out what is happening within the black box
of material flow accounting. Linking the material flows to different production and
consumption processes requires disaggregation, i.e. greater detail in primary
resource input and residual output. This would permit tracing environmental impacts
back to their causes, and possibly forward to the damage on humans and ecosystems.
Physical input-output tables achieve this linkage of environmental impacts with
economic activities.
6.3.4 Physical Input-Output Tables
A physical input-output table (PIOT) fills the black box of the economy with details
on material flows, in consistency with the national accounts.
7
The PIOT’s usually
large number of economic sectors shows sectoral supply (output) and use (input) of
materials and products.
Compared to a conventional PIOT, a greened PIOT introduces MFA categories
of raw materials as primary inputs into the economy and residuals of wastes and
pollutants as final outputs of the economy. For instance, the German PIOT [FR 6.2]
presents 58 branches of economic activity, 9 raw materials, 49 categories of prod-
ucts and 11 residuals. On the other hand, the physical tables, usually measured in
tons, do not account for non-material flows of labour or other non-material services.
The focus of an environmentally expanded PIOT is thus – just like the MFA – the
flow of material throughput but with added detail on their transformation in produc-
tion and consumption. In this they resemble the originally advanced MEB (Section
6.3.1), but with reduced and hence more manageable detail of production and
consumption processes.
As in the MFA, the law of conservation of matter also holds for the individual
sectors of the PIOT, with inputs equalizing outputs. Of course, the corresponding
sectoral balances need calibration since residual outputs might not necessarily
occur in the accounting period, which recorded the original material inputs. One
could either assume in this case that all discharges and uses of materials take place
in the same period, or one would have to introduce a balancing NAS item.
Table 6.2 is the aggregated PIOT for Germany with the economic sectors defined
in consistence with the monetary input-output system and the national accounts.
7
The standard system of national accounts, the SNA, treats (monetary) input-output tables as an
integral part of its supply and use accounts. The PIOT represent the physical counterpart of the
monetary tables.
6.3 Material Flow Accounting 121
122 6 Energy and Material Flow Accounting
The supply rows include imports of materials and products as input to the different
sectors. Exports (X), on the other hand, are a separate final use category, shown
together with final consumption (C) and capital formation (∆ CAP). The production
sector P consists of the 58 branches, which supply physical products to each other
and final use. Both households (HH) and industries produce residual outputs. The
residuals are either recycled or captured in environmental protection, a production
activity, or dumped into the natural environment. Discharges to the environment
generate an increase in the natural (non-produced) ‘assets’ part of ∆ CAP.
The German PIOT ejects the primary production factor labour as a non-material
service, but retains the final demand categories of the national accounts. A more
radical eco-centric approach – as encountered above in emergy accounts (Section
6.2.3) – treats household consumption as an input into the ‘national ecosystem’.
This ‘endogenizes’ (Strassert, 2000) all household activity into the production sec-
tor. Such endogenization treats both enterprises and households as producers. The
expanded production or material ‘transformation’ process absorbs final consump-
tion of households as indicated by arrows in Table 6.2. Exports, capital formation
and the accumulation of wastes and residuals remain as the only final outputs of the
domestic transformation processes.
As a result, Germany’s physical GDP of 3,603 million tons (C + ∆ CAP, pro-
duced + X-M) declines drastically down to 528 million tons (∆ CAP, produced +
X-M)
8
, unless the new final output of mostly waste and residuals from conventional
(enterprise) production (48,295 million tons) and residuals and natural resources
from household production (700 million tons) is added. The overwhelming load of
residuals creates a far-from-desirable final output of the economy. The remaining
physical GDP amounts to only about 6% of total material output, and about 7% of
the (weight of) residuals.
The meaning of these overall tonnages and their respective sizes is opaque. It is
obviously not an indication of the value or significance of economic production, con-
Table 6.2 Physical input-output table, Germany 1990 (million tons)
Input
Output
Transformation ∆ Cap
Total
material
useP (HH) C
Produced
assets
Non- produced
natural assets X
P 7,577 3,075 713 48,295 208 59,868
HH 2,645 11 700 3,356
D CAP
49,252 281
b
20 56 0 49,609
Total mate-
rial supply
a
59,474 3,356 744 49,051 208 112,833
Notes:
a
Total material supply = direct material input (DMI).
b
Consumption of non-produced
natural resources by households.
Source: Stahmer et al. (1998, table 12, modified and aggregated).
8
With M = –393 million tons (not shown in Table 6.2).
sumption and (produced or natural non-produced) capital formation. This might
explain why some ecological economists, while shunning the ‘human bias’ of market
valuation, revived Sraffian system-inherent pricing as the dual solution of a linear
programming system (Strassert, 2001; Friend, 2004). Such pricing avoids market
valuation by reflecting the inherent technology and preset ecological and economic
restrictions of the linear programming model (see Section 12.2). It is unable and
decidedly unwilling to take human preferences for goods and services into account.
Apart from these radical changes in production and consumption concepts,
PIOT of the more traditional kind serves a number of statistical and analytical uses
(Eurostat, 2001), including
●
Statistical checks for balances and consistency with accounting identities
●
Assessment of material use efficiencies
●
Intermediate tabulation of resource use and emissions for monetary environmental
accounting (Section 7.3)
●
Assessment of direct and indirect environmental impacts of products and
services, covering the whole production chain
●
Decomposition analyses, which assess the influence of overall economic growth
and technological and structural change on environmental impacts
●
Modelling of trends and scenarios of environmental impacts for different
production and consumption patterns and economic growth rates.
The fourth part of the book will explore the analytical uses of input-output modelling.
Further Reading
FR 6.1 Energy Concepts and Accounting
The analysis of available energy or exergy for the efficiency of economic processes has
tradition (e.g. Soddy, 1933; Slesser, 1975; Gilliland, 1978; Martinez-Alier, 1987;
Szargut et al., 1988). More recently, Ayres et al. (1998) and various contributors to the
Encyclopedia of Life Support Systems (Tolba, 2001; Brodianski, 2001; Frangopoulos,
2001; Szargut, 2001; Wall, 2001b) advanced exergy for valuation and sustainability
analysis in energy accounts. Assigning an economic value to exergy flows is the task
of ‘thermoeconomic accounting’ (Wall, 2001a). Odum (1996, 2002) and his disciples,
Brown and Ulgiati (1999), suggest similar monetary valuation for emergy flows.
The United Nations Statistics Division ( />ance/default.htm) and the International Energy Agency ( />Textbase/stats/index.asp) prepare more narrowly defined energy balances. These
balances use a common energy unit, i.e. a fuel combustion heat equivalent, which
refers directly to the underlying energy carriers. They can also be linked to the
physical material flow accounts for measuring the ‘energetic metabolism of socie-
ties’ (Haberl, 2001). Bartelmus (2004) describes the relationship of such accounting
with greened national accounts and physical input-output tables.
Further Reading 123
124 6 Energy and Material Flow Accounting
FR 6.2 Material Flow Analysis and Accounting
Fischer-Kowalski (1998), Fischer-Kowalski and Hüttler (1999) and Ayres (1989)
made societal or industrial metabolism the underlying principle of material flow
analysis. Ayres and Kneese (1969) pioneered material and energy balances (MEB)
that showed not only inputs into and outputs from the economy but also the trans-
formation of material and energy inputs within the economy. Steurer (1992),
Bringezu (1993) and Schmidt-Bleek (1994) simplified the approach by covering
only those flows in the MFA that cross the boundaries of the economy. International
guidelines (Eurostat, 2001) and applications (Adriaanse et al., 1997; Matthews et
al., 2000) indicate growing interest in material flow analysis, sometimes under the
umbrella of ‘industrial ecology’ (Ayres & Ayres, 2002). Numerous country projects
of MFA have been carried out under the auspices of the European Union (van der
Voet et al., 2005).
The German Federal Statistical Office pioneered physical input-output tables as
a sectoral extension of the MFA (Stahmer et al., 1998). See [FR 10.1] on input-output
tables and their connection with the national accounts.
Review and Exploration
●
Would you consider social metabolism as just a metaphor for environment-
economy relationships or as the basic principle of material and energy flow
accounting? How do thermodynamic laws apply in such accounting?
●
What are the reasons for replacing market valuation by energy values in regional
or countrywide accounts?
●
Does measurement in weight and energy units reflect the environmental signifi-
cance of material and energy flows? How do these flows assess the
(non)sustainability of economic performance and growth?
●
How does Fig. 6.3 indicate delinkage of economic growth from environmental
impacts? Do we need a sustainability standard to assess the ecological sustaina-
bility of economic growth?
●
How do the MFA measure the import/export of sustainability (burden shifting)
from/to other countries?
●
Is NAS a good indicator of physical economic growth? How does it compare to
Daly’s concept of physical (throughput) growth?
●
Compare the approaches of PIOT and MFA and their sustainability assessments.
What is the meaning of a physical GDP in PIOT?
●
Can the monetization of energy and material flows in emergy-dollars or by
input-output inherent pricing assess the economic and environmental signifi-
cance of physical flows?
Part III
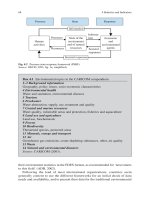
Greening the Economic Accounts
This part follows up on the ecological/physical vs. economic/monetary dichotomy in
environmental accounting and analysis. The economic approach extends economic
valuation to physical environmental impacts within the worldwide-adopted System of
National Accounts, the SNA. Figure 7.1 illustrates the dichotomy in environmental-
economic accounting. It distinguishes between the physical accounts described in
Part II, and hybrid (mixed physical and monetary) and monetary accounts of this
part. The figure also displays the links of environmental accounting to data sources
(Ch. 4) and uses (explored in Parts IV and V).
Chapter 7 first examines ad hoc monetary index calculations. The indices
attempt to measure economic welfare by adding positive effects and deducting
negative ones from conventional accounting indicators. The flaws of these
corrections make the case for embedding the costing of environmental impacts in
Monetary accounting
SNA
SEEA
Mixed physical-monetary accounting
Accounting
modules
Data sources,
use and
analysis
Data and
Indicators
(FDES, FSDI)
NAMEA, SEEA
Data use,
analysis,
modelling
Data flows
Physical accounting
PIOT/MEB SEEA MFA
Regional accounting
Fig. 7.1 Framework for environmental and economic accounting
Acronyms: see text.
Source: Bartelmus (2001), Accounting for sustainability: Greening the national accounts, fig. 2;
Copyright Eolss, with permission from Eolss.
the more consistent national accounts system. The chapter also describes hybrid
accounts, which one can see as an intermediate step towards monetary environmen-
tal-economic accounting, the topic of Ch. 8. The hybrid accounts thus bridge the
physical-monetary dichotomy by connecting key variables of ecological and
environmental economics. Official statisticians take a different view in the revised
version of the System for Environmental and Economic Accounting (SEEA). They
tend to consider the hybrid accounts as the ultimate goal, with a view to avoiding
controversial monetary valuation of environmental impacts (Section 8.4).
Corporations, concerned with their responsibility for environmental impacts,
have more and more taken up environmental accounting and reporting. Chapter 9
discusses the use of corporate environmental accounts for improving environmental
management and demonstrating social responsibility. The chapter also examines
the usefulness of a ‘micro-macro link’ in green accounting and accounting analysis.
126 Greening the Economic Accounts
Chapter 8
SEEA – The System for Integrated
Environmental and Economic Accounting
US national income accounting set the tone for first attempts at incorporating
environmental and social concerns into the national accounts [FR 8.1]. The
purpose was to modify national income and product, considered to be imper-
fect measures of national welfare. Similar to the above-described welfare indi-
ces (Section 7.1.1), extended income and product accounts and derived
measures of economic welfare deducted ‘defensive’ (welfare maintaining)
expenditures, and added or subtracted environmental and social externalities
to/from the conventional accounts indicators. National statistical offices dis-
missed welfare measurement as ‘more suitable for research than for statistical
compilation’ (United Nations, 1977b). The System of National Accounts
(SNA) later confirmed that ‘GDP is a measure of production’, and ‘changes in
the value of consumption are not the same as changes in welfare’ (United
Nations et al., 1993).
The statisticians did not succeed in muting criticism of the conventional
accounts. ‘Political unease with GNP as a bellwether’ (Ward, 2004) increased with
growing awareness of the role of social and environmental issues in national and
international policies. The environmental critique included the
●
Neglect of scarcities in the availability of natural resources, threatening the sus-
tained productivity of the economy
●
Exclusion of environmental degradation as an externality of economic activity
●
Accounting for expenditures of environmental protection as increase in national
income and product although such outlays could be considered as a maintenance
cost of society.
In response, the United Nations Statistics Division issued a handbook on a System
for integrated Environmental and Economic Accounting, the SEEA (United
Nations, 1993). At first sight, such broad integrated accounting looks like a good
replacement for narrow economic accounting. Conventional national accounts
have, however, a large variety of micro- and macroeconomic uses. Modified standard
indicators of market transactions would obscure the assessment of short-term
economic disequilibria and medium- and long-term business cycles. Conventional eco-
nomic and fiscal policy uses suggest, therefore, developing integrated environmental
P. Bartelmus, Quantitative Eco-nomics, 141
© Springer Science + Business Media B.V. 2008
142 8 SEEA – The System for Integrated Environmental and Economic Accounting
and economic accounting as a satellite (parallel) system of the SNA, rather than a
substitute for the conventional accounts.
1
After a decade of further testing and discussion, the United Nations Statistical
Commission charged the so-called London Group of natural resource and envi-
ronmental accountants with the revision of the SEEA. The revision process
brought out the natural reluctance of official statisticians to embark on new and
controversial issues such as the pricing of non-marketed environmental services.
The result is some bias against aggregation and the modification of economic
accounting indicators, even in satellite accounts.
8.1 Pricing the Priceless
Acceptance or rejection of monetary valuation in green accounting is at the heart
of the ecological-economic dichotomy. Physical accounts acquire some systemic
features by using physical thermodynamic laws in formatting the accounts
for flows of materials, energy and residuals. Aggregating these flows in mass or
energy units meets the requirements of analysing biophysical ecosystems, but not
those of the economic system. To this end, the national accounts cater to economic
preferences for goods and services, expressed in market prices.
Imputing a proxy market value on natural assets and asset services, which are
not traded in markets, is a prerequisite for maintaining the system character of the
national accounts. It is also the only possibility of fully integrating environmental
concerns into the economic accounts. The SEEA ensures in this manner the com-
parability of environmentally adjusted with conventional economic indicators.
Monetary valuation faces its own problems, though. Environmentalists, but also
more conservative national accountants, criticize the imputation of monetary values
on non-market transactions and processes. This section reviews therefore the main
valuation techniques before discussing SEEA concepts and methods.
8.1.1 Market Valuation of Depletion and Degradation
Markets may trade, in some cases, natural resource stocks such as land, timber tracts or
water wells. In these cases, natural assets fetch observable market prices. Frequently,
natural assets are however either owned by governments as a public good or are situated
outside national jurisdiction. In the absence of markets for such common property or
common access resources (cf. Annex I.1), income from the sale of harvested or
1
The Rio Earth Summit confirmed this approach in its Agenda 21: ‘… systems of integrated envi-
ronmental and economic accounting … to be established in all member States at the earliest date
should be seen as a complement to, rather than a substitute for, traditional national accounting’
(United Nations, 1994).
otherwise extracted resources can be used for estimating the economic value of the
resource stocks. The generic approach is to calculate the – discounted – sum of
economic benefits or ‘net returns’ that can be ascribed to the exploitation of a natural
resource over its lifetime. One can argue that it would be at this net present value that a
natural asset would be traded if a market existed for the asset.
The concept of economic rent is central to assessing the value of a scarce, non-
priced category of natural ‘economic’ wealth in situ (Section 7.2); it is also crucial
for defining and understanding the value of the non-sustainable use of natural
wealth, i.e. its depletion (see Annex II). Based on the national accounts concepts of
capital earnings and capital consumption, depletion D is the difference between the
rent (or gross earnings) R
nc
, obtained from natural capital use in production, and the
net return to natural capital NR
nc
.
2
Expressed in net present values, the depletion of
a natural resource reflects the change in value of natural capital from the direct use
in production during the accounting period; it is thus also the difference between the
discounted values of the opening stock OpSt
nc
and the closing stocks ClSt
nc
:
D = R
nc
− NR
nc
= OpSt
nc
− ClSt
nc
(8.1)
Besides the direct use of a resource in production, other changes in its availability
and value stem from natural regeneration, discovery, revision of previous estimates
of resource availability and quality, natural and political events, and changes in the
prices of the resource products. The national accounts include these effects in their
asset accounts as ‘other asset changes’. In line with the (production) cost concept
of the national accounts, the SEEA does not count these ‘other asset changes’,
which are not brought about by production, as depletion cost; on the other hand, it
calculates natural resource depletion (and its cost) net of the natural regeneration of
renewable resources.
In the absence of market prices for natural resource stocks, their valuation has
to discount their future net rents for calculating their net present values.
Environmental accounts typically use a ‘normal rate of return’ to capital of simi-
lar industries, which do not use natural capital, for estimating the portion that
should be allocated to natural capital. The difficulties of predicting and discount-
ing future net returns from natural resource use (Section 2.3.2) are the reasons
for suggesting several simplified valuation techniques (United Nations et al., in
prep., ch. 7).
The net price method makes use of the Hotelling rent assumption of compensat-
ing net price and discount rate increases, so as to dispense with discounting future
net returns. Hotelling (1931) showed that in perfectly competitive markets the net
2
The accounting category of rent should not be confounded with the rent concept of economic
theory, i.e. payment to a production factor in fixed supply (such as land). The earnings from such
a production factor can be conveniently taxed away without losing allocative efficiency. On the
other hand, most natural capital can be depleted and augmented (if renewable), and its taxation
would therefore affect its use and availability.
8.1 Pricing the Priceless 143
144 8 SEEA – The System for Integrated Environmental and Economic Accounting
price of an exhaustible resource, defined as the difference between the market price
p
nc
and the unit marginal cost of extraction c
nc
, will rise at the rate of interest of
alternative investments, offsetting the discount rate. The value-depressing effect of
the discount rate would thus neutralize the future price increase, brought about by
increased scarcity of the exhaustible resource. In this case, the net-price based
depletion value D
np
of the resource approximates its economic rent generated
during the accounting period, especially if the average unit value
nc
and the average
cost
nc
are used as a further simplification (Bartelmus, 1998):
D
np
= (
nc
− c
−
nc
)Q ≈ R
nc
(8.2)
where Q is the physical amount of depletion or extraction (in case of a non-
renewable resource) during the accounting period.
Comparing the depletion value D
np
to the basic definition (8.1) reveals that
D
np
tends to consider all the rent as depletion. In other words, the extraction or
harvest of the resource does not create itself any profit or net return – beyond a
normal return to produced capital. Natural capital may be necessary for income
generation, but all the credit goes to produced capital. As a consequence, the
results of the net price method tend to exaggerate depletion from income-generation
and -allocation points of view. Moreover, the validity of the various assumptions
underlying the Hotelling rule and net price method can be questioned.
Nevertheless, because of its relatively easy calculation, requiring only knowl-
edge of the resource price and average production cost, most case studies of
green accounting (in particular those described in Section 8.3) apply this
convenient method.
In response to the criticisms of the net price method, El Serafy (1989) advanced
another simplified method of calculating depletion, the user cost allowance. He
questioned, in particular, the obliteration of income generated by natural resource
exploitation: ‘Countries with marketable natural resources are evidently better off
than those without such resources’. His method suggests reinvesting a constant part
of the rent generated, the user cost, so as to create a ‘perpetual stream of true
income’ NR
∞
nc
. The user-cost method is a special case of the generic definition of
depletion as the change in net present values of a natural resource; it assumes that
the discount rate and rents remain constant over the lifetime of n years of the
resource (Hartwick & Hageman, 1993). In this case, the perpetual income element
is the difference between the current and last (discounted) rent, and the depletion
(user cost) allowance D
uc
is equal to the discounted last (at the end of its lifetime)
rent generated by resource exploitation:
D
uc
= R
nc
− NR
nc
∞
= R
n
/(1+r)
n
(8.3)
Comparing (8.2) and (8.3) shows that the user cost allowance is indeed only a frac-
tion – of 1/(1+r)
n
– of the depletion allowance calculated by the net price method.
It is therefore useful to calculate both allowances for an estimate of the range of
natural capital loss from natural resource exploitation.
8.1.2 Maintenance Costing of Environmental Degradation
Dealing only with natural resources, which conveniently supply marketable and
hence priced products, reduces drastically economic analysis. Economics is indeed
concerned with scarce goods and services, whether traded in markets or not.
There is no a priori reason why scarcities in environmental services should be
excluded from the analysis. Notably in industrialized countries, environmental
externalities of pollution are usually of far greater importance than natural
resource depletion. The SEEA proposed, therefore, maintenance costing as a way
of valuing the losses of environmental functions that are usually not traded in
markets. Natural resources, whose products are traded, may provide some of
these functions (e.g. erosion control or habitat by forest plantations). Note, how-
ever, that the market prices of their products (e.g. for timber) do not include the
value of these services.
The SEEA defines maintenance costs as those that ‘would have been incurred
if the environment had been used in such a way as not to have affected its future
use’. The maintenance costs refer to the – missed – opportunity of mitigating or
avoiding the environmental impacts caused during the accounting period. Of
course, these costs are generally hypothetical since environmental impacts did
occur and no money was spent on actually tackling the impacts. This is in fact the
most persistent criticism raised against such costing. It is also the argument for
excluding environmental degradation from the monetary accounts and their
indicators.
There is, however, nothing hypothetical about the environmental impacts them-
selves. In order to incorporate these impacts in the national accounts system, main-
tenance costing monetizes the impacts by weighting them according to society’s
obligation and capacity for dealing with environmental concerns. This is probably
the only realistic way of an ex post assessment of environmental social costs, in
consistency with the (similarly hypothetical) ‘replacement cost’ of conventional
capital consumption. In practice, one would have to cost compliance with society’s
environmental (emission) standards where high marginal costs make the total
avoidance cost unrealistic.
3
Markets can in fact provide a maintenance value for nature’s source and sink
functions. Capping emission and natural resource use, and trading permits for the
capped environmental services create a socio-economic scarcity value for the main-
tenance of these services. This value reflects the standard (cap) setter’s and the
market’s evaluation of the social cost of environmental degradation. The annualized
3
Baumol and Oates (1971) recommended a similar approach for measuring the optimal level of
externalities in practice. Cf. Annex I.1 (Fig. I.1, part D) for such costing of standard compliance.
Contrary to the marginal cost assumption in justifying the net price method of market valuation
(Section 8.1.1), maintenance-cost weighting of actual physical impacts works with average cost
observed in the (past) accounting period. Warnings against modelling marginal cost (Radermacher,
1999; United Nations et al., in prep.) in environmental accounts miss the point.
8.1 Pricing the Priceless 145
146 8 SEEA – The System for Integrated Environmental and Economic Accounting
cost of purchasing the permits could and should be treated as a capital depreciation
cost for deduction in environmentally adjusted indicators.
4
Environmental costs are ‘externalities’ that by definition were not internalized,
i.e. actually budgeted, by households and enterprises. However, these costs should
have been accounted for, from society’s social caring and costing points of view.
It is certainly a valid question to ask what would happen to the economy if these
costs were indeed internalized. Such analytic modelling is not the task of descrip-
tive accounting. Chapter 12 (Section 12.1) will take up this question of modelling
a ‘greened-economy GDP’.
On the other hand, individual corporations might actually account for the deple-
tion and degradation of their natural assets (including the annualized cost of envi-
ronmental permits), make provisions for potential liabilities for environmental
damage, or show (and pay for) ‘social responsibility’ (Section 9.1.1) for impacts on
their neighbourhood. The conventional national accounts would in these cases
overstate the net value added generated by these corporations. Green accounting
would then simply correct the distorted information about the (net) production level
and structure of the economy by incorporating environmental costs in the produc-
tion accounts of the different industries.
5
Maintenance costing could also apply to the social costs exported to or
imported from other countries by transboundary pollution. The SEEA largely
ignores accounting for environmental impacts across national borders. In anal-
ogy to capital transfer accounting in the SNA, one could treat ‘international’
externalities as free services or disservices, modifying national income rather
than domestic product. Export of pollutants would thus increase national
income and import would decrease it because of the transfer of a social cost to/
from abroad.
Maintenance costing refers to environmental impacts of the current accounting
period. Extending the costing to the restoration of the environment to desirable
levels, experienced in previous pristine periods, muddies such costing by referring
to a difficult-to-determine situation in the past. The accumulation of environmental
impacts and the cost of recreating this ideal situation (apart from any ‘irreversibili-
ties’) can be viewed as an environmental debt of the current and past generations to
future generations (Section 8.3).
4
The SNA treats the creation of tradable permits of pollution and natural resource use as the
‘appearance of an intangible non-produced asset’. As these permits approach their expiry date
they lose value and should therefore be ‘amortized’ over their lifetime. Both, SNA and SEEA
record the creation and amortization of the permits as ‘other asset changes’, which do not affect
production and capital formation (see Section 8.1.1).
5
In the case of so-called diseconomies, i.e. producer-producer external effects, the receiving enter-
prise will in all probability account for the external cost borne (for instance, in the classical case
of industrial smoke impacts on a laundry). However, this would still represent a distorted cost
allocation according to the polluter-pays principle (Section 13.3.2).
8.1.3 Contingent and Related Damage Valuation
In theory, from an economic optimality point of view, welfare losses or gains, rather
than imputed environmental protection costs, should be internalized. Box 8.1
contrasts production-oriented, supply-side environmental costing with demand-side
valuation of environmental welfare effects. Cost-benefit analyses (CBA) of
programmes and projects (Section 2.3.2) use demand-side valuations of environmental
benefits to assess welfare effects, including environmental damage as loss of bene-
fits. Demand-side valuations include directly stated preferences for environmental
benefits in contingent valuations and indirectly revealed preferences by defensive
expenditures and surrogate markets.
Contingent valuation uses interviews of stakeholders to determine their willingness
to pay or be compensated for environmental services or service losses, contingent
upon hypothetical situations of welfare gains or losses. Other methods such as hedonic
pricing of land and property with different environmental characteristics, or the
travel cost to benefit from protected environmental sites, are indirect indicators of
preferences for environmental amenities. The closeness of welfare valuations to
economic (utility/welfare maximizing) theory makes these valuations the favourite
of textbooks on environmental economics [FR 2.2].
The theoretical desirability of demand-side valuation for internalizing externalities
from a welfare-maximizing point of view should not hide the fact that these valuations are
proxies for utility measurement. Utility estimates are difficult to apply at the project
level and hardly possible to compile at sectoral and national levels. Furthermore,
stress-response reactions frequently delay the generation of environmental damage.
Current accounts face therefore the problems of discounting future effects and tracing
them back to causing agents. Contingent valuations of the willingness to pay or to be
Box 8.1 Supply- and demand-side valuations in accounting and cost-benefit
analysis
A. Supply-side valuation (costing):
●
Natural capital consumption
- Market valuation of natural resource depletion
- Maintenance costing of environmental impacts
●
Environmental protection expenditures
- Capital expenditures
- Operating cost
B. Demand-side valuation (benefits foregone):
●
Expressed preferences (contingent valuation)
●
Revealed preferences
- Hedonic pricing
- Travel cost method
- Defensive expenditures
8.1 Pricing the Priceless 147