Quantitative Economics How sustainable are our economies by Peter Bartelmus_7 docx
Bạn đang xem bản rút gọn của tài liệu. Xem và tải ngay bản đầy đủ của tài liệu tại đây (414.8 KB, 22 trang )
148 8 SEEA – The System for Integrated Environmental and Economic Accounting
compensated are also inconsistent with market prices, the basic valuation principle of
the national accounts. The inconsistency stems from the inclusion of consumer surplus
in willingness to pay declared by individuals. Interview-based valuations also face
problems of free-rider attitudes and consumer ignorance. These are the reasons why
the national accounts do not consider welfare measurement as their main objective,
and focus instead on the market values of goods and services.
A few environmental accounting studies applied contingent and related damage
valuations with questionable results (Section 8.3). The original SEEA focuses, there-
fore, on supply-side valuations, considering the use of welfare valuations as
exploratory and experimental (United Nations, 1993). The SEEA-2003, on the
other hand, deals extensively with CBA valuations, since ‘damage-adjusted income
clearly says something about the country’s revenue-creation capacity under prevail-
ing conditions’ (United Nations et al., in prep.). There is no explanation, however,
how these conditions (including environmental ones) relate to production and
income-generation capacities.
The practical solution for including environmental impacts in environmental
accounting – beyond economic resource accounting – is, therefore, maintenance
costing. ‘Costing the maintenance of environmental “capital” is the anchor, which
prevents environmental accounts from drifting away into the realm of welfare
measurement and analysis’ (Bartelmus, 1998).
8.2 SEEA Objectives, Structure and Indicators
In response to the above-mentioned criticisms of the national accounts, the original
SEEA set the following objectives for greening the accounts (Bartelmus, 2001):
●
Segregation and elaboration of all environment-related flows and stocks of the
conventional national accounts, including environmental protection expenditures
as part of a broader concept of ‘defensive expenditures’
●
Linkage of physical with monetary environmental accounts and balances, with
a view to overcoming the ecological-economic dichotomy
●
Accounting for the maintenance of tangible wealth by covering not only human-made
but also non-produced natural capital and its consumption
●
Assessment of hitherto ignored costs of (1) depletion of natural resources and
(2) impacts on environmental quality, in particular from pollution
●
Definition and measurement of indicators of environmentally adjusted product,
income and capital formation, accounting for the costs of environmental depletion
and degradation as capital consumption.
All these objectives cater to the overall goal of assessing the environmental sustainability
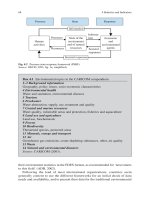
of economic performance and growth. Figure 8.1 shows the accounting indicators
as they emerge from their respective accounts. The figure elaborates on Fig. 7.4,
which illustrated the basic approach of incorporating environmental assets and
asset changes in the conventional national accounts.
Fig. 8.1 SEEA structure and indicators
Source: Bartelmus (2004), fig.3, p.50; with permission by the copyright holder, Elsevier.
8.2 SEEA Objectives, Structure and Indicators 149
OPENING STOCKS Economic assets Environmental assets
+
DOMESTIC
PRODUCTION (industries)
FINAL CONSUMPTION
(households, government)
CAPITAL FORMATION
REST OF THE
WORLD
SUPPLY OF PRODUCTS
Output(O
i
)
Exports (X)
USE OF PRODUCTS
Intermediate consumption
(IC
i
)
Final consumption (C)
Gross capital formation
(CF)
Imports (M)
USE OF FIXED CAPITAL
Fixed capital consumption
(CC
i
)
Fixed capital consumption
(−CC)
Value added (VA), NDP
VA
i
= O
i
− IC
i
− CC
i
NDP = ∑VA
i
USE OF NATURAL
ASSETS (depletion and
degradation)
Environmental cost of
industries (EC
i
)
Environmental cost
of households (EC
h
)
Natural capital consumption
(−EC)
Environmentally-adjusted
indicators
ECF = CF
−
CC
−
EC
+
Other changes of economic
assets
Other changes of
environmental assets
=
CLOSING STOCKS Economic assets
Environmental assets
EVA
i
= VA
i
− EC
i
EDP = ∑ΕVA
i
−
∑ΕC
h
150 8 SEEA – The System for Integrated Environmental and Economic Accounting
8.2.1 Accounting for Sustainability
Chapter 7 discussed the linkage of physical and monetary accounts by extending
the asset definition of the conventional accounts. Broader concepts of capital and
national wealth are the results. Changes in these capital categories in terms of capi-
tal consumption and formation may indicate compliance or non-compliance with
minimum conditions for sustainable economic growth, i.e. capital maintenance
(Section 2.2.3).
Accounting for natural capital consumption and maintenance expands the
sustainability notion that is built into the conventional net indicators of value added,
income and capital formation. In analogy to the wear and tear, i.e. the ultimate
destruction, of capital goods in the production process, one can define natural capital
depletion and irreversible degradation as the permanent loss of parts or all of natural
resource stocks and waste absorption capacities. Accounting conventions thus clar-
ify the contents of physical depletion and degradation as a process of natural capital
consumption by economic activities – beyond regeneration and replenishment and
excluding other non-economic impacts on natural capital. The regeneration of nature
can be seen as a cost-free natural repair process, recorded outside the production and
income accounts as other changes of assets (Section 8.1.1). In contrast, capital con-
sumption creates a private cost of produced capital loss for the owners and a social
cost of environmental depletion and degradation for society.
One could also see the non-sustainable use of a natural resource in production
as the reduction of nature’s ‘inventory’ of (primary) materials. The SNA would
treat the resulting negative change in the value of an inventory of goods as negative
capital formation. The corresponding increase in intermediate consumption and its
deduction in net value added would then obtain the same environmentally adjusted
net indicators as the natural-capital-consumption costing of depletion. Since the
loss of absorptive capacities is difficult to conceptualize as a decrease in the ‘inventory’
of environmental services, the inventory-loss concept is not further explored here.
As discussed in Section 8.1.1 and Annex II, the depletion value represents a loss
in the income/value added generation capacity of a natural asset. Depletion cost
allowances reflect therefore a weak sustainability concept, calling for the reinvest-
ment of these allowances in any income-generating activity. At first sight, mainte-
nance costing of environmental services, discussed above, looks like aiming at the
preservation of environmental functions. However, the strength of sustainability
created by such valuation and accounting depends, of course, on the actual use of
the cost allowance. Investing in the restoration of depleted and degraded natural
capital would indeed reflect strong sustainability. If such use is not possible because
of ‘complementarities’ in capital use (Section 2.3.1) or is ignored, investing in any
other income-generating source would cater to weak sustainability.
Ultimately the strength of sustainability depends on (1) actual cost internalization or
absorption (e.g. by governmental eco-taxation) and (2) on the actual use of the cost
allowance made or tax revenue obtained (cf. Section 13.3.3). Given that such cost inter-
nalization or absorption did not actually take place, it is probably safe to interpret the
adjusted accounting aggregates as indicators reflecting potentially weak sustainability.
Attempts at accounting for other non-produced capital categories, in particular
human and social capital, have not reached the same levels of conceptualization and
measurement as natural capital. Treating education expenditure as capital formation
(as in the genuine savings indicator of the World Bank: see Section 8.2.2) is problem-
atic. Education has benefits of private consumption, and health expenditure would
also have to be considered as contributing to human capital formation and mainte-
nance. Furthermore, the notion of human capital ‘consumption’ as a cost of a produc-
tion process is not very enticing. Even more difficult is the measurement of social
capital, i.e. social coherence and networking within a more or less ‘civil’ society.
At least for now, definition, measurement and valuation problems consign
human and social capital accounting to research rather than recurrent accounting.
One should not forget, though, that determining natural resource rent by deducting
the earnings of produced capital from gross operating surplus generates a residual,
which includes, besides natural capital, other intangible influences on corporate
earnings and profits from production. Note also that assessing the role of financial
wealth in contributing to the sustainability of economic growth needs still further
clarification in analysis and accounting (see Box 8.3, below).
8.2.2 Environmentally Adjusted Macroeconomic Indicators
Figure 8.1 illustrates how the inclusion of natural capital consumption as environ-
mental cost affects the main accounting identities. Most of the environmentally
adjusted economic indicators can be calculated as sum totals and elements of the
following equations:
●
Value-added identity for industry i:
EVA
i
= O
i
− IC
i
− CC
i
− EC
i
= VA
i
− EC
i
(8.4)
describing Environmentally adjusted Value Added EVA
i
generated by an industry i
as the difference of its output O
i
and cost, including intermediate consumption IC
i
,
fixed capital consumption CC
i
, and environmental depletion and degradation EC
i
●
Net domestic-product identity for the whole economy:
EDP = ΣEVA
i
−ΣEC
h
= NDP − EC = C + CF − CC − EC + X − Μ (8.5)
defining Environmentally adjusted net Domestic Product (EDP) as the sum of
environmentally adjusted value added of industries, with a further deduction of environ-
mental costs generated by households EC
h
.
6
Alternatively, and as in the conventional
accounts, EDP can also be calculated as the sum of final uses, including final
6
Deducting the (maintenance) cost of household pollution from NDP treats these emissions as
negative production or natural capital consumption of a sector whose activity is otherwise limited
by definition to (final) consumption.
8.2 SEEA Objectives, Structure and Indicators 151
152 8 SEEA – The System for Integrated Environmental and Economic Accounting
consumption C, Environmentally adjusted net Capital Formation ECF and the balance
of exports X and imports M; ECF is defined as gross capital formation CF minus
produced and natural capital consumption:
ECF = CF − CC − ΕC (8.6)
●
Supply-use identity:
O + M + EC = IC + C + EC + CF + X (8.7)
indicating that the supply of goods and services produced (O = ΣO
i
), imported (M)
and provided by nature (EC, valued at replacement cost) equals their use in intermediate
consumption (IC, ΣEC
i
) and final consumption (C, ΣEC
h
), capital formation CF and
export X, with Σ EC
i,h
= EC
●
Asset balance:
OpSt + CF – CC – EC Ϯ OC = ClSt (8.8)
explaining the changes in the value of stocks – from the beginning of the account-
ing period (opening stocks OpSt) to its end (closing stocks ClSt) – as gross capital
formation CF, produced and natural capital consumption (CC, EC), and other
changes in assets OC.
Other asset changes play an important role in greening the conventional
accounts. The SEEA shifts part of the ‘economic disappearance of non-produced
assets’ as the depletion cost of natural resources from SNA’s asset accounts to the
production accounts. This rejects the notion of somehow vanishing natural assets,
as the responsible users of environmental source and sink services are charged with
the cost of depleting and degrading these assets. All other asset changes remain
outside the production accounts, since natural disasters, the creation of subsoil
resources or unmanaged natural growth are not the result of an economic produc-
tion process (Section 8.1.1). Such changes should not affect, therefore, the value of
product, income and capital formation.
There is some controversy about accounting for natural resource discoveries
(‘economic appearance of a non-produced asset’ in SNA terminology). US national
accountants (Landefeld & Howell, 1998) argue that the discovery of subsoil
resources turns them into ‘developed natural assets’. Consequently they account for
discoveries as capital formation in the supply and use accounts, thus largely offset-
ting their depletion.
7
This argument ignores, on the one hand, that the SNA actually
7
Despite this ‘self-effacing’ treatment of natural resource depletion, the coal-mining lobby suc-
ceeded in convincing the US Congress to suspend further work on green accounting for an exter-
nal review by the National Academy of Sciences (NAS). As a result of this suspension, work on
green accounting by the Bureau of Economic Analysis was effectively halted, notwithstanding the
positive recommendations by the NAS panel (Nordhaus & Kokkelenberg, 1999).
accounts for resource development as fixed capital formation (in the case of mineral
exploration). On the other hand, the creation of in situ mineral deposits is obviously
more in the nature of a cost-free gift by the ‘creator’ (nature) than the result of
economic production.
One green accounting indicator attempts to assess sustainable development in
terms of ‘enhancing human well-being through time’ (World Bank, 2003). Genuine
Savings S
g
, which now runs under the name of ‘adjusted net savings’, sets out from
national income NI and final consumption C to calculate ‘education enhanced’
(+C
e
) and environmentally adjusted (–EC) net savings as
S = NNI C + C E
C
ge
−− (8.9)
However, the presumed relations of welfare-generating consumption with savings
(a source of finance for capital formation) and, partially, capital formation (for
including education as human capital) obscures the indicator’s meaning for sustain-
ability – of welfare, wealth or income?
8
In the end, using the SEEA’s ECF indicator
(Equation 8.6) would be clearer with regard to capital maintenance. It would also
be more consistent with national accounts conventions of capital formation and
consumption.
8.2.3 Accounting for Policy Performance
At first sight, environmental expenditure by governmental and non-governmental
actors seems to indicate society’s willingness to take environmental action. These
outlays are part of the conventional accounting indicators of output, input, con-
sumption, capital formation, and exports and imports. In Fig. 8.1 environmental
protection expenditures could therefore be shown as ‘thereof’ subcategories of the
conventional flow accounts. Consequently, these outlays do not require any basic
changes of the system structure. National accountants readily embraced environ-
mental protection and related expenditures as a major part in greening the national
accounts. The segregation of environmental activities is a matter of relatively
uncontroversial expansion of classifications and data collection; it is extensively
discussed in the SEEA-2003.
Environmental expenditures are, however, not a good indicator of environmental
performance. They depend crucially on a country’s particular environmental conditions
and the efficiency of its regulative and legislative institutions. Still, environmental
8.2 SEEA Objectives, Structure and Indicators 153
8
Besides the general problem of reflecting utility by public and private consumption, genuine
savings does not clearly define environmental cost for depletion (with regard to the treatment of
other volume changes such as discoveries or natural disasters), and takes $20 per ton of carbon
emission as the basis for calculating a placeholder value for total environmental damage. The
savings indicator seems also to ignore capital transfers from other countries as a source of poten-
tial investment and a factor in the generation of ‘net worth’ in the national balance sheet (United
Nations et al., 1993, ch. XIII).
154 8 SEEA – The System for Integrated Environmental and Economic Accounting
expenditures can assess the significance of an emerging environmental industry in
terms of conventional indicators such as sales, value added and investment (OECD
and Eurostat, 1999). More questionable are proposals to deduct such expenditures
and other regrettables from gross or net national product as a defence against the
deterioration of environmental and social conditions (Leipert, 1986, Daly, 1996).
Box 8.2 shows the wide range of defensive expenditures including, besides the cost of
environmental protection, those of maintaining health, security and other social standards.
The SEEA presents only environmental protection expenditure accounts (and
their classification) and refrains from deducting such expenditure from national
accounts aggregates. The reason is that such deduction would destroy the coherence
of the accounting system (United Nations et al., in prep.). From a more substantive point
of view, it seems hardly possible to distinguish defensive from ‘real’ welfare creating
outlays. When, for instance, does defence increase security rather than maintaining
it, or when is food improving, maintaining or damaging human health and well-
being? Moreover, any deduction of a particular expenditure would have to trace – and
exclude – all antecedent industries’ contributions to this expenditure. Such assessment
of direct and indirect outlays is, however, more a matter of modelling than accounting
or index calculation. As discussed in Section 7.1.1, the deduction of defensive
expenditures may be part of ad hoc index calculations of human welfare but
should not be included in systemic accounting of economic activity.
Specific environmental policy measures, in particular those using ‘market
instruments’, are probably of greater relevance for environmental policy.
Accounting for the costs and revenues generated by these instruments is one of the
highlights of the revised SEEA. Somewhat hidden under ‘accounting for other
environmentally related transactions’, Ch. 6 of the SEEA-2003 (United Nations
et al., in prep.) explains
Box 8.2 Categories of defensive expenditures
Expenditures for
●
Environmental protection and damage compensation
●
External costs of production and consumption
●
External costs of spatial concentrations and urbanization (noise protec-
tion, rent increases, security and commuting costs)
●
Risks in the industrial system (provisions for hazardous industries,
crime, defence etc.)
●
Costs of car transport (accidents and emission control)
●
Health costs from unhealthy consumption patterns, and living and
working conditions.
‘Minimum’ estimates of defensive expenditures for Germany (excluding,
in particular, health costs) amounted to about 10% of GNP.
Source: Leipert (1986, 1989).
●
The nature of fiscal (dis)incentives as production taxes and subsidies that affect
value added and domestic product (in the income-generation accounts)
●
Ecological tax reform as ‘hypothecated’ (earmarked for reducing labour cost)
eco-taxes
●
Environmental fees or charges for governmental environmental services such as
waste disposal as intermediate or final consumption
●
Natural resource rent absorption through royalties and other resource taxes as a
significant source of governmental property income (shown in the primary
income distribution accounts)
●
The acquisition of tradable emission and resource use permits as an increase in
intangible non-produced wealth (cf. Section 8.1.2 as to the accounting of amor-
tized outlays for tradables).
Chapter 13 describes the objectives of different policy instruments and evaluates
their ecological and economic efficiency, in particular as part of an ecological tax
reform. Predicting the success or failure of these instruments is, of course, a matter
of modelling, addressed in Ch. 12.
8.3 Case Studies
Integrated environmental and economic accounts translate the concept of economic
sustainability into environmentally adjusted indicators of non-declining net output
or positive net capital formation. Net domestic product (NDP) and capital forma-
tion play key roles in conventional economic accounting and analysis.
A similar significance can be expected for their environmentally adjusted counter-
parts, EDP and ECF, in long-term sustainable growth analysis and policy.
Policymakers usually refer to a ‘green GDP’, rather than green NDP.
9
The reason
is that GDP calculation avoids the difficulties of estimating capital consumption.
Interpreting the environment as an ‘inventory’ of nature’s goods and services that
enter production as intermediate consumption (Section 8.2.1), might justify ignoring
capital consumption in an environmentally adjusted GDP. Since sustainability
requires the maintenance of natural and produced capital, green GDP is misleading,
however: omitting fixed capital depreciation ignores the need to replace worn-out
capital goods. Crumbling infrastructure has been a significant cause of non-sustaina-
bility of economic development, not only in poor countries but also in industrialized
ones; the spectacular collapse of a highway bridge in Minneapolis is a case in point.
Table 8.1 presents EDP as the overall result of pilot studies of natural resource
and environmental accounting [FR 8.2]. The studies show the significance of natu-
ral capital in production and income generation by comparing EDP with NDP. An
effort was made to adjust those indicators, which were compiled outside the
9
For instance, China’s leadership endorsed (but later refuted) the idea of compiling a green GDP
as the scientific approach to assessing economic development [FR 8.2].
8.3 Case Studies 155
156 8 SEEA – The System for Integrated Environmental and Economic Accounting
national accounts framework (Indonesia, Costa Rica, United Kingdom), to SEEA
concepts. However, as indicated in the table notes, comparability still suffers from
remaining differences in concepts, methods, valuations and coverage of environmental
concerns. Several studies stopped short of estimating environmental degradation
cost, compiling only EDP 1, which accounts for natural resource depletion only.
EDP 2 calculations include additional maintenance costs of pollution.
All SEEA applications took a cautious approach, leading to undercoverage and
underestimation. This could explain the rather modest shares of depletion and degradation
cost (the difference between NDP and EDP), especially in the industrialized countries
of USA, Germany, Japan and the Republic of Korea. Japan, Korea and Germany
hardly extract or harvest domestic natural resources. The USA, on the other hand,
limited its study to the depletion of subsoil resources and assigned only a place-
holder value of actual environmental expenditure to environmental degradation
(Landefeld & Howell, 1998). Other (developing) countries show more significant
effects on their natural capital. At a time, Costa Rica and Indonesia exploited their
natural resources at rates of 10% and 30% of their NDP, respectively.
Of course, most industrialized countries depleted their natural resources in the
past and accumulated thus an environmental debt to future generations. The SEEA
does not account for such debt because current production and cost measures do not
Table 8.1 NDP and EDP in case studies of green accounting (lowest and highest percentages)
Country EDP 1
a
/NDP(%) EDP 2
b
/NDP(%)
China (1992) 94
Costa Rica (1970–1989)
c
89–96
Germany 96–97
Ghana (1991–1993)
c, d
85–89
Indonesia (1971–1984)
c
69–87
Japan (1985/1990) 98/99.6 97/98
Korea, Republic of (1985–1992)
d
100 96–98
Mexico (1985) 94 87
Papua New Guinea (1986–1990) 92–99 90–97
Philippines (1988–1992)
d, e
96–99.5 75–83
United Kingdom (1980–1990)
f
95–100
USA (1987)
g
98.5–99.6
Source: Bartelmus (1997b, table 1) and updates.
Original sources: China: Akita and Nakamura (2000); Costa Rica: Solórzano et al. (1991);
Germany: Bartelmus (2002); Mexico: van Tongeren et al. (1991); Indonesia: Repetto et al. (1989);
Japan: Oda et al. (1996); Korea: Kim (1998); Papua New Guinea: Bartelmus et al. (1992);
Philippines: Domingo (1998); Ghana: Powell (1996); United Kingdom: Pearce (1994); USA:
Landefeld and Howell (1998).
Notes:
a
EDP 1 is NDP, adjusted for natural resource depletion only.
b
EDP 2 is NDP, adjusted for natural resource depletion and environmental quality degradation.
c
Concept adjusted to United Nations (SEEA) methodologies.
d
Preliminary estimates.
e
Soil erosion not yet covered.
f
Oil and gas depletion only.
g
Depletion of subsoil assets, range of estimates (valuations).
8.3 Case Studies 157
Fig. 8.2 ECF in selected countries (% of NDP)
Note: ECF 1 is net capital formation minus the cost of natural resource depletion; ECF 2 covers
both depletion and environmental degradation cost.
Source: Bartelmus (1997b, fig. 2).
recognize costs incurred in previous accounting periods. Still, environmental debt
estimates (Hueting & Bosch, 1994; Azar & Holmberg, 1995) point to the need for
assessing the environmental sins of the past, and also those against other countries
through ‘burden shifting’ (Section 6.3.2).
One way of looking at the sustainability of economic performance and growth
is to assess a nation’s capability of generating new capital after taking produced and
natural capital consumption into account. Figure 8.2 presents ECF in per cent of
NDP. Only Indonesia, Ghana and Mexico appear to have performed non-sustainably,
showing a disinvestment of negative ECF. Non-negative ECF reflects the fact that
natural capital consumption did not offset the net increase of fixed capital. The
countries maintained or increased in this case the total value of capital during the
accounting period, achieving weak sustainability of economic performance.
World Bank estimates of adjusted net savings, which is similar to ECF, seem to
indicate widespread non-sustainability for Africa (Table 8.2). However, as pointed
out in Section 8.2.2, the indicator is not strictly comparable with national accounts
categories of income, savings, NDP or changes in net worth.
For structural and sectoral policy and management, overall environmental cost
and the affected indicators need to be disaggregated by economic sectors. The case
studies of Mexico and Thailand show that the depletion costs incurred by forestry
and mining reduce the conventional value added of these industries by over 70%.
158 8 SEEA – The System for Integrated Environmental and Economic Accounting
In Germany, pollution costs amounted to about one third of value added in both, the
agriculture/forestry/fishery and the energy supply sectors (Table 8.3).
One of the arguments against compiling an environmental satellite account is
cost. Using the software of the SEEA operational manual (United Nations, 2000a)
the author carried out a test application for Germany with two assistants within
three months. Annex III shows the result of this test for the year 1990. The annex
also presents a synoptic view of the greened accounts, which demonstrates their
consistency with the standard national accounts. The admittedly rough study indi-
cates sustainable performance in this year in terms of positive ECF (Table 8.3:
ECF/NDP > 0).
Table 8.3 also presents EDP and EVA estimates for West Germany (1990) and
for the unified country (1991, 1995). EDP estimates for 3 years (and moreover in
current prices) can obviously not assess any trends in the environmental sustainabil-
ity of economic growth. Still, the table shows a distinct increase of environmental
Table 8.3 Green accounting indicators, Germany 1990, 1991 and 1995 (provisional estimates)
1990 1991 1995
Agriculture,
Total fishery Iron and Energy
(1990) and forestry steel supply Total Total
NDP(VA) (billion DM) 1,943 24.8 14.4 39.6 2,527 3,002
EDP(EVA) (billion DM) 1,884 16.6 11.7 26.3 2,444 2,926
EC/NDP(VA) (%) 3.0 33.4 18.9 33.6 3.3 2.5
NCF/NDP (%) 11.1 12.0 9.2
ECF/NDP (%) 8.1 8.7 6.7
Source: Bartelmus (2002, table II.2); with permission by the copyright holder, Springer.
Table 8.2 Adjusted net savings, world regions 1999 (% of GDP)
Adjusted net Adjusted net
Gross savings (including savings (excluding
domestic education education
Countries savings expenditure) expenditure)
Low income 20.3 7.8 4.9
Middle income 26.1 14.3 10.8
High income 22.7 13.5 8.7
East Asia and Pacific 36.1 25.2 23.5
Europe and Central Asia 24.6 11.9 7.8
Latin America and the Caribbean 19.2 9.6 5.5
Middle East and North Africa 24.2 −1.3 −6.0
South Asia 18.3 8.3 5.2
Sub-Saharan Africa 15.3 3.9 −0.8
Explanation: The World Bank definition of adjusted net savings differs from national accounts
definitions of saving and capital formation. To make the indicator more comparable with ECF
education expenditures are excluded in the last column.
Source: World Bank (2003, table 2.1).
cost (NDP – EDP in current prices) from 59 billion DM (3% of NDP) in 1990 to
83 billion DM (3.7% of NDP) in 1991 because of the coverage of East Germany’s
wasteful and polluting industries in 1991. Thereafter (by 1995), adaptation or elimi-
nation of these industries in competition with West Germany’s modern production
methods appears to have largely offset the relative increase in environmental cost
after unification. The table also identifies agriculture and energy supply as the most
environmental-cost-intensive industries (per unit of value added).
The good news of the case study is that the avoidance or immediate mitigation
costs of attaining weak sustainability are relatively low at 3% of net product. The
bad news is that actual and potential damage from these impacts could be consider-
ably higher. As discussed in Section 8.1.3, such damage costs are near-impossible to
estimate at the national level. In fact, those brave enough to do so came up with val-
ues ranging from about the same as our natural capital consumption value to twenty
times this value. Damage estimates for the late 1980s and early 1990s in Germany
thus vary between 100 billion and 1,000 billion DM (Wicke, 1993). On the other
hand, a DM 50 billion result from a European Union project of green accounting
(Markandya & Pavan, 1999) is even lower than the maintenance cost estimated by
the author for the same year (1990). In an accounting project in the Philippines
(Delos Angeles & Peskin, 1998),
10
the costs of ‘complete’ water pollution and
household wastes control exceeded the estimated damages (foregone earnings and
medication expenses for disease and premature death). The authors suggest, there-
fore, that in these cases ‘complete control is unwise’. The question is, how much
control would be wise and, of course, how much is the value of human life?
8.4 SEEA Revision
In 1993 the United Nations Statistics Division published the SEEA as an ‘interim
version’. For 10 years, the London Group of national accountants worked on improv-
ing the SEEA for broader international acceptance. The Group intended to change
the interim status into more permanent guidelines, which would last at least another
decade [FR 8.1]. Since we will have to live for some time with this document and
an operational version of the SEEA-1993 might continue to be used in practice, this
section discusses critically the revision in comparison to the original SEEA. The
purpose is to facilitate an informed choice of concepts and methods from both
handbooks in future country applications.
The revision process also revealed, but failed to resolve, core questions of envi-
ronmental-economic analysis and accounting. The questions include the various
above-discussed physical-monetary, income-welfare and accounting-modelling
dichotomies in the measurement and evaluation of sustainability. There was also
10
This project was conducted by the Department of Environment and Natural Resources; it was
not coordinated with, and is indeed quite different from, the SEEA application carried out by the
National Statistical Coordination Board (presented in Table 8.1 and Fig. 8.2).
8.4 SEEA Revision 159
160 8 SEEA – The System for Integrated Environmental and Economic Accounting
little participation by data users and developing countries, which could be a source
of further dissent, this time between national accountants and policymakers.
The result of the revision is a bulky report, well-researched in part but often
ambivalent in its recommendations. In the end, the report admits that the SEEA is
still ‘very much … work in progress’.
11
The ambivalence of the SEEA stems from
opaque analytic concepts and contradictions, in particular with regard to the
●
Sustainability of economic growth vs. development as the main objective of the
SEEA
●
Aggregation of environmental impacts in physical units vs. monetary values
●
Incorporation of basic environmental statistics in the accounting system.
As a result, the SEEA looks sometimes more like a framework for environmental
and economic data than an integrated economic-environmental accounting system.
8.4.1 Accounting for Economic Sustainability?
‘The purpose of this handbook is … investigation and analysis of the interaction
between the economy and the environment. Only by integrating the two areas can
the implications for sustainability of different patterns of production and consumption
be examined ….’ This statement of the SEEA seems to focus on the sustainability
of economic activity and growth, rather than development. However, reference to
Hicksian income presumably brings in ‘sustainable development’, deemed to be
‘closely related to the long-standing economic concept of income’.
Hicks (1946) himself argued that the ex ante notion of income cannot be meaningfully
aggregated. The SNA also makes it quite clear that Hicks’ income definition of ‘the
maximum value … [a man] can consume during a week, and still expect to be as
well off at the end of the week as he was at the beginning’ is not compatible with
the national accounts conventions of income and wealth (Box 8.3). Nor can income
be considered as a measure of welfare as suggested by the SEEA, due to the incompatibility
of damage/welfare valuations with market prices (Section 8.1.3). The revised
SEEA thus fails to clearly specify its objective of assessing the sustainability of
economic performance and growth vs. socio-economic development. Right at the
outset, there is confusion about the scope and coverage of the SEEA.
The SEEA addresses in principle two main operational categories of environmental
sustainability, classifying them as weak and monetary, and strong and physical. This
comes close to advocating the assessment of economic and ecological sustainability
11
Unless otherwise stated ‘SEEA’ and citations in this section refer to the (revised) SEEA-2003
(United Nations et al., in prep.). Direct references for most of these citations can be found in
Bartelmus (2007).
8.4 SEEA Revision 161
Box 8.3 National income vs. Hicksian (sustainable) income and wealth
The main difficulties of adopting the widely accepted Hicksian income defi-
nition in the SEEA stem from the following accounting conventions:
●
Hicksian income is an ex ante notion (based on expectations), which, for
measurement purposes, and as pointed out by Hicks (1946), would have
to be translated into ‘realized’, i.e. actually received, income.
●
The ‘well-off’ or wealth notion would have to be defined in accounting
terms as maintaining ‘real net worth’ (the net value of financial and non-
financial assets and liabilities: United Nations et al., 1993). It is far from
clear to what extent the SEEA’s ‘capital base’, which might include human
and social capital, refers to real net worth – at individual and national
levels.
●
Assessing net worth maintenance for defining income would change the
national (disposable) income concept by accounting also for changes in
net worth due to (1) capital transfers (from/to other countries), (2) other
changes in volume of assets (from natural disasters, war, discoveries and
depletion of non-produced natural assets, i.e. ‘windfall profits or losses’
according to Hicks (op. cit.), and (3) real holding gains.
The connections between income generated (net domestic product), national
income and the treatment of other volume changes therein are crucial for
assessing the sustainability of natural capital use (Section 8.2.2). The SEEA
mixes up or misinterprets these concepts when it distinguishes between a
damage-based stock concept of sustainability of Hicksian income, and a cost-
and income-based concept of the very same income notion. The objective
seems to use Hicksian income for defining sustainability of both, welfare and
income generation, interpreting ‘being well off’ as well-being and (non-
declining) income.
as defined in Ch. 2. However, a persistent wavering between, on the one hand, the
necessity of monetary valuation for assessing overall capital maintenance and, on
the other hand, rejecting such valuation as research or hypothetical modelling pre-
vents specifying the sustainability categories in terms of accounting indicators.
Obviously such ambivalence in valuation carries over into ambivalence towards
calculating environmentally adjusted indicators. ‘Adjustment accounts’ first seem
to present a large variety of greened aggregates. Soon enough we are warned,
however, against carrying out these calculations: ‘there are theoretical, practical
and institutional reasons why a statistical office may not implement this part of the
SEEA or at least not yet’. In fact, the adjustment accounts seem to conceal the key
aggregates of EDP and ECF by focusing on the modification of a little-known and
162 8 SEEA – The System for Integrated Environmental and Economic Accounting
-used sub-item, ‘operating surplus’. EDP (‘eaNDP’) is listed under a bewildering
list of indicator options.
12
ECF (excluding environmental degradation) is mentioned
in passing as ‘depletion-adjusted measure of capital formation’. The SEEA’s unusual
focus on the adjustment of saving in its ‘captial’ account seems to be a concession to
the World Banks’s promotion of ‘adjusted net saving’ (Section 8.2.2).
Without fully modifying the key monetary national accounts indicators, the SEEA
cannot directly compare the ‘goods’ of production and consumption with their ‘bads’
of pollution and depletion. Consequently, proclamations on accounting for sustaina-
ble growth or development remain largely rhetoric. In fact, after an introductory dis-
cussion of natural capital and sustainability, the concept of natural capital and the
role of its consumption in sustainability measurement are studiously avoided. Only
the last chapter refers briefly to total national wealth as an indicator of sustainability,
cautioning against its use because of the difficulties of assessing substitution among
all capital categories.
8.4.2 Accounting for Ecological Sustainability?
The SEEA looks much better in physical accounting. Physical and hybrid accounts
show material flows and stocks underlying the monetary transactions and the value
of natural assets. Unfortunately, the SEEA is again ambivalent with regard to meas-
uring comprehensively the inputs and outputs (throughput) of materials and sub-
stances in material flow accounts (MFA). A few paragraphs address the problem of
using a common physical unit for various types of natural resources and emissions.
In the end, the ambiguous conclusion is either to ‘aggregate all materials on the
basis of weight and … use caution in the interpretation of the results’, or to ‘build
accounts on a material-by-material basis and avoid altogether the creation of poten-
tially misleading measures…’.
The ambiguity towards aggregation carries over into discussing the ecological
sustainability concept of dematerialization. According to the SEEA, the purpose of
the MFA is to show the ‘decoupling of economic growth from materials use’ as ‘an
important sustainability goal for environmentalists’. However, setting standards for
such dematerialization, notably of Factor 4 (cf. Section 2.4.2), is disparaged as
‘rather vague for use as guides to policy…’. The physcial accounts fail therefore to
provide comprehensive indicators for sustainability policies. They do include par-
ticular natural resource accounts and environmental statistics for the management
of resources and residuals.
The SEEA does present the maintenance of critical capital as an alternative
notion of strong ecological sustainability. This ecological sustainability concept
12
What are we to make of the different versions for dpOS, dpS, dpNDP, daNI, daS, eaGDP, eaNDP
and geGDP, where dp stands for depletion adjusted, da for damage adjusted, ea for environmentally
adjusted (including depletion cost), and ge for greened-economy (modelled) indicators?
would indeed provide a justification for measuring irreplaceable environmental
assets, selectively and in different units of measurement, i.e. without forcing them
into the straightjacket of tonnage. The opportunity to show how the physical accounts
could capture the strong sustainability concept of complementarity by proper
definition and classification of critical capital categories is not seized, though. There
are, however, promising attempts at defining and monitoring critical capital in terms
of importance and vulnerability (de Groot et al., 2003), and by means of safe mini-
mum (sustainability) standards (Ekins et al., 2003). These criteria should be further
examined as to their compatibility with SEEA objectives and conventions.
The SEEA also includes ecosystems and their inputs into production and con-
sumption, at least ‘conceptually’, while admitting to ‘limited knowledge and experi-
ence’, and measurement problems. The half-hearted inclusion of ecosystem accounts
cannot provide a thorough discussion of the need for assessing ecosystem services
and resilience as a measure of ecological sustainability (cf. Sections 2.4.1, 3.3.1).
This draws the ire of ecological economists. Box 8.4 summarizes their critique and
argues that, after all, welfare valuation of ecosystem services and modelling of sys-
tem resilience do not fit in a national environmental-economic accounting system.
The Millennium Ecosystem Assessment (2005) appears to confirm this view: it does
8.4 SEEA Revision 163
Box 8.4 Accounting for ecosystem services?
A special issue of Ecological Economics (2007, 61/4) confronted ecological
economists with the revised SEEA-2003. With regard to ecosystem account-
ing, their critique focused on the SEEA’s deficiencies in covering:
●
The spatial dimension: land and ecosystem accounts of the SEEA need
further development (Weber, 2007).
●
Measurement and welfare valuation of ecosystem services: these services
are ‘Nature’s public goods’ and must be included in comprehensive wel-
fare measures, notably a green GDP (Boyd, 2007).
●
Resilience: the SEEA needs to address ‘key ecological issues, such as
system dynamics and … vulnerability’ (Walker & Pearson, 2007).
However, these criticisms look more like arguments for removing ecosystem
accounts from the SEEA. When it comes to accounting for ecosystem
health, diversity and resilience, Weber’s (2007) ‘accounts’ turn into ‘counts’,
i.e. indicators and classifications. Boyd’s (2007) suggestion of extending the
production boundary of the national accounts upsets accounting identities
and balances and introduces welfare valuations that are incompatible with
the market valuations of the national accounts (Sections 7.3, 8.1.3). Finally,
the modelling of potential welfare effects of changes in resilience (Walker
& Pearson, 2007) blurs both ex post accounting and predictive modelling
(Sections 8.1.2, 3).
164 8 SEEA – The System for Integrated Environmental and Economic Accounting
not attempt a systematic accounting or presentation, but answers a range of ‘key
questions’ on how ecosystems change, affect well-being and how they can be
managed sustainably. Other frameworks, notably for environmental or ecological
statistics and statistical ecology are indeed better suited for assessing and modelling
the benefits and damages of particular ecosystems (cf. Ch. 4 and FR 4.1).
8.4.3 Revising the Revision
In summary, the revision process sought to minimize changes to the conventional
national accounts. The idea is to elaborate on physical accounts and their underlying
statistics, and using monetary values for those transactions that need only limited
adjustment (as part of the SNA). These transactions can either be shifted around
(from other asset changes to the production accounts) or presented in greater detail
(environmental expenditures, taxes, permits and licenses).
The revised SEEA makes, therefore, most progress in physical accounting. The
price is a loss of much of its systemic character by dealing with difficult-to-aggregate
physical data. Meaningful aggregation is however a prerequisite for assessing and
comparing the significance of environmental impacts and economic benefits. An
opportunity for operationalizing the opaque notion of environmental sustainability
with the help of environmentally adjusted accounting indicators is missed. The
revision also misses a chance of overcoming, or at least assessing, the persisting
environmental-economic dichotomy discussed in Ch. 2.
The necessary next revision will have to tackle, among others, the following issues:
●
Defining clearly the goal of assessing the environmental sustainability of
economic performance and growth, in produced and natural capital terms and
corresponding physical and monetary indicators
●
Streamlining a voluminous and difficult-to-read handbook by concentrating on
aggregative physical and monetary accounts; separate handbooks could present
the databases for natural resources and residuals with reference to other frame-
works of environmental data and indicators (Sections 4.1,2)
●
Reassessing the need for costing environmental externalities, required for cost
internalization and full-cost pricing (Sections 2.3.2, 13.3)
●
Describing the use of tradable pollution permits for market-price valuation of
environmental degradation (Section 8.1.1)
●
Reviewing critically the need for introducing welfare (damage) valuation into a
system geared toward measuring economic performance (Section 8.1.3)
●
Exploring neglected aspects of sustainability accounting and analysis,
including
- The maintenance of human, social and financial capital categories and their
substitution (Section 8.2.1)
- Environmental debt owed to future generations and other countries, whence
sustainability is ‘imported’ (Section 8.1.2)
- Definition and measurement of critical capital in physical accounts (Section 2.3.1)
- Accounting for goods, services and pollutants in energy (exergy) units
(Section 6.2.3)
- The feasibility of subnational accounting for regional environmental pres-
sures and ecological capacities
- The treatment of transboundary pollution as transfers in environmentally
adjusted national income (Section 8.1.2)
●
Establishing guidelines, software and training material for the implementation
of green accounting projects, building upon the operational manual of the SEEA
(United Nations, 2000a) and experience gained in case studies.
The implementation of these proposals requires a greater involvement of the research
and user communities – beyond the narrow views of official statistics. Decision-
makers need to learn about the analytic capabilities of green accounting for both, the
environmental management of particular natural resources and pollutants, and the
formulation and evaluation of national sustainability policies. Statisticians should
familiarize themselves with data uses in sustainability analysis and policy.
Satellite accounts can assess progress towards long-term sustainability of economic
performance, without changing the basic principles of the conventional accounts. Why
not use the satellites for what they are intended, namely to present and test alternative
assessment tools for new concepts and paradigms? At present, there is a distinct risk
that green accounting will be ignored as yet another – complex and costly at that –
indicator framework. In 1992, the Rio Earth Summit proposed ‘a programme to
develop national systems of integrated environmental and economic accounting in all
countries’ (United Nations, 1994, ch. 8). Ten years later, the 2002 Johannesburg
Summit did not mention environmental accounting but ‘encourage[d] further work on
indicators for sustainable development’ (United Nations, 2003). It remains to be seen
if a new United Nations Committee of Experts on Environmental-Economic
Accounting [FR 8.1] will be able to achieve its declared objective of raising the SEEA
from a technical report to a ‘statistical standard’.
Further Reading
FR 8.1 SEEA History and Revision
Ward (2004) devotes a chapter of his book to the ‘environmental dimension’ of sta-
tistical work by the United Nations. Bartelmus and Seifert (2003, Introduction)
present a concise history of green accounting. Their reader also selects key works
of the methods and use of green accounts at national and corporate levels. The new
Earth Portal to the Encyclopedia of Earth provides an overview article on green
accounting: />Bartelmus et al. (1991) developed the basic system of integrated environmental
and economic accounting. The same authors also prepared a draft handbook, which
Further Reading 165
166 8 SEEA – The System for Integrated Environmental and Economic Accounting
was published by the United Nations (1993) after submission to the Rio Earth
Summit. Using experience gained in pilot case studies, the United Nations (2000a)
later issued an ‘operational’ manual. The SNA presents the SEEA as part of its
satellite accounts (United Nations et al., 1993, ch. XXI).
The London Group of national accountants, named after the place of its first
meeting, revised the original SEEA. The draft revised version, the SEEA-2003, is
available from the web site of the United Nations Statistics Division: http://unstats.
un.org/unsd/envaccounting/seea.asp. The successor of the London Group, the
United Nations Committee of Experts on Environmental-Economic Accounting
seeks to coordinate the further development of concepts and methods and to pro-
mote the use of the SEEA ( />asp). Inexplicably, the SEEA-2003 is still not published.
Hecht (2005) is a largely textual presentation of the SEEA, presenting useful summa-
ries of its modules and national accounting in general. A special edition of Ecological
Economics (2007, 61/4) presents a first outside review of the revised SEEA.
FR 8.2 Case Studies of Green Accounting
The sources of Table 8.1 refer to pilot studies of green accounting. Some of these
studies can be found in Uno and Bartelmus (1998). The operational SEEA manual
(United Nations, 2000a, annex) describes software available for a step-by-step
implementation of case studies. The Institute of Advanced Studies of the United
Nations University conducted case studies on green GDP in China, Japan and
Indonesia (Akita & Nakamura, 2000). Following a call by China’s President, the
State Statistical Bureau and the State Environmental Protection Administration car-
ried out a case study of green accounting ( content_
384596.htm); as in the USA (cf. note 7), the recent halting of China’s green
accounting project (see Box 4.4) reflects fears of revealing the economic signifi-
cance of environmentally hazardous activities. Markandya and Pavan (1999) and
delos Angeles and Peskin (1998) attempted to apply welfare valuation to environ-
mental damages in green accounting for selected European countries and the
Philippines, respectively. The United Nations Statistics Division is building a data-
base on environmental accounting mostly by governmental agencies (http://unstats.
un.org/unsd/envaccounting/ceea/archive/Introduction.asp).
Review and Exploration
●
Why should we impute a money value on the use of natural resources (deple-
tion) and environmental sinks (degradation)? Do we need to adjust the national
accounts for costing environmental impacts?
●
Explain the pros and cons of different valuation techniques for greening the
national accounts.
●
How do green accounting indicators assess the sustainability of economic per-
formance and growth? Do they account for the sustainability of development?
Compare the monetary indicators with the physical aggregates of material flow
accounts.
●
Find the key green accounting aggregates in Germany’s SEEA matrix (Annex
III). What do they say about the sustainability of Germany’s economy?
●
Does the deduction of defensive expenditures turn net national product into a
welfare measure?
●
Should we replace the conventional national accounts with greened ones?
●
Does the SEEA revision address the different accounting dichotomies? Do we
need a revision of the revised SEEA?
Review and Exploration 167
Chapter 9
Corporate Accounting:
Accounting for Accountability
Corporate environmental accounting mirrors national environmental-economic
accounting at the enterprise level. Corporations picked up the messages of the Earth
Summits, presenting environmental management as a sign of corporate social
responsibility. They are more reticent, though, to account publicly for their environ-
mental impacts, in particular if it comes to providing a cost value for these impacts.
If at all, corporate accountants favour physical eco-balances and life cycle analyses
over full-cost accounting. Dissenting voices introduced the physical-monetary
dichotomy into a debate of the accountancy profession.
International guidelines promote cost-saving environmental management, or at
least the cost-efficient implementation of environmental rules and regulations.
Mostly, they ignore the need for standardizing the monitoring of environmental
impacts and their costs. The SEEA could provide a framework and standards for
extending the management guidelines to green accounting. The result would be
harmonized micro- and macro-level environmental accounting and analysis, estab-
lishing the so-called micro-macro link.
9.1 From Accountability to Accounting
1
9.1.1 Corporate Social Responsibility
The social indicator discussion of the 1970s in Europe triggered the inclusion of
non-economic social concerns in corporate accounts. However, the widely propa-
gated Swiss-German ‘social balances’ (Sozialbilanzen) (Hoffmann-Nowotny, 1981)
were short-lived. The reasons were measurement and aggregation problems of quality
of life components, on the one hand, and conflicting interests between corporate-
economic and social objectives, on the other hand. Nonetheless, social accounting
can be seen as the ‘Trojan horse’, which opened the walls of conventional corporate
1
This section draws on Bartelmus and Seifert (2003), Introduction, section 4.
P. Bartelmus, Quantitative Eco-nomics, 169
© Springer Science + Business Media B.V. 2008
170 9 Corporate Accounting: Accounting for Accountability
accounting to the accountability of corporations for their social and environmental
impacts (Gray, 1992). Scholars at the university of St. Gall (Switzerland) used the
breach made into economic accounting by extending the social balances into
‘ecological bookkeeping’ (Ullman, 1976; Müller-Wenck, 1978).
The failure of assessing the quality of life by social indicators [FR 4.3] stalled the
further development and implementation of green corporate accounting. It took a
long time and inspiration from the international environmental and sustainable
development movements for the accountancy profession to acknowledge the rele-
vance of environmental concerns. By now, the idea of corporate social responsibility
(CSR) seems to have ‘won the battle of ideas’ (Crook, 2005). Business, government,
civil society and international organizations all advocate the need for catering not
only to the economic gain of the company’s shareholders but also to the welfare of
its stakeholders, i.e. the neighbourhood community and society at large. Globalization
(cf. Ch. 14) contributed to this general acceptance of corporate accountability and
good corporate citizenship: multinational corporations, which got mired in human
rights violations, corruption, social conflicts and environmental disasters in some
countries, are ready to take up and flaunt social responsibility.
The United Nations and other international governmental and non-governmental
organizations promote CSR in all dimensions of sustainable development [FR 9.1].
At the same time, there are voices questioning the wisdom of letting the boardroom
decide about social and environmental concerns. There is no general electorate to
legitimize the formulation and implementation of social and environmental policies
by companies; nor should companies compromise their obligation to shareholders
for maximizing profitability. Moreover, banking on public-private partnership for
fostering sustainability may be a sign of governments shirking their responsibility
for improving environmental and social conditions.
2
The general drive for CSR puts pressure on enterprises to move beyond rhetoric by
monitoring the implementation of proclaimed social objectives. Actual efforts at
changing the established accounting procedures reveal how far enterprises and their
accountants are willing to go in subjecting the CSR ideals to scrutiny. For instance, the
United Nations (2002a) programme on the promotion of environmental management
accounting sees the main benefits of such accounting in cost-saving waste manage-
ment, reduction of environmental liability and improvement of corporate image.
This is a far cry from showing responsibility for improving the quality of life of
community and society. On the other hand, it is a sign of good corporate manage-
ment that could enhance profitability and environmental goodwill. It remains to be
seen if, possibly in reaction to accounts manipulations such as exaggerating oil
2
The 2002 Johannesburg Summit advanced so-called type-2 partnerships. UNEP’s former
Executive Director, Klaus Töpfer, maintained that these partnerships ‘threaten to mask the failure
of governments to agree on meaningful action’ (the type-1 partnership) and ‘could … result in
“greenwash” by polluting companies wanting to divert criticism’ (as cited by the Friends of the
Earth, an NGO: />