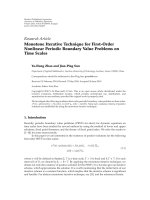
Báo cáo sinh học: " Research Article Rigid Registration of Renal Perfusion Images Using a Neurobiology-Based Visual Saliency Model" doc
Bạn đang xem bản rút gọn của tài liệu. Xem và tải ngay bản đầy đủ của tài liệu tại đây (3.88 MB, 16 trang )
Hindawi Publishing Corporation
EURASIP Journal on Image and Video Processing
Volume 2010, Article ID 195640, 16 pages
doi:10.1155/2010/195640
Research Article
Rigid Registration of Renal Perfusion Images Using
a Neurobiology-Based Visual Saliency Model
Dwarikanath Mahapatra and Ying Sun
Department of Electrical and Computer Engineering, 4 Engineering Drive 3, National University of Singapore, Singapore 117576
Correspondence should be addressed to Dwarikanath Mahapatra,
Received 19 January 2010; Revised 8 May 2010; Accepted 6 July 2010
Academic Editor: Janusz Konrad
Copyright © 2010 D. Mahapatra and Y. Sun. This is an open access article distributed under the Creative Commons Attribution
License, which permits unrestricted use, distribution, and reproduction in any medium, provided the original work is properly
cited.
General mutual information- (MI-) based registration methods treat all voxels equally. But each voxel has a different utility
depending upon the task. Because of its robustness to noise, low computation time, and agreement with human fixations, the
Itti-Koch visual saliency model is used to determine voxel utility of renal perfusion data. The model is able to match identical
regions in spite of intensity change due to its close adherence to the center-surround property of the visual cortex. Saliency value is
used as a pixel’s utility measure in an MI framework for rigid registration of renal perfusion data exhibiting rapid intensity change
and noise. We simulated varying degrees of rotation and translation motion under different noise levels, and a novel optimization
technique was used for fast and accurate recovery of registration parameters. We also registered real patient data having rotation
and translation motion. Our results show that saliency information improves registration accuracy for perfusion images and the
Itti-Koch model is a better indicator of visual saliency than scale-space maps.
1. Introduction
Image registration is the process of aligning two or more
images which may be taken at different time instances,
from different views or by different sensors (or modalities
in medical imaging applications). The floating image(s) is
(are) then registered to a reference image by estimating a
transformation between them. Image registration plays a
vital role in many applications such as video compression
[1], video enhancement [2], scene representation [3], and
medical image processing [4].
Medical image registration has acquired immense sig-
nificance in automated or semiautomated medical image
analysis, intervention planning, guidance, and assessment
of disease progression or effects of treatment. Some of the
applications have been in the areas of brain imaging [5],
kidney (renal) perfusion images [6], and radiological images
[7]. Over the years, rigid registration algorithms have used
mutual information (MI) [8, 9], Fourier transforms [10–
12], correlation-based methods [13–15] and attribute vectors
[16]. For registering dynamic kidney perfusion images three
approaches were tested in [17], namely, template matching,
Fourier transforms, and cross correlation, and the Fourier
transform-based approach was found to give the best
performance. A method for correcting image misregistration
due to organ motion in dynamic magnetic resonance (MR)
images combines mutual correspondence between images
with transform invariant features [18]. Other methods for
registration of renal perfusion MR images are based on a
combination of wavelet and Fourier transforms [6]anda
contrast invariant similarity measure [19].
In dynamic contrast enhanced (DCE) MRI, a contrast
agent (e.g., Gd-DTPA) is injected into the blood stream.
The resulting images exhibit rapid intensity change in an
organ of interest. Apart from intensity change, images from
a single patient are characterized by noise and movement of
the organ due to breathing or patient motion. Registering
images with such rapid intensity changes is a challenge
for conventional registration algorithms. Although previous
works [6, 17–19] demonstrate good results in registering
renal perfusion MR images, they fail to incorporate the
contribution of the human visual system (HVS) in such
2 EURASIP Journal on Image and Video Processing
tasks. The HVS is adept at distinguishing objects in noisy
images, a challenge yet to be completely overcome by object
recognition algorithms. Humans are also highly capable of
matching objects and regions between a pair of images in
spite of noise or intensity changes. We believe it is worthwhile
to investigate whether a model of the HVS can be used to
register images in the presence of intensity change. In this
paper, we use a neurobiology-based HVS model for rigid
registration of kidney MRI in an MI framework. As we
shall, see later MI is a suitable framework to include the
contribution of the HVS.
Most MI-based registration methods treat all voxels
equally. But a voxel’s utility or importance would vary
depending upon the registration task at hand. For example,
in renal perfusion MRI a voxel in the renal cortex has greater
significance in registration than a voxel in the background
even though they may have the same intensity. Luan et
al. in [20] have defined a voxel’s importance based on its
saliency and used it in a quantitative-qualitative mutual
information (QMI) measure for rigid registration of brain
MR images. Saliency refers to the importance ascribed to a
voxel by the HVS. Different computational models have been
proposed to determine saliency maps of images [21, 22]. An
important characteristic of the HVS is its ability to match
the same landmark in images exhibiting intensity change (as
in DCE images). An accurate model of the HVS should be
able to imitate this property and assign similar importance
(or utility) values to corresponding landmarks in a pair
of images. The entropy-based saliency model used in [20],
called scale-space maps, fails to achieve the desired objectives
for DCE images.
Scale-space maps [21] calculate the entropy over different
scales around a pixel’s neighborhood and the maximum
entropy at a particular scale is used to calculate the saliency
value. When there is a change in intensity due to contrast
enhancement the entropy (and hence saliency) value of a
pixel also changes. As a result, the same landmark in two
different images has different utility measures. But it is
desirable that a landmark have the same utility value in
different images. In contrast, the neurobiology based saliency
model of [22] assigns the same importance to corresponding
landmarks and has been shown to have a high correlation
with human fixations [23]. Besides, it has advantages over
scale-space maps in terms of robustness to noise and
computational complexity. Therefore, we hypothesize that
a neurobiological model of saliency would produce more
accurate results than scale-space maps for rigid registration
of kidney perfusion images. Saliency models have also been
used for computer vision tasks like image retrieval [24]and
image interpolation [25].
In this paper, we investigate the usefulness of a
neurobiology-based saliency model for registering renal per-
fusion images. Our paper makes the following contributions.
First, it investigates the effectiveness of a computational
model of the HVS for image registration within the QMI
framework proposed in [20]. Previously used saliency mod-
els are limited by their inaccurate correspondence with
actual human fixations and sensitivity to noise. Our work is
different from [20] in the use of saliency models. Second, we
perform a detailed analysis of the effectiveness of different
mutual information-based similarity measures, with and
without using saliency information, for the purpose of
registering renal perfusion images. This gives an idea of
the effectiveness of different saliency methods. Third, we
use a randomized optimization scheme which evaluates
greater number of candidate solutions, which minimizes the
possibility of being trapped in a local minimum and increases
registration accuracy. The rest of the paper is organized
as follows. In Section 2, we describe the neurobiology-
based saliency model, theoretical foundations of MI-based
registration and our optimization scheme. Sections 3 and 4,
respectively, give details about our method and experimental
results. Finally we conclude with Section 5.
2. Theory
2.1. Saliency Model. Visually salient regions in a scene are
those that are more “attractive” than their neighbors and
hence draw attention. Saliency in images has been defined
on the basis of edges [26]andcorners[27]. Studies have
also shown that salient regions are those that have maximum
information content [28]. In this regard, entropy has been
used to define scale-space maps for saliency [21]. The
entropy-based saliency map, however, has the following
limitations in determining saliency.
(1) The changing intensity of perfusion images assigns
different entropy and hence saliency values to corre-
sponding pixels in an image pair exhibiting intensity
change. This is undesirable when matching contrast
enhanced images.
(2) There is the inherent problem of choosing an appro-
priate scale. For every voxel, the neighborhood (scale)
that maximizes the local entropy is chosen to be its
optimal scale resulting in unnecessary computational
cost.
(3) Presence of noise greatly affects the scale-space map
which results in erroneous saliency values. Since local
entropy gives a measure of the information content in
a region, presence of noise can alter its saliency value.
(4) The scale-space saliency map does not truly deter-
mine what is salient to the human eye. An entropy-
based approach takes into account distribution of
intensity in a local neighborhood only. Thus the
information derived is restricted to a small area in the
vicinity of the pixel.
Considering the above drawbacks, the neurobiology
based model performs better for the following reasons.
(1) An important aspect of the model is its center-
surround principle which determines how different
a pixel is from its surroundings. As long as a pixel
has feature values different from its surroundings
its saliency value is preserved, thus acting as a
robust feature. This is better than the entropy model
where the intensity distribution leads to different
EURASIP Journal on Image and Video Processing 3
saliency values when intensity changes due to con-
trast enhancement.
(2) By representing the image in the form of a Gaussian
pyramid, the need for determining the appropriate
scale for every voxel does not arise.
(3) Inherent to the model is the process of lateral
inhibition that greatly contributes to suppressing
noise in the saliency map.
(4) The model, when used to identify salient regions
in a scene, has high correlation with actual human
fixations.
The model calculates a saliency map by considering
intensity and edge orientation information from a given
image. Saliency at a given location is determined primarily
by the contrast between this location and its surroundings
with respect to the image features. The image formed on the
fovea of the eye is the central object on which a person is
focusing his attention resulting in a clear and sharp image.
Regions surrounding the central object have a less clearer
representation on the retina. To simulate this biological
mechanism, an image is represented as a Gaussian pyramid
comprising of layers of subsampled and low-pass filtered
images. The central representation of the image on the fovea
is equivalent to the image at higher spatial scales, and the
surrounding regions are obtained from the lower spatial
scales. The contrast is thus the difference between the various
feature maps at these scales.
Let F(c)andF(s) denote a feature map (intensity, edge
orientation, etc.) at scale c and s,respectively.Thecontrast
map F(c, s)isdefinedas
F
(
c, s
)
=|F
(
c
)
F
(
s
)
|,
(1)
where denotes center-surround difference, the center is
given by level c
∈{1, 2,3} and the surround is given by level
s
= c + σ, σ ∈{3,4} in the Gaussian pyramid. Thus, we
have 6 contrast maps for every feature. Although the original
model uses three features, including color, intensity, and edge
information, we use only intensity and edge information
because our datasets were in grayscale. The edge information
is obtained from the image by using oriented Gabor filters
[29]atdifferent orientation angles (0
◦
,45
◦
,90
◦
, and 135
◦
).
In total 30 feature maps are obtained, 24 for edge orientation
and 6 for intensity.
The feature maps represent different modalities and
varying extraction mechanisms. In combining them, salient
objects appearing strongly in a few maps may be masked by
noise or less salient objects present in a larger number of
maps. Therefore, it is important to normalize them before
combination. A map normalization operator N(
·) is used
which globally promotes maps where a small number of
strongly conspicuous locations are present while suppressing
maps containing numerous locations of similar conspicuity.
N(
·) consists of the following steps.
(1) Normalize the values in the map to a fixed range
(0
···M) to eliminate modality or feature-depend-
ent amplitude differences. We set M
= 1inour
experiments.
(2) Find location of the map’s global maxima, M,and
calculate the average
m of its other local maxima.
(3) Globally multiply the map by (M
−m)
2
.
The biological motivation behind N(·)isthatitcoarsely
replicates lateral inhibition mechanisms in which neigh-
boring similar features inhibit each other via specific,
anatomically defined connections [30]. The feature maps
are combined into two conspicuity maps,
I for intensity
and
O for edge orientation. The conspicuity maps are again
normalized and the final saliency map S is obtained as the
average of the normalized conspicuity maps(2)
SM
=
1
2
N
I
+ N
O
.
(2)
2.1.1. Saliency Map in 3D. The gap between slices of the
original volume is 2.5mmwhichdoesnotprovidesufficient
information along the z-axis to extend each step of the
saliency map to 3D. Intensity maps can be obtained directly
from the data but calculating orientation maps proves to be
challenging as 3D oriented Gaussian filters are computation-
ally intensive. Therefore, for each slice of the 3D volume, we
calculate its 2D saliency map which is subsequently used for
registration.
2.2. Rigid Registration. Rigid registration requires us to align
a floating image (volume) with respect to a reference image
(volume) by correcting any relative motion between them.
For simplicity, we describe the registration framework in
termsof2Dimagesbutourexperimentswerefor3D
volumes. Let I
f
be the floating image (volume for 3D data)
which is to be registered to a reference image I
r
.For3D
volumes there are 6 degrees of freedom (i.e., translation
and rotation along each of x-, y-andz-axis) while 2D
images have 3 degrees of freedom. The similarity between
two images is determined from the value of a similarity
measure which depends upon the type of images being
registered. The parameters for translation and rotation that
give maximum value of the similarity measure are used to
register the floating image.
To determine the effectiveness of the neurobiology model
of saliency, we used it in a QMI-based cost function for
rigid registration. This cost function combines saliency
information (or utility measure) with the MI of the two
images to evaluate the degree of similarity between them. A
joint saliency (or joint utility) histogram, similar to a joint
intensity histogram, is used to determine the cooccurrence
of saliency values in the saliency maps of the images
under consideration. We follow the QMI definition and
formulation of [20].
2.2.1. Quantitative-Qualitative Measure of Mutual Informa-
tion. In [31], a quantitative-qualitative measure of informa-
tion in cybernetic systems was proposed which puts forth two
aspects of an event: a qualitative part related to the fulfillment
of the goal in addition to the quantitative part which is
related to the probability of occurrence of the event. The self-
information of an event E
n
with probability of occurrence p
n
4 EURASIP Journal on Image and Video Processing
is given by H(E
n
) =−log p
n
[32]. In image processing, an
event is the intensity of a pixel and an entire image is a set
of events. Thus, according to Shanon’s entropy measure, the
average information of a set of events E
={E
1
, , E
N
} with
respective probabilities P
={p
1
, , p
N
} is given by
H
(
E
)
=
N
n=1
p
n
−log p
n
.
(3)
MI gives a quantitative measure of the amount of
information one set of events contains about another. Given
two sets of events E
={E
1
, , E
N
} and F ={F
1
, , F
M
},
with respective probabilities P
={p
1
, , p
N
} and Q =
{
q
1
, , q
M
}, their MI is given by
MI
(
E, F
)
=
N
n=1
M
m=1
p
(
E
n
, F
m
)
log
p
(
E
n
, F
m
)
p
n
q
m
,
(4)
which is the relative entropy between the joint distribution,
p(E
n
, F
m
), and the product of marginal distributions p
n
and
q
m
.
If we denote by U
={u
1
, , u
N
} the utilities of the
events in E, the quantitative-qualitative measure of informa-
tion of E is defined as
QH
(
E; U
)
=
N
n=1
u
n
p
n
−
log p
n
,
(5)
where the utility u
n
can be any nonnegative real number.
Thus, it follows that the quantitative-qualitative measure
of mutual information can be defined as
QMI
(
E, F
)
=
N
n=1
M
m=1
u
(
E
n
, F
m
)
p
(
E
n
, F
m
)
log
p
(
E
n
, F
m
)
p
n
q
m
,
(6)
where u(E
n
, F
m
) is the joint utility of the events E
n
and F
m
.
2.3. Saliency-Based Registration. QMI gives a measure of
the amount of information one image contains about the
other taking into account both intensity and saliency (utility)
information. By maximizing the QMI of the two images to
be registered, the optimal transformation parameters can be
determined. Given a reference image I
r
and a floating image
I
f
,wedenotebyi
r
and i
f
their respective pixel intensities.
The goal of the registration procedure is to determine a
transformation T suchthatQMI,asgivenby(7), of the
transformed floating image I
f
T
and the reference image I
r
is
maximum.
QMI
I
r
, I
f
T
=
i
r
i
f
T
u
i
r
, i
f
T
p
i
r
, i
f
T
log
⎛
⎝
p
i
r
, i
f
T
p
i
r
q
i
f
T
⎞
⎠
,
(7)
where u(i
r
, i
f
T
) is the joint utility of the distribution of the
images. The optimal transformation T
∗
is,
T
∗
= arg max
T
QMI
I
r
, I
f
T
.
(8)
Joint Utility. The joint utility of an intensity pair can be
defined in the following manner. Denoting the intensity and
utility of a voxel in image I
f
as i
f
and u
f
,respectively,and
their counterparts in image I
r
as i
r
and u
r
, the joint utility of
intensity pair i
f
and i
r
can be defined as
u
i
f
, i
r
=
{
i
f
,i
r
}
u
f
(
x
)
×u
r
y
,
(9)
where the summation is over all pairs of pixels with intensity
values (i
f
, i
r
); x and y are the voxels under consideration.
We use the multiplication operator to consider the joint
occurrence of utility values. For example, to calculate the
joint utility of intensity pair (128,58), we find all the pairs of
points
{x, y} such that all points in image I
f
have intensity
128 and the corresponding points in image I
r
has intensity
58. The joint utility is determined by multiplying the saliency
values for a pair of points and summing over all such
pairs. A normalized saliency map is used so that the most
salient regions in two images have an equal importance of
1. However, the joint utility value can exceed 1 as it reflects
the joint importance of intensity pairs and not just individual
utility values.
2.4. Optimization. The most accurate optimization results
are obtained by an exhaustive search for all combinations
of different parameters. But it is not practical as it involves
a lot of computations. There are many fast optimization
algorithms in literature that make use of heuristics to speed
up optimization [33]. Although such methods are fast they
may not always give the global optimum as there is the
possibility of getting trapped in a local optima. Therefore
multiresolution search procedures are used where the param-
eters are first optimized over a coarse scale followed by a
search on subsequent finer scales. However, we find that
first finding the optimal rotation parameters and keeping
it fixed, as described in [33] leads to errors in subsequent
optimization steps when the rotation estimate is flawed. To
address this problem, we adopt a different approach based
on Powell’s optimization routine [34]asdescribedbelow:
(1) The original image is subsampled to three coarser
levels. L1 indicates the original image; L2 indicates a
subsampling factor of 2, L3 indicates a factor of 3, and
L4 indicates a subsampling factor of 4.
(2) At L4, we perform an exhaustive search individually
for each DOF and the optimal parameters are used
to transform the image. The search range is
±5voxels
for translation along x-, y-, z-axis (T
x
, T
y
, T
z
)and±3
degree for rotation about x-, y-, z-axis (R
x
, R
y
, R
z
).
(3) The registration parameters are interpolated which
act as starting points for L3. The DOFs are indi-
vidually optimized in two passes: first, rotation
parameters over a search range of
±5degreesand
then T
x
, T
y
,andT
z
with search ranges of ±5, ±5,
and
±2 voxels. The optimal parameters are used to
transform the volume and a second pass with the
same sequence of steps is performed. The volume is
EURASIP Journal on Image and Video Processing 5
transformed only if the parameters from the second
pass indicate a better match than the parameters from
first pass
(4) The same process as step (3) is repeated at a finer
resolution level L2 of the image.
(5) The parameters from L2 are interpolated to L1and
an exhaustive search is carried out for R
x
, R
y
, R
z
(±3
degrees), T
x
, T
y
(±5 voxels) and T
z
(±2 voxels).
(6) The final parameters are used to get the registerd
image.
The above optimization scheme proves to be robust as
we pick the DOF to be optimized at random and repeat the
entire scheme.
2.4.1. Results for Derivative-Based Optimizer. The Powell’s
optimization routine that we adopt is highly suitable for
cost functions whose derivatives are not available and the
computation cost is prohibitive. It works by evaluating
candidate solutions in the parameter space over straight
lines, that is, linear combinations of parameters. Such
combinations require a bracketing of the minimum before
the optimization can be started [34]. As a result, several
necessary criterion estimations have to be performed which
is inefficient when using a multiresolution strategy. Th
´
evenaz
et al. in [35] propose an optimization method based on the
derivative of the similarity measure that makes better use of
a multiresolution optimization setup.
The work in [35] uses MI as a similarity metric for
rigid registration of natural and medical images. Mutual
information is calculated using a Taylor expansion and
B-Spline Parzen window functions. This facilitates easy
computation of its derivatives for optimization purposes. Let
I
f
(x) be the floating image and I
r
(x) be the reference image
defined on a continuous domain x
∈ V
c
. Coordinates x
i
are
samples of V
c
and the discrete set of these samples is denoted
as V.Letg(x; μ
1
, μ
2
, ) be a geometric transformation with
parameters μ
= (μ
1
, μ
2
, ). Let L
f
and L
r
be discrete sets
of intensities associated with I
f
and I
r
,respectivelyandw a
separable B-spline based Parzen window. The joint discrete
Parzen histogram is defined as
h
l
f
, l
r
, μ
=
1
f
r
x
i
∈V
w
l
f
f
−
I
f
g,
x
i
; μ
f
·
w
l
r
r
−
I
r
(
x
i
)
r
,
(10)
where l
f
∈ L
f
, l
r
∈ L
r
,and
f
is related to card(L
f
)and
r
to card(L
f
). The contribution to the joint histogram of
a single pair of pixels with intensities (I
f
, I
r
) is distributed
over several discrete bins (l
f
, l
r
) by the window function w.
This joint histogram is proportional to the discrete Parzen
probability p given by
p
l
f
, l
r
; μ
=
α
μ
h
l
f
, l
r
; μ
, (11)
where the normalization factor is
α
μ
=
1
l
f
∈L
f
l
r
∈L
r
h
l
f
, l
r
; μ
.
(12)
The marginal probabilities are given by
p
f
l
f
; μ
=
α
μ
h
f
l
f
; μ
=
l
r
∈L
r
p
l
f
, l
r
; μ
,
p
r
l
r
; μ
=
α
μ
h
r
l
r
; μ
=
l
f
∈L
f
p
l
f
, l
r
; μ
.
(13)
The utility measure is defined as the sum of product of
saliency values of cooccurring intensity pairs. Equation (9)
can be written as
u
l
f
, l
r
, μ
=
{
l
f
,l
r
}
SM
f
g,
x; μ
·SM
r
(
x
)
,
(14)
where SM
r
and SM
f
are the saliency values of the reference
and floating images.
{l
f
, l
r
} denotes the cooccurring inten-
sity pairs l
f
and l
r
. The utility measure is treated as a constant
although it is dependent upon the cooccurring intensity
pairs of I
r
(x)andI
f
(g,(x; μ)). This is achieved by actually
transforming the original saliency map of I
f
according to the
transformation, g(x; μ
1
, μ
2
, ), incurring a minor additional
computational cost. Parzen windows is not used because the
joint utility histogram is not a distribution of saliency values
but the sum of the product of saliency values of cooccurring
intensity pairs.
The QMI between I
r
and the transformed I
f
is given by
S
Q
μ
=−
l
f
∈L
f
l
r
∈L
r
u
l
f
, l
r
; μ
p
l
f
, l
r
; μ
·
log
2
⎛
⎝
p
l
f
, l
r
; μ
p
f
l
f
; μ
p
r
l
r
; μ
⎞
⎠
.
(15)
The optimal registration parameter, given by μ, is one which
gives minimum value of S
Q
between the transformed test
image I
f
(g(x)) and I
r
. The Taylor series expansion of (15)
is given by
S
Q
μ
= S
Q
(
ν
)
+
i
∂S
Q
(
ν
)
∂μ
i
μ
i
−ν
i
+
1
2
i,j
∂
2
S
Q
(
ν
)
∂μ
i
∂μ
j
μ
i
−ν
i
μ
j
−ν
j
+ ···.
(16)
The gradient of S
Q
is given by
∂S
Q
∂μ
=−
l
f
∈L
f
l
r
∈L
r
u
l
f
, l
r
∂p
l
f
, l
r
; μ
∂μ
log
2
⎛
⎝
p
l
f
, l
r
; μ
p
f
l
f
; μ
⎞
⎠
.
(17)
To compute the QMI value at different transformations
we also calculate the second derivative of S
Q
as its Hessian
∇
2
S
Q
. We refer the reader to [35] for details regarding
6 EURASIP Journal on Image and Video Processing
calculation of
∇
2
S
Q
and derivative of the joint probability
distribution, that is, ∂p(l
f
, l
r
; μ)/∂μ in (17). Note that the
utility is always treated as a constant, and as shown in (17),
does not change the essence of the way derivatives of the cost
functions are calculated.
A derivative-based cost function makes the method
quite sensitive to the initial search parameters and their
wrong choice may even lead to nonconvergence. Therefore,
a multiresolution framework is used to get good candidate
parameters from the first step. A 4 level image pyramid is
created with the fourth level denoting the coarsest resolution.
The parameters from the coarsest level are used to find the
optimal parameters at finer levels by using the derivative of
mutual information. This results in a significant reduction
of computation time as compared to Powell’s method where
greater number of parameters need to be evaluated.
The transformation parameters are updated as a result
of the minimization of the cost function. Two popular
optimization methods are the steepest-gradient descent
method and Newton method. The steepest-gradient descent
algorithm is described as
μ
(k+1)
= μ
(k)
−Γ∇S
Q
μ
(k)
. (18)
Although its local convergence is guaranteed, it may be
very slow. A key problem is determining the appropriate
scaling diagonal matrix Γ. The Newton method is described
as
μ
(k+1)
= μ
(k)
−
∇
2
S
Q
μ
(k)
−1
∇S
Q
μ
(k)
.
(19)
Although the Newton method’s convergence is not
guaranteed, it is extremely efficient when the criterion is
locally quadratic. To combine the advantages of the above
two methods, the Marquardt-Levenburg strategy is used. A
modified Hessian HS
Q
, where the off-diagonal entries of
∇
2
S
Q
is retained and its diagonal entries multiplied by a
factor λ,isdefinedas
HS
Q
μ
i,j
=
∇
2
S
Q
μ
i,j
1+σ
i,j
λ
,
(20)
where σ
i,j
is the Kroneckor function and λ is a tuning factor
that represents the compromise between the gradient and
Newton method. Thus
μ
(k+1)
= μ
(k)
=
HS
Q
μ
(k)
−1
∇S
Q
μ
(k)
.
(21)
Details of derivation of the different equations can be
found in [35]. The optimization routine from the insight
registration and segmentation toolkit (ITK) [36]wasused.
Each image was decomposed to 4 resolutions (similar to the
scheme using Powell method) and registered using NMI,
QMI1, and QMI2 by Th
´
evenaz’s optimization framework.
To calculate the joint utility measure, the saliency maps of I
r
(SM
r
)andI
f
(SM
f
) are calculated and for every parameter,
SM
f
is transformed to get the new map SM
f
(g,(x; μ)).
SM
f
(g,(x; μ)) and SM
r
are used to calculate the joint utility
measure at every step.
Although the computation time is significantly lower
than Powell’s method the registration results are sensitive to
the initial conditions. If the optimal parameters determined
from the coarsest image resolution is far away from the
actual transformation parameters then it is highly unlikely
that Thevenaz’s scheme will converge at the right solution.
This problem is particularly acute when no multiresolution
strategy is used. In that case, Powell’s method is markedly
superior. In a multiresolution setup when the initial condi-
tions are good, Thevenaz’s method converges in less time as
compared to Powell’s method with significantly less number
of evaluations, but similar accuracy. Thevenaz’s method can
stop at any time and simultaneously optimizes all parameters
from the first criterion resulting in a reduction in the number
of criterion evaluations.
A clear advantage of the Powell method is its robustness.
This calls for the use of a derivative-based global optimiza-
tion method using Powell’s method in the coarsest stage.
Subsequently, Thevenaz’s method can be used in the finer
stages for faster convergence. The registration accuracy using
such an approach is consistently closer to the values reported
in Tabl e 2. Without using Powell’s method in the coarsest
stage, the registration error for many of the volume pairs is
greater than using Powell’s method.
3. Experiments
3.1. Subjects. The volumes were obtained from 4 healthy
volunteers (2 women and 2 men, age
= 39.2±10.1years)and
6 patients (2 women and 4 men, age
= 67.9 ±8.4years)with
renal insufficiency manifested by serum creatinine
≥ 2mg/dl
(average
= 2.9 ± 1.2 mg/dl). Written informed consent was
obtained from all subjects. All the 10 datasets were used for
testing. Note that every dataset comprised of 2 kidneys. The
results for each dataset are the average errors for tests on both
kidneys.
3.2. MRI Acquisition Protocol. Dynamic MRI was performed
on a 1.5 T system (Avanto; Siemens, Erlangen, Germany)
with a maximum slew rate of 200 T/m/s, maximum gradient
strength of 45 mT/m, and a torso phased-array coil. 3D T
1
-
weighted spoiled gradient-echo imaging was performed in
the oblique coronal orientation to include the abdominal
aorta and both kidneys. The following parameters were used:
TR
= 2.8ms, TE = 1.1 ms, flip angle = 12
◦
,matrix =
161 ×256 ×20, FOV = 425 × 425 ×100mm
3
, bandwidth =
650 Hz/voxel, volume acquisition time = 3 s. The 20 original
5-mm coronal partitions were interpolated to 402.5mm
slices.
Five unenhanced acquisitions were performed during a
single breath-hold. A 4-ml bolus of Gd-DTPA(Magnevist;
Berlex laboratories, Wyne, NJ, USA) was then injected,
followed by 20 ml of saline, both at 2 ml/s. Over 20 min, 363D
volumes were acquired using a variable sampling schedule:
10 sets acquired at 3 s intervals, followed by 4 sets at intervals
of 15 s, followed by 7 at 30 s intervals, and ending with
15 sets over one minute intervals. The first 10 sets were
attempted to be acquired within a single breath-hold. Before
each subsequent acquisition, the patients were instructed
to suspend respiration at end-expiration. Oxygen via nasal
EURASIP Journal on Image and Video Processing 7
cannula was routinely offered to the patients before the
exam to facilitate breath-holding. For image processing, all
413D volumes (5 acquired before and 36 after contrast agent
injection) were evaluated.
3.3. Registration Procedure. Two volumes of interest (VOI),
each encompassing a kidney were selected from each volume.
We test the effectiveness of our algorithm by registering the
entire VOI sequence of each patient to a reference VOI.
Each kidney had a different reference VOI. For different
cases, different pre- and postcontrast VOIs were chosen as
reference. Saliency maps were calculated for each slice of a
VOI and saliency information from these maps was used to
define the utility measure of each voxel. For every reference-
floating VOI pair, the floating VOI is transformed according
to the scheme outlined in Section 2.4 and for each can-
didate transformation parameter, the QMI-based similarity
measure (6) is calculated. The candidate transformation
parameters that give the maximum value of QMI are used
to get the final transformation. We evaluate the performance
of our algorithm using the ground truth for registration
provided by a clinical expert.
To check for the robustness and effectiveness of the
proposed similarity measure we determined its character-
istics with change in transformation parameters. For this
purpose, rotation and translation motion was simulated
on the datasets. In an attempt to recover the applied
motion the value of the similarity measure at different
candidate transformation parameters was calculated. The
characteristics thus obtained gave an idea of the suitability
of the similarity measure for registering DCE images. The
robustness of different similarity measures was determined
by first misaligning the images by different degrees of
known translation and rotation. Three different similarity
measures were used in the tests, namely, normalized mutual
information (NMI) [37], QMI in [20] (QMI1), and our
proposed method (QMI2). NMI is a popular similarity
measure used for registering multimodal images; that is,
images of the same organ but from different modalities such
as MR and CT, and its performance can help us gauge the
effectiveness of our method.
4. Results
We present results for different experiments that show the
importance of using saliency in registering DCE images of
the kidney. 10 datasets comprising of 403D volumes were
used and each volume consists of 41 slices. Manual regis-
tration parameters by experts were available for each dataset
facilitating performance comparison. First, we present proof
of the suitability of saliency for registering contrast enhanced
images. Then we show properties of the different similarity
measures with respect to registration. These sets of results
are similar to those presented in [20]. They highlight the
fact although QMI1 was a good measure to register brain
MR images, QMI2 shows better performance than QMI1 in
registering renal perfusion images. This is reflected in the
properties of the different similarity measures. Finally, we
present registration results of real patient datasets and com-
pare relative performance of different similarity measures
with respect to manual registration parameters.
To calculate the registration error due to simulated
motion we adopt the following steps. Let m
sim
be the value
of simulated motion (translation or rotation) parameter and
m
recv
be the value of recovered motion parameter. The error
is equal to m
err
=|m
sim
−m
recv
|and the error as a percentage
of the simulated motion is given as
m
err
% =
|
m
sim
−m
recv
|
m
sim
×100.
(22)
For simulated motion, registration was deemed to be accu-
rate if m
err
≤ 10%.
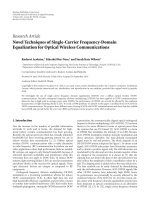
4.1. Saliency Maps for Pre- and Postcont rast Enhanced Images.
In DCE images, the intensity of the region of interest changes
with time due to the flow of contrast agent. In Figure 1,we
show the target image and images from different stages of
contrast enhancement along with their respective saliency
maps. Zero mean Gaussian noise of different variances has
been added to the displayed images. Although there is
progressive contrast enhancement of the kidney in addition
to the noise, we observe that the saliency maps are very
similar. This can be attributed to the fact that the regular
structure of the kidney with its edges dominates over the
effect of intensity in determining saliency. The intensities of
the images ranged from 0 to 1 and the variance of added
noise ranged from 0.01 to 0.1. The variance of the images
from a typical dataset varied from 0.025 to 0.06. The image
intensity values were all normalized between 0 and 1. As long
as the variance of added noise is less than 0.1 the saliency
maps are nearly identical. Beyond a variance value of 0.3itis
difficult to even visually identify the kidney from the images.
The simulated motion studies were carried out for zero mean
Gaussian noise with different variances.
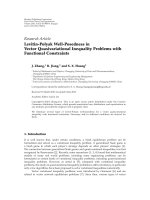
To demonstrate that the saliency value in DCE images
is indeed constant, we plot the average saliency value over
pixel windows from images of different stages of contrast
enhancement. In Figure 2, we show the mean saliency value
of patches of sizes 3
× 3, 5 × 5, and 7 × 7fromdifferent
areas of the kidney, with best results for the 5
× 5patch.
The mean saliency value of the background is zero even in
precontrast images because the kidney due to its well defined
structure and edges is more salient than the background. We
take two different patches from the cortex to highlight that
different areas of the cortex have different saliency values
which change little over contrast enhancement. To achieve
registration the kidney need not be the most salient region
as long as it has a nearly constant saliency profile over the
course of contrast enhancement. The maps show saliency to
be a measure that is constant over contrast enhancement and
it is desirable to exploit this information for registration of
DCE images.
4.2. Registration Functions. A similarity measure for two
images should have the following desirable properties: (a) it
8 EURASIP Journal on Image and Video Processing
(a) (b) (c) (d)
(e) (f) (g)
0
0.1
0.2
0.3
0.4
0.5
0.6
0.7
0.8
0.9
(h)
Figure 1: Saliency maps of contrast enhanced image sequence. (a)–(d) show images from different stages of contrast enhancement with
added noise. The variance of noise added was .02, .05, .08, and .1. (a) is the reference image to which all images are registered. (e)–(h) show
the respective saliency maps; (i) colorbar for the saliency maps. The saliency maps are seen to be similar. Color images are for illustration
purposes. In actual experiments gray scale images were used.
0
0.2
0.4
0.6
0.8
Average saliency value
0 1020304050
Sampling instant
Patch size 3
×3
(a)
0
0.2
0.4
0.6
0.8
Average saliency value
0 5 10 15 20 25 30 35 40 45
Sampling instant
Patch size 5
×5
(b)
0
0.2
0.4
0.6
0.8
Average saliency value
0 1020304050
Sampling instant
Patch size 7
×7
Background
Cortex 1
Cortex 2
Medulla
(c)
Figure 2: Saliency profiles of patches from different regions. The sizes of patches used are (a) 3 ×3, (b) 5 × 5, and (c) 7 × 7. Patches from
the background, cortex and medulla are considered.
should be smooth and convex with respect to the transforma-
tion parameters; (b) the global optimum of the registration
function should be close to the correct transformation
that aligns two images perfectly; (c) the capture range
should be as large as possible; and (d) the number of local
maxima should remain at a minimum. We can determine the
registration function of QMI2 by calculating its value under
different transformations.
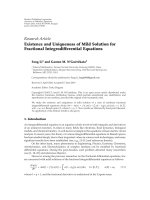
In Figure 3, we show the registration functions for
different translation and rotation ranges corresponding to
3different similarity measures namely NMI, QMI1 and
QMI2. Motion was simulated on randomly chosen images
EURASIP Journal on Image and Video Processing 9
0.7
0.75
0.8
0.85
0.9
0.95
1
NMI values
−100 −50 0 50 100
Relative error
NMI versus change in Rx
(a)
50
60
70
80
90
100
110
QMI1 values
−60 −40 −200 204060
Relative error
QMI1 versus change in Rx
(b)
130
140
150
160
170
180
190
200
QMI2 values
−80 −60 −40 −20 0 20 40 60
Relative error
QMI2 versus change in Rx
(c)
0.88
0.9
0.92
0.94
0.96
0.98
1
NMI values
−60 −40 −20 0 20 40 60
Relative error
NMI versus change in Tx
(d)
13.5
14
14.5
15
15.5
QMI1 values
−60 −40 −20 0 20 40 60
Relative error
QMI1 versus change in Tx
(e)
70
80
90
100
110
120
QMI2 values
−60 −40 −20 0 20 40 60
Relative error
QMI2 versus change in Tx
(f)
Figure 3: Plots showing variation of different similarity measures when registering pre- or postcontrast images. First column is for NMI,
second column for QMI1, and third column for QMI2. First row shows the variation for rotation parameters about x-axis while second
column shows variation for translation along x-axis. The variance of added noise was 0.08. x-axis of the plots shows relative error between
actual and candidate transformations while y-axis shows value of similarity measure.
0.5
0.6
0.7
0.8
0.9
1
NMI values
−60 −40 −20 0 20 40 60
Relative error
NMI versus change in Ty
(a)
40
45
50
55
60
65
70
75
QMI1 values
−60 −40 −20 0 20 40 60
Relative error
QMI1 versus change in T
y
(b)
70
80
90
100
110
120
QMI2 values
−60 −40 −20 0 20 40 60
Relative error
QMI2 versus change in T
y
(c)
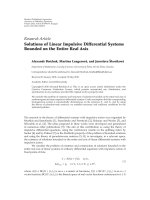
Figure 4: Plots showing variation of different similarity measures when registering pre- and postcontrast images: (a) NMI; (b) QMI1;
(c) QMI2. The plots show results for T
y
(translation along y-axis). x-axis of the plots shows relative error between actual and candidate
transformations while y-axis shows value of similarity measure.
22 333
2 2233
2 2223
2 2233
22 223
(a) (b)
22333
22233
33223
33323
33322
(c) (d)
Figure 5: Synthetic image patch showing shortcomings of NMI. (a)-(b) precontrast intensity values and corresponding image patch; (c)-(d)
intensity values after contrast enhancement and corresponding patch.
10 EURASIP Journal on Image and Video Processing
Table 1: Average translation error and registration accuracy for different noise levels. The figures are for simulated motion studies on all
volumes of the sequence. Translation errors are for values along X-, Y-, Z-axis.
Variance of Added noise (σ)
Average Registration Error (in mm) Registration Accuracy in %
NMI QMI1 QMI2 NMI QMI1 QMI2
0 (5.3,5.2,0.5) (1.9,1.7,0.2) (1.2,1.1,0.2) 68.1 88.9 98.8
0.01 (5.3,5.2,0.6) (1.7,1.6,0.3) (1.3,1.3,0.2) 67.2 88.1 98.3
0.04 (5.5,5.5,0.8) (1.8,1.8,0.4) (1.4,1.4,0.3) 61.3 83.2 95.3
0.06 (5.8,5.9,1.0) (1.9,1.9,0.6) (1.6,1.5,0.4) 47.1 78.2 92.1
0.085 (6.2,6.3,1.1) (2.2,2.2,0.7) (1.7,1.7,0.50) 41.2 62.3 89.1
0.1 (6.4,6.5,1.3) (2.4,2.4,0.9) (1.9,1.9,0.8) 40.1 57.4 75.6
belonging to either the pre- or postcontrast enhancement
stage. The motion simulated image was the floating image
which was registered to the original image without any
motion. Zero mean Gaussian noise of different variance
(σ) was added and the values of the similarity measure for
different candidate transformation parameters calculated.
The known transformations were randomly chosen from
a uniform distribution of [
−20, 20] mm for translation
along along x-andy-axis(T
x
and T
y
)and[−10, 10]
mm for translation along z axis (T
z
). For rotation the
corresponding ranges were [
−20, 20] degrees (R
x
, R
y
, R
z
).
Thus in all figures, the x-axis shows the relative error between
the actual transformation and candidate transformation. The
plots for all the 3 similarity measures show a distinct global
maximum. However, for QMI1 and QMI2, the plots are
a lot smoother than those for NMI. Using NMI produces
many local minimum, which is an undesirable attribute in
the registration task. From Figure 3, we see that, besides
being noisy the plot for NMI is also inaccurate as the global
maximum is at a nonzero relative error. This inaccuracy is
evident for QMI1 also. However, QMI2 is accurate for these
cases where the global maximum is found for zero-relative
error and the measure varies in a smooth manner.
It is to be kept in mind that the profile for the different
similarity measures in Figure 3 is for σ
= 0.08. For σ ≤ 0.06
the performance of QMI1 and QMI2 is comparable, that
is, the maximum of the similarity measures is mostly at
zero relative error. When σ>0.06, QMI2 shows a superior
performance demonstrating the efficacy of a neurobiology
based saliency model. Similarly, for σ
≤ 0.04, performance
of NMI is comparable to the other two saliency measures
but degrades once σ>0.04. The corresponding threshold for
QMI2 is σ
= 0.083. The accuracy (from (22)) in recovering
the correct transformation was 79.4% for NMI, 89.7% for
QMI1, and 98.2% for QMI2.
In the previous cases motion was simulated on a pre- or
postcontrast image and the simulated image is registered to
the original image. To test for the effectiveness of registering
precontrast images to postcontrast images (or vice-versa) we
carried out the following experiments. A pair of images, one
each from pre- and postcontrast stages, were selected such
that they had very little motion between them as confirmed
by observers and manual registration parameters. Rotation
and translation motion were individually simulated on one
of the images which served as the floating image. The floating
image was then registered to the other image which was
the reference image. The similarity measure values were
determined for each candidate transformation parameter.
Figure 4 shows a case where QMI1 fails to get the actual
transformation, a shortcoming overcome by QMI2.
In most cases, NMI was unable to detect the right
transformation between a pair of pre- and postcontrast
images. Figure 4(a) shows two maxima for NMI at nonzero
error, in addition to being noisy. Such characteristics are
undesirable for registration. For QMI1 although there are no
multiple maxima, it is at nonzero relative error. It is observed
that even though QMI1 performs better than NMI due to use
of saliency, QMI2 outperforms both of them.
The accuracy rate for registering DCE images was 32.4%
for NMI, 84.5% for QMI1, and 98.7% for QMI2. The low
registration accuracy of NMI makes it imperative that we
investigate the reason behind it. We shall do this with the help
of an example.
Let us consider a 5
× 5 image patch with intensity
values as shown in Figure 5(a). With its different intensity
values at different locations, it is similar to an image
showing the kidney and the background, as shown in
Figure 5(b). The pixels with intensity value 2 correspond
to the kidney and the pixels with intensity value 3 are the
background pixels. In the precontrast stage, the background
is generally brighter than the kidney. With progressive wash
in of contrast agent the intensity of the kidney increases.
Figure 5(c) shows the change in intensity where some kidney
pixels now have intensity value 3. It is similar to progressive
contrast enhancement where certain kidney tissues first
exhibit intensity increase followed by the rest of the kidney.
The corresponding patch is shown in Figure 5(d).
We want to register the central 3
× 3 patch in image
Figure 5(a) similar to a region of interest, the values of
which are highlighted in bold. The intensity values of
Figure 5(c) only indicate contrast enhancement without any
kind of motion. For an ideal registration, the central patch
of Figure 5(a) should give maximum value of NMI (from
[37]) for the 3
× 3centralpatchofFigure 5(c). The NMI
valueinthiscaseis1.88. However, the maximum value is
obtained for the image patch shown in bold in Figure 5(c)
(NMI
= 1.95), which corresponds to a displacement of one
pixel to the left and one pixel down. Although there is no
translation motion, the maximum value of NMI is obtained
for parameters corresponding to such motion. The intensity
EURASIP Journal on Image and Video Processing 11
0
10
20
30
40
50
60
[
−5, 5] [−10, 10] [−20, 20] [−30,30]
Misalignement in rotation (mm)
NMI
QMI1
QMI2
Succesful registrations for rotation
(a)
0
10
20
30
40
50
60
[
−15, 15] [−20, 20] [−30, 30]
Misalignment in translation (mm)
NMI
QMI1
QMI2
Successful registrations for translation
(b)
Figure 6: Robustness performance for (a) rotation and (b) translation. The image pairs belong to the same stage of contrast enhancement.
x-axis shows range of transformation parameters while y-axis shows the number of correct matches.
0
10
20
30
40
50
60
[
−5, 5] [−10, 10] [−20,20] [−30, 30]
Misalignment (degrees)
NMI
QMI1
QMI2
Successful registrations for rotation
(a)
0
10
20
30
40
50
60
[
−15, 15] [−20, 20] [−30, 30]
Misalignment in translation (mm)
NMI
QMI1
QMI2
Successful registrations for translation
(b)
Figure 7: Robustness performance when registering contrast enhanced images. Results for (a) rotation and (b) translation. Images belong
to different contrast enhanced stages. x-axis shows range of transformation parameters while y-axis shows the number of correct matches.
change in the image patch is quite similar to what we observe
for DCE images of the kidney. Consequently, the maximum
value is obtained at nonzero relative error and more than
one maximum is observed for many cases. Thus, there are
a significantly high number of misregistrations using NMI
which contributes to its high error rate.
From these observations, we infer that NMI performs
well when a particular intensity in the first image (I
f
)is
mapped to a distinct intensity in the second image (I
r
). If two
intensity values in I
f
are mapped to the same intensity value
in I
r
or vice-versa then NMI leads to poor matching. Due to
contrast enhancement, it is very common to find more than
12 EURASIP Journal on Image and Video Processing
Table 2: Average translation errors for rigid registration. NMI is
normalized mutual information. QMI1 is the measure in [20] using
scale-space maps. QMI2 is our approach using the neurobiology-
based saliency model. All values are in units of mm.
Dataset NMI QMI1 QMI2
Dataset1 (4.8,4.3,0.5) (2.0,1.7,0.3) (1.2,1.3,0.2)
Dataset2 (5.1,5.7,0.4) (1.3,1.4,0.4) (1.2,1.2,0.2)
Dataset3 (5.0,4.7,0.6) (1.7,1.7,0.3) (1.3,1.2,0.3)
Dataset4 (5.2,5.0,0.6) (1.5,1.6,0.4) (1.3,1.2,0.2)
Dataset5 (4.7,4.8,0.7) (1.7,1.7,0.4) (1.2,1.3,0.2)
Dataset6 (5.1,4.9,0.5) (1.52,1.4,0.3) (1.1,1.0,0.2)
Dataset7 (5.2,5.9,0.4) (1.4,1.5,0.2) (1.3,1.4,0.1)
Dataset8 (6.5,6.1,0.4) (1.7,1.6,0.2) (1.2,1.0,0.1)
Dataset9 (4.9,4.2,0.5) (1.7,1.5,0.3) (1.2,1.1,0.1)
Dataset10 (5.4,5.4,0.5) (1.4,1.3,0.3) (1.3,1.2,0.1)
Average Error (5.2,5.1,0.5) (1.6,1.5,0.3) (1.2,1.2,0.2)
Table 3: Average rotation errors for rigid registration. NMI is
normalized mutual information. QMI1 is the measure in [20] using
scale-space maps. QMI2 is our approach using the neurobiology-
based saliency model. All values are in units of degrees.
Dataset NMI QMI1 QMI2
Dataset1 (0,0,2.75) (0,0,0.56) (0,0,0.43)
Dataset2 (0,0,2.71) (0,0,0.50) (0,0,0.44)
Dataset3 (0,0,2.67) (0,0,0.55) (0,0,0.41)
Dataset4 (0,0,2.66) (0,0,0.53) (0,0,0.39)
Dataset5 (0,0,2.72) (0,0,0.52) (0,0,0.40)
Dataset6 (0,0,4.81) (0,0,0.53) (0,0,0.32)
Dataset7 (0,0,4.23) (0,0,0.65) (0,0,0.44)
Dataset8 (0,0,3.98) (0,0,0.75) (0,0,0.29)
Dataset9 (0,0,3.12) (0,0,0.54) (0,0,0.31)
Dataset10 (0,0,3.33) (0,0,0.58) (0,0,0.24)
Average Error (0,0,3.31) (0,0,0.57) (0,0,0.36)
one intensity mapped to a single intensity. Consequently,
NMI-based registration is prone to error which is reflected
in the error measures.
4.3. Robustness of Registration. A robust registration algo-
rithm should be able to recover the true transformation
between two images even if the initial misalignment between
them is very large. We evaluate the robustness of NMI,
QMI1, and QMI2 under various amounts of initial mis-
alignment between two kidney MR images. Four sets of
tests were performed where the degree of initial misaligned
rotation angles were randomly picked from four different
rotation ranges, that is, [
−5, 5], [−10, 10], [−20, 20], and
[
−30, 30] degrees. Similarly, misalignment was simulated
for translational motion in the x, y,andz directions. The
misalignment values varied between [
−15, 15], [−20, 20] and
[
−30, 30] mm. For each misalignment range, we performed
50 registrations between different pairs of images. Zero mean
Gaussian noise of variance 0.08 was added to the images.
The number of successful registrations for each type of
similarity measure is shown in Figure 6. Figure 6(a) shows
the numbers for rotation misalignment, and Figure 6(b)
shows results for translation misalignment. All the image
pairs were from the same stage of contrast enhancement,
either precontrast or postcontrast stage. For a small mis-
alignment range the degree of misregistration is very low
for all the similarity measures (0 for all similarity measures
when misalignment is [5, 5]). As the misalignment range
increases, the number of successful registration decreases
for all similarity measures but is still high for saliency-
based similarity measures, especially QMI2. The robustness
of NMI reduces drastically with an increase in misalignment
range while for QMI1 higher misalignment ranges also affect
its performance. However, the performance of QMI2 in
particular is not much affected. For all cases of rotation
misalignment, the accuracy of registration is a minimum of
90% for QMI2. From Figure 6(b), we can draw the same
conclusions for translational misalignment.
In Figure 7 we present results for similar experiments
but in this case the source-target image pair comprised of
a pre- and postcontrast image. Similar to the experiments
in Section 4.2 for contrast enhanced images, we chose pairs
of images that had very little translation or rotation motion
between them (a fact confirmed by observers and manual
registration parameters). From the registration accuracies in
Figures 7(a) and 7(b), we see that for registering contrast
enhanced image pairs, NMI shows inferior performance
compared to saliency-based similarity measures as it is
unable to account for intensity changes due to contrast
enhancement. For a small misalignment range, a large num-
ber of inaccurate registrations were observed. Compared to
Figure 6, we observe that in Figure 7 there is not a large
difference in results for QMI1 and QMI2.
The average translation error along the 3 axes was
(4.32, 4.1, 0.81) mm for NMI, (1.1, 1.32, 0.5) mm for QMI1,
and (0.6, 0.7, 0.1) mm for QMI2. The average rotation errors
were(0,0,2.2)degreesforNMI,(0,0,0.7) degrees for QMI1
and (0, 0,0.3) degrees for QMI2. The maximum errors for
simulated motion was 10 mm and 6
◦
for NMI, 4 mm and 3
◦
for QMI1, and 2 mm and 1
◦
for QMI2.
From Figures 6 and 7, we infer that as long as there is no
drastic intensity change between a pair of images, NMI gives
good performance up to a certain misalignment range. But
with intensity change due to contrast enhancement NMI’s
performance drops. To get an average error measure, we
simulated misalignment in all images at different noise levels
except the first image of the sequence. The known simulated
motion was in the range of [
−20, 20] mm for translation
and [
−20, 20] degrees for rotation. The manual registration
parameters were with respect to the first image which serves
as the reference image. The new displacement is equal to the
sum of simulated displacement and original displacement.
The floating image was registered to the reference image and
the registration error calculated according to the following
steps. Let m
recv
be the recovered motion, m
sim
be the
simulated motion and m
org
be the original motion from
EURASIP Journal on Image and Video Processing 13
Figure 8: Difference images highlighting performance of our registration algorithm. Columns 1–3 show reference image, floating image, and
difference image before registration. Columns 4–6 show difference images after registration using NMI, QMI1, and QMI2, respectively. Rows
1 and 2 show pairs of images belonging to different stages of contrast enhancement. Rows 3 and 4 show images where the reference-floating
image pair was from either pre- or postcontrast stage.
manual registration parameters. The error in registration is
given by
m
err
% =
m
err
m
sim
+ m
org
×100,
(23)
where m
err
=|m
sim
+ m
org
− m
recv
| is the registration error.
The average registration error for different levels of noise is
given in Ta ble 1. Similarly, to get an idea of the comparative
performance of the three similarity measures, we also
calculate their individual registration accuracy percentages
for simulated motion. Registration was considered accurate
if the error (from (23)) was less than 10% and the results are
shown in Ta bl e 1.
4.4. Registration Accuracy for Real Patient Data. The reg-
istration accuracy of the different similarity measures is
determined by registering real patient datasets of DCE
kidney images. The reference image was the first from
the image sequence as the manual registration parameters
are with respect to the first image. We compare the error
between recovered transformation and the transformation
parameters as determined by manual correction of an expert.
In Figure 8, we show reference-floating image pairs along
with the difference images before and after registration.
The first and second columns show the reference image
followed by the floating image and the difference image
before registration is shown in the third column. The three
subsequent columns show the difference images after regis-
tration using NMI, QMI1, and QMI2, respectively. The first
2 rows show cases where one image of the reference-floating
image pair was from the precontrast stage and the other
belonged to the postcontrast stage. Here the performance of
NMI does not measure upto that of QMI1 and QMI2. The
difference images after using NMI in registration show a lot
of artifacts which have been improved upon by the saliency
based measures. Also, we find QMI2 to perform better than
QMI1 in registering contrast enhanced images. Rows 3 and
4 show examples where the floating and reference images
both belong to the precontrast or postcontrast stage. In such
a scenario, the registration achieved by NMI is comparable
to QMI1 and QMI2 although the saliency-based measures
show better results. The performance of different similarity
measures is summarized in Tables 2 and 3.
14 EURASIP Journal on Image and Video Processing
For all datasets, NMI shows a higher error measure
compared to QMI1 and QMI2. This can be attributed to the
errors due to registering pre- and postcontrast image pairs.
ForNMI,themaximumerrorwasashighas12mmfor
translation and 6 degrees for rotation. Such a large error is
not desirable, especially in medical image registration. For
QMI1 the maximum error was 5 mm and 3 degrees and the
corresponding values for QMI2 were 3 mm and 2 degrees,
respectively. Moreover, the average error values for NMI were
higher than that of QMI1 and QMI2. For translation along z-
axis, there was no significant difference between error values
of different similarity measures as there is hardly any motion
along the z-axis. For rotation, we see that the error values
for x-andy-axis are all 0 because there is no rotation about
these axes. Rotational motion is observed only about the z-
axis with the average error measures for NMI much greater
than those for QMI1 and QMI2.
4.5. Computation Time. The difference between our method
and the one proposed in [20] is the choice of saliency models.
While we use the saliency model of [22], Luan et al. use
the scale-space method of [21].Thesourcecodeforboth
the methods is available from the websites of the respective
authors. For a kidney image of dimension 65
×70, the average
time taken to calculate the scale space map and identify
salient regions was 0.11 seconds while the neurobiology
based saliency map could be computed in 0.09 seconds
on average. The difference in computing saliency maps is
not significant and in registering a large number of images
by our method, the saving in computation time is a few
seconds.
Another difference from the method in [20]isan
optimization scheme that incorporates a certain degree of
randomness, thus reducing the chances of being trapped in
a local minimum. This modification involves a marginally
greater number of steps leading to a slight increase in
computation time. While the average time taken by our
method (inclusive of calculating saliency maps) is 15.33 s for
registering a pair of volumes, the corresponding average time
for the method in [20]was15.02 s. By Thevenaz’s method,
the computation time reduces to 6.34 s using QMI2 and
5.91 s for QMI1.
5. Discussion and Conclusion
In this work, we have investigated a neurobiological model
of visual saliency and its use in registering perfusion images.
The motivation was to determine whether the HVS’s ability
to recognize and match images in presence of noise and
contrast enhancement can be simulated by a computational
model. We register MR kidney perfusion volumes because
they exhibit rapid intensity change and the acquired datasets
also have a significant amount of noise.
The neurobiology-based saliency model is used because it
produces very similar saliency maps for a pair of images with
intensity change between them and facilitates registration in
the face of contrast enhancement. We do a comparative study
of the effectiveness of different saliency models for registering
renal perfusion images and find the neurobiology-based
model to be better than scale-space maps.
Several factors contribute to the superior performance
of the neurobiological model of saliency. There are certain
inherent faults in the scale space method used in [20]toget
saliency information. First, the change in intensity assigns
different saliency values to corresponding voxels in an image
pair. This is undesirable for registration. Second, there is
the problem of the choice of an appropriate scale (neigh-
borhood) for calculating the local entropy of a voxel. The
scale which gives the maximum value of entropy is chosen
as the best scale, thus making the procedure computationally
intensive. Third, since it is an entropy-based method, noise
can greatly affect the entropy value leading to erroneous
results. Fourth, a scale-space saliency map of an image
does not truly represent what is salient to the human eye.
In the neurobiology model, the center-surround approach
assigns the same saliency value to corresponding pixels in
an image pair and a Gaussian pyramidal representation of
the image eliminates the need for determining the optimal
scale for each voxel. An important part of the model is the
process of lateral inhibition that suppresses noise giving rise
to a saliency map that has distinctly salient regions. Lastly,
the neurobiology model has been used to predict human
fixations in a scene and there is high degree of correlation
between the predicted and actual fixations.
Our optimization technique also contributes to
improved performance of our method. Instead of following
a set pattern for optimizing the DOFs, we introduce a degree
of randomness in the entire optimization scheme based
on Powell’s method. A 4-level multiresolution approach
was adopted where candidate transformation parameters
for different DOFs were first calculated at the coarsest
level and the solution propagated to finer levels. The
optimization routine was repeated at the finer levels to get
the final transformation. The sequence of DOFs optimized
is random. By adopting this method the optimization
scheme avoids being trapped in local optima and reachs
the global optima, as determined by an exhaustive search,
in most of the experiments. This approach also gives better
performance than the optimization scheme outlined in
[33]. We also use a derivative-based optimizer (Th
´
evenaz’s
method) to determine the optimal registration parameters.
If the starting point for the search is close to the actual
optima ths method gives accurate results in significantly
less time. An approach using Powell’s method for search at
the coarsest level followed by Thevenaz’s method at finer
levels gives registration accuracy close to what is obtained
using Powell’s method at all levels but in significantly lesser
computation time.
Thus, we conclude that the neurobiological model of
saliency gives a fairly accurate working of the HVS-based
on bottom-up cues alone. It is robust to varying degrees
of noise and simulated motion. The original model in [22]
uses color, intensity, and edge orientation as features in
determining the saliency map. But, for our work, we use only
intensity and edge orientation information since our datasets
are in gray scale. The findings of our experiments provide
a basis for investigating how saliency can be used in more
EURASIP Journal on Image and Video Processing 15
challenging registration tasks and also in other computer
vision applications like tracking.
Acknowledgments
The authors would like to thank Dr. Vivian S. Lee, Professor
of Radiology, Physiology, and Neuroscience, Vice-Dean for
Science, Senior Vice-President, and Chief Scientific Officer,
New York University Medical Center, for providing the
datasets. This work was supported by NUS Grant R-263-000-
470-112.
References
[1] F. Dufaux and J. Konrad, “Efficient, robust, and fast global
motion estimation for video coding,” IEEE Transactions on
Image Processing, vol. 9, no. 3, pp. 497–501, 2000.
[2] M. Irani and S. Peleg, “Motion analysis for image enhance-
ment: resolution, occlusion, and transparency,” Journal of
Visual Communication and Image Representation, vol. 4, no.
4, pp. 324–335, 1993.
[3] M. Irani, P. Anandan, and S. Hsu, “Mosaic based representa-
tions of video sequences and their applications,” in Proceedings
of the 5th International Conference on Computer Vision,pp.
605–611, June 1995.
[4]D.L.G.Hill,P.G.Batchelor,M.Holden,andD.J.Hawkes,
“Medical image registration,” Physics in Medicine and Biology,
vol. 46, no. 3, pp. R1–R45, 2001.
[5]Z.Lao,D.Shen,A.Jawadetal.,“Automatedsegmentation
of white matter lesions in 3D brain MR images, using
multivariate pattern classification,” in Proceedings of the 3rd
IEEE International Symposium on Biomedical Imaging,pp.
307–310, April 2006.
[6] T. Song, V. S. Lee, H. Rusinek, M. Kaur, and A. F. Laine,
“Automatic 4-D registration in dynamic mr renography based
on over-complete dyadic wavelet and Fourier transforms,”
in Proceedings of the 8th International Conference on Medical
Image Computing and Computer-Assisted Intervention (MIC-
CAI ’05), vol. 3750 of Lecture Notes in Computer Science,pp.
205–213, Palm Springs, Calif, USA, October 2005.
[7] D. J. Hawkes, “Algorithms for radiological image registration
and their clinical application,” Journal of Anatomy, vol. 193,
no. 3, pp. 347–361, 1998.
[8] P. Viola and W. M. Wells III, “Alignment by maximization
of mutual information,” International Journal of Computer
Vision, vol. 24, no. 2, pp. 137–154, 1997.
[9] A. Collignon, F. Maes, D. Delaere, D. Vandermeulen, P.
Suetens, and G. Marchal, “Automated multimodality image
registration based on information theory,” in Proceedings of the
International Conference on Information Processing in Medical
Imaging (IPMI ’95), pp. 263–274, 1995.
[10] Y. Keller, A. Averbuch, and M. Israeli, “Pseudopolar-based
estimation of large translations, rotations, and scalings in
images,” IEEE Transactions on Image Processing,vol.14,no.1,
pp. 12–22, 2005.
[11] G. Wolberg and S. Zokai, “Robust image registration using
log-polar transform,” in Proceedings of the International Con-
ference on Image Processing (ICIP ’00), pp. 493–496, Vancouver,
Canada, September 2000.
[12] B. S. Reddy and B. N. Chatterji, “An FFT-based technique for
translation, rotation, and scale-invariant image registration,”
IEEE Transactions on Image Processing, vol. 5, no. 8, pp. 1266–
1271, 1996.
[13] L. Lemieux, R. Jagoe, D. R. Fish, N. D. Kitchen, and D. G.
T. Thomas, “A patient-to-computed-tomography image regis-
tration method based on digitally reconstructed radiographs,”
Medical Physics, vol. 21, no. 11, pp. 1749–1760, 1994.
[14] Y. Keller and A. Averbuch, “A projection-based extension to
phase correlation image alignment,” Signal Processing, vol. 87,
no. 1, pp. 124–133, 2007.
[15] A. Wong and P. Fieguth, “Fast phase-based registration of
multimodal image data,” Signal Processing,vol.89,no.5,pp.
724–737, 2009.
[16] D. Shen and C. Davatzikos, “HAMMER: hierarchical attribute
matching mechanism for elastic registration,” IEEE Transac-
tions on Medical Imaging, vol. 21, no. 11, pp. 1421–1439, 2002.
[17] E.L.W.Giele,J.A.DePriester,J.A.Blometal.,“Movement
correction of the kidney in dynamic MRI scans using FFT
phase difference movement detection,” Journal of Magnetic
Resonance Imaging, vol. 14, no. 6, pp. 741–749, 2001.
[18] S. N. Gupta, M. Solaiyappan, G. M. Beache, A. E. Arai, and T.
K. F. Foo, “Fast method for correcting image misregistration
due to organ motion in time-series MRI data,” Magnetic
Resonance in Medicine, vol. 49, no. 3, pp. 506–514, 2003.
[19] Y. Sun, M P. Jolly, and J. M. F. Moura, “Integrated registration
of dynamic renal perfusion MR images,” in Proceedings of the
International Conference on Image Processing (ICIP ’04),pp.
1923–1926, Singapore, October 2004.
[20] H. Luan, F. Qi, Z. Xue, L. Chen, and D. Shen, “Multimodality
image registration by maximization of quantitative-qualitative
measure of mutual information,” Pattern Recognition, vol. 41,
no. 1, pp. 285–298, 2008.
[21] T. Kadir and M. Brady, “Saliency, scale and image description,”
International Journal of Computer Vision,vol.45,no.2,pp.83–
105, 2001.
[22] L. Itti, C. Koch, and E. Niebur, “A model of saliency-based
visual attention for rapid scene analysis,” IEEE Transactions on
Pattern Analysis and Machine Intelligence, vol. 20, no. 11, pp.
1254–1259, 1998.
[23] L. Itti and C. Koch, “A saliency-based search mechanism for
overt and covert shifts of visual attention,” Vision Research, vol.
40, no. 10–12, pp. 1489–1506, 2000.
[24] S. Feng, D. Xu, and X. Yang, “Attention-driven salient edge(s)
and region(s) extraction with application to CBIR,” Signal
Processing, vol. 90, no. 1, pp. 1–15, 2010.
[25] H Y. Chen and J J. Leou, “Saliency-directed image interpola-
tion using particle swarm optimization,” Signal Processing, vol.
90, no. 5, pp. 1676–1692, 2009.
[26] F. Bergholm, “Edge focussing,” IEEE Transactions on Pattern
Analysis and Machine Intelligence, vol. 9, no. 6, pp. 726–741,
1987.
[27] R. Deriche and G. Giraudon, “A computational approach
for corner and vertex detection,” International Journal of
Computer Vision, vol. 10, no. 2, pp. 101–124, 1993.
[28] L. W. Renninger, P. Verghese, and J. Coughlan, “Where to
look next? Eye movements reduce local uncertainty,” Journal
of Vi sion, vol. 7, no. 3, article 6, pp. 1–17, 2007.
[29] H. Greenspan, S. Belongie, R. Goodman, P. Perona, S. Rakshit,
and C. H. Anderson, “Overcomplete steerable pyramid filters
and rotation invariance,” in Proceedings of the IEEE Computer
Society Conference on Computer Vision and Pattern Recogni-
tion, pp. 222–228, Seattle, Wash, USA, June 1994.
[30] M. W. Cannon and S. C. Fullenkamp, “A model for
inhibitory lateral interaction effects in perceived contrast,”
Vision Research, vol. 36, no. 8, pp. 1115–1125, 1996.
16 EURASIP Journal on Image and Video Processing
[31] M. Belis and S. Guiasu, “A quantitative-qualitative measure
of information in cybernetic systems,” IEEE Transactions on
Information Theory, vol. 14, pp. 593–594, 1968.
[32] T. M. Cover and J. A. Thomas, Elements of Information Theory,
Wiley, New York, NY, USA, 1991.
[33] M. Jenkinson and S. Smith, “A global optimisation method
for robust affine registration of brain images,” Medical Image
Analysis, vol. 5, no. 2, pp. 143–156, 2001.
[34] W. H. Press, B. P. Flannery, S. A. Teukolsky, and W. T.
Vetterling, Numerical Recipes in C, chapter 10, Cambridge
University Press, Cambridge, UK, 2nd edition, 1992.
[35] P. Th
´
evenaz and M. Unser, “Optimization of mutual informa-
tion for multiresolution image registration,” IEEE Transactions
on Image Processing, vol. 9, no. 12, pp. 2083–2099, 2000.
[36] The Insight Segmentation and Registration Toolkit,
/>[37] C. Studholme, D. L. G. Hill, and D. J. Hawkes, “An overlap
invariant entropy measure of 3D medical image alignment,”
Pattern Recognition, vol. 32, no. 1, pp. 71–86, 1999.