Báo cáo sinh học: " Research Article Minimum Variance Signal Selection for Aorta Radius Estimation Using Radar" pptx
Bạn đang xem bản rút gọn của tài liệu. Xem và tải ngay bản đầy đủ của tài liệu tại đây (980.19 KB, 13 trang )
Hindawi Publishing Corporation
EURASIP Journal on Advances in Signal Processing
Volume 2010, Article ID 682037, 13 pages
doi:10.1155/2010/682037
Research Article
Minimum Variance Signal Selection for
Aorta Radius Estimation Using Radar
Lars Erik Solberg,
1
Svein-Erik Hamran,
2, 3
Tor Berger,
2
and Ilangko Balasingham
1, 4
1
Interventional Centre, Oslo University Hospital and Interventional Centre, Institute of Clinical Medicine,
University of Oslo, Sognsvannsveien 20, 0027 Oslo, Norway
2
Forsvarets forskningsinstitutt, Postboks 25, 2027 Kjeller, Norway
3
Department of Geosciences, University of Oslo, P.O. Box 1047 Blindern, 0316 Oslo, Norway
4
Department of Electronics and Te lecommunications, Norwegian University of Science and Technology (NTNU),
7491 Trondheim, Norway
Correspondence should be addressed to Lars Erik Solberg,
Received 9 March 2010; Accepted 7 June 2010
Academic Editor: Christophoros Nikou
Copyright © 2010 Lars Erik Solberg et al. This is an open access article distributed under the Creative Commons Attribution
License, which permits unrestricted use, distribution, and reproduction in any medium, provided the original work is properly
cited.
This paper studies the optimum signal choice for the estimation of the aortic blood pressure via aorta radius, using a monostatic
radar configuration. The method involves developing the Cram
´
er-Rao lower bound (CRLB) for a simplified model. The CRLB for
model parameters are compared with simulation results using a grid-based approach for estimation. The CRLBs are within the
99% confidence intervals for all chosen parameter values. The CRLBs show an optimal region within an ellipsoid centered at 1 GHz
center frequency and 1.25 GHz bandwidth with axes of 0.5 GHz and 1 GHz, respectively. Calculations show that emitted signal
energy to received noise spectral density should exceed 10
12
for a precision of approximately 0.1 mm for a large range of model
parameters. This implies a minimum average power of 0.4 μW. These values are based on optimistic assumptions. Reflections,
improved propagation model, true receiver noise, and parameter ranges should be considered in a practical implementation.
1. Introduction
Our research effort addresses the issue of estimating the
central blood pressure by observing the radius of the aorta
as a function of time using radar techniques and thereby
establishing a noninvasive technique.
Noninvasive measurements of blood pressure (BP) can
be performed using the sphygmomanometer, photoplethys-
mograph [1], tonography [2], and pulse transit time [3].
However, they all rely on peripheral measurement points.
This may constitute a problem in certain situations such as
when flow redistribution to central parts of the body (heavy
injury, temperature, etc.) degrades these measurements;
another situation where central measurements may prove
advantageous is in presence of strong movements of the
peripheral locations which affect pressure measurements [4].
The use of radar-based approaches in a medical context
is neither new nor common. An interesting overview of
the use of radar for medical applications is presented in
[5], which traces research back to the late 1970s. It seems
that renewed interest has been spurred following McEwan’s
Micropower Impulse Radar [6] in the early 1990s which
combined ultrawide band (UWB) pulses with very low
power, small size, and low system cost. It also seems that
some of this momentum in research related to UWB pulses
has been founded on dubious claims of exceptional behavior
related to the impulsive nature of the signal, such as specific
penetration, resonances, and presumed inadequacy of a
Fourier type description, which have been refuted [7].
The research into medical sensor applications include
apexcardiography, heart rate, respiration rate, heart-rate
variability, blood pressure pulse transit time based on
peripheral locations, and associated applications such as
through rubble or walls vital signs detection [5, 6, 8]. With
respect to imaging, the use of an antenna array for the early
detection of breast cancer [9, 10] should be mentioned.
2 EURASIP Journal on Advances in Signal Processing
The present research activities on breast cancer and
vital signs detections differ with respect to our objective of
estimating blood pressure. In breast cancer detection, the
concerned tissues are predominantly less lossy whereas in
respiration and heart-rate estimation the radar signature can
be due to the air-skin interface [11]. Finally, our active use
of a cylindrical target structure distinguishes our approach
from those mentioned.
1.1. Physiolog ical Problem Description. The aim of our
project is the estimation of blood pressure and possibly other
clinically pertinent parameters. We believe the following
phenomena apply to the aorta and, hence, may serve as the
basis for estimation approaches.
(1) Sugawara et al. [12] showed a linear relationship
between percentage changes in instantaneous blood
pressure and diameter, based on measurements on
the carotid artery.
(2) According to [3, 4, 13], there is a nonlinear rela-
tionship between mean arterial pressure (
P)and
compliance (see below).
Common to the above mentioned approaches, the radar-
based method will need to estimate the aortic diameter as
a function of time (d(t)).
The key point of the approaches based on the second
phenomena is the relationship between the elasticity, of
which compliance is a measure, of a homogeneous, circular
tube and the speed of propagation of a pressure pulse along
the tube and presented by Otto Frank in 1926 (according to
[14]),
v
=
K
L
ρ
=
1
ρC
L
, C
L
=
dA
dP
=
1
K
L
,
(1)
where v is the speed of the pulse propagating along the aorta,
K
L
is the bulk elastic modulus per unit length, C
L
is the
compliance, A is cross-sectional area, P is arterial pressure,
and ρ is the blood density (ρ is 1.05 g/cm
3
). Compliance is
used by clinicians as a local measure of arterial elasticity.
This equation directly relates pulse velocity to compliance.
An often-cited and similar formulation of this relationship
is provided in Moen-Korteweg’s equation which uses the
incremental Young’s elastic modulus E
inc
,
v
=
E
inc
h
ρ
(
2r
)
=
1
2ρ
ΔP
Δr/r
, E
inc
=
ΔP
Δr/r
·
r
h
,
(2)
where Δr is a change in aortic radius associated with a change
in pressure ΔP at an aortic radius r,andh is the aortic wall
thickness. Hence, the parameters (v, r, Δr)providesufficient
information for estimating C
L
and thereby P based on the
above nonlinear relationship. As a by-product, the procedure
also provides for heart rate (HR), and possibly an indication
on pulse pressure.
The diameter variations of the aorta have been measured
by Stefanidis [15] using a precise and invasive measurement
method based on pressure and diameter sensors introduced
through catheters. It concludes that typical diameter peak-
to-peak amplitudes for a normal population is 2.18
±0.44 mm.
This means the measurement precision of the aorta diameter
variations must be at a fraction of a millimeter, a strict
requirement also for a radar-based method.
1.2. Object of the Current Article. In anticipation of the
expected strong attenuation in our application, the current
article addresses issues related to the obtainable precision
from a system’s point of view. What criterion may be
identified in order to achieve the required performance?
To answer this question, the Cram
´
er-Rao lower bound
(CRLB) is used as a selection criterion, and which will map
the performance for a range of parameter values. System
parameters of interest include the necessary energy/power
and optimum choices for center frequency and bandwidth,
if such optima exist. In this approach, we will focus on
the properties of the human body as a channel thereby
disregarding the antenna selection. This implies that in the
joint antenna and channel system, we are only optimising the
second subsystem and tacitly assuming that an appropriate
antenna exists.
The medium in which the radar signal propagates is lossy
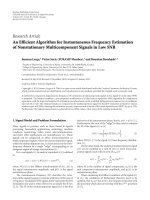
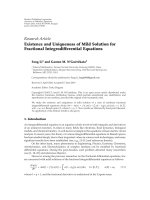
and dispersive, and the geometry is complex, see Figure 1.
To answer the above question a simulations-based approach
could be considered, however, it would be slow and may not
provide further insight into the problem. Instead, we have
opted for an analytical approach based on a mathematical
representation of the channel and on the derivation of the
CRLB. In order to obtain a mathematically tractable model,
a simplified geometry is used: we consider a 2D problem
with a cylinder of time-varying radius of lossy material
immersed into a region of a different lossy material. Between
the transmitter and aorta and between the aorta and receiver
antenna the propagation model is planar. The time variation
is considered to be static at each measurement instant, while
dynamic between measurements. The estimation problem
is that of estimating the radius of the cylinder without
knowledge of its depth, and by allowing the subtraction
of two responses separated in time and corresponding to
distinct radii. Justification of this model simplification will
be elaborated in subsequent sections.
This choice of geometry departs from a realistic scenario
especially by disregarding multipath components reflected
via the aorta. It also assumes the aorta is the only dynamic
tissue with a significant response within the relevant range
depth. This hypothesis may prove wrong as several organs in
the human body, for instance, the lungs and the stomach,
are in motion and may be a source of clutter within the
relevant range. Also disregarded, reflection and transmission
coefficients at tissue boundaries may lead to increased path
loss. These effects will probably degrade estimator precision.
Therefore, the results obtained in this paper, by limiting its
scope to a simplified geometry, may prove optimistic in a
realistic scenario.
The above problem statement is akin to the estimation of
range in a classical radar context, to delay in communications
or to localization in wireless networks, where the CRLB
EURASIP Journal on Advances in Signal Processing 3
Average material(γ)
Aorta (γ)
r
Δr
R
Figure 1: The image represents a gray scale encoding of tissue types
and includes cancellous bone, bone marrow, blood, lungs, muscle,
fat, skin, nerves, and so forth. In the model, all but the blood
contained in the aorta contribute to an average material (
γ)based
on surface areas. The two circles around the aorta represent the
aorta at two different instants; r, R refers to the first of these, while
r + Δr, R
− Δr would refer to the second.
and the maximum likelihood estimation are well defined.
However, due to the lossy channel, these results cannot be
applied directly. To the best of the authors’ knowledge, the
CRLB for a comparable problem has not been established;
most results assume channels with signals propagating
essentially in nondispersive, nonlossy materials and focus
on channel behavior in statistical terms and in which mul-
tiple paths exist between transmitter and receiver. Another
common objective for the development of CRLBs has been
in analyzing performance of modulation techniques. The
survey in [16] provides an overview of lower bounds in time-
delay estimation.
After a brief presentation of mathematical notation in
Section 2,inSection 3, we will derive an analytic expression
for the CRLB for a general channel model, yet will evaluate
this expression numerically for our specific channel because
even the most simplified model would result in integrals
without closed forms. The numerical results show that
there exists an optimum choice of center frequency ( f
c
)
and bandwidth (B) when ranges of parameter values are
considered. In Section 4, the theoretic results are simulated
for a set of system and parameter values
{( f
c
, B, R, r, Δr)
n
}
which will show a tight correspondence between theory and
simulation. These results are discussed in Section 5,where
also system performance in terms of target precision will be
discussed. Section 6 concludes on the findings in this paper.
2. Mathematical Notation
In the expressions that follow, lower-case letters refer
to signals in the time domain—normal if continuous
(x(t), s(t), n(t)) and bold-face if sampled (vector format;
x[m], s[m], z[m]); depending on context, these vectors may
represent random variables. Upper-case letters refer to the
frequency domain—calligraphic style if random variables
(X, N ), else bold-faced for vectors and matrices (K, X, Z,S),
while normal-faced for continuous variables (S, X).
θ denotes the true parameter values in a space Θ
of dimension p,
θ
ML
is the Maximum Likelihood (ML)
estimate, and
θ is some estimate of θ. Eventually, the model
will include three parameters: θ
= [R, r, Δr]
T
.
Subscripts will be used to signify that the associated
variable is parametrized (e.g., H
θ
, M
θ
).
The contents of a matrice (e.g., A)iswrittenA
= [a
ij
],
where i denotes row indices and j denotes column indices. If
Z
θ
is a vector parametrized by a vector θ, then its derivative
with respect to θ is defined as
Z
θ
=
dZ
θ
dθ
=
dZ
θ
[
i
]
dθ
j
. (3)
In the interest of concise notation, the following inner-
product in the Hilbert Space of finite (length N)complex
sequences will be used:
b, a
∈ C
N
, K
−1
=
K
−1
H
∈ C
N×N
,
a, b=b
H
K
−1
a, a
2
=a, a,
d
dθ
i
a
θ
, b
θ
=
da
θ
dθ
i
, b
θ
+
a
θ
,
db
θ
dθ
i
.
(4)
Here,asubscriptt will be added when K
= K
n,t
, otherwise
K
= K
n, f
will be assumed; these matrices will be defined
shortly.
For mathematical simplicity, instead of using the stan-
dard DFT, we will assume the unitary equivalent (DFT
U
):
A
[
k
]
=
1
√
N
N−1
m=0
a
[
m
]
e
−j2πmk/N
,
a, b
t
=A, B,wherea
DFT
U
←−−→ A ∧ b
DFT
U
←−−→ B.
(5)
As a unitary operator is defined by the condition that the
adjoint of the transform is its own inverse, it conserves the
inner product (5), and therefore also the norm.
3. CRLB
Several lower bounds have been developed to describe
estimator’s precision of which the CRLB and Ziv-Zakai
lower bound (ZZLB) are currently the most frequently
employed. The latter has been specifically developed for
delay estimation in the objective of improving the accuracy
of the bound at low SNR when ambiguous peaks tend to
decrease the obtainable precision over the CRLB and a
priori knowledge limits the variance of the estimator. In our
context, the necessary accuracy of estimation is expected
to require a sufficient SNR for the receiver performance to
exceed the threshold at which the ZZLB provides for a more
accurate lower bound. Incidentally, studies have shown that
the threshold effect may be pushed towards lower SNR if
some prior information may constrain the estimates to vary
around the true maximum likelihood peak [17]. We have
therefore focused on the CRLB.
4 EURASIP Journal on Advances in Signal Processing
3.1. General Transfer Function H
θ
. Inafirststage,wewill
consider the following generic signal model. A signal (s)
is emitted by the transmitter and passes through a generic
channel (H
θ
, h
θ
), which depends on a set of parameters (θ),
and is corrupted by an uncorrelated, wide-sense stationary
(WSS) random Gaussian process (n) bandlimited to W
Hertz and independent of the model parameters. The signal
plus noise is then observed (x) as follows:
x
(
t
)
={h
θ
s}
(
t
)
+ n
(
t
)
= z
θ
(
t
)
+ n
(
t
)
,
R
n
(
τ
)
E
[
n
(
t
)
n
(
t −τ
)
]
FT
←−→ Γ
n
f
,
(6)
where R
n
is the noise autocorrelation and Γ
n
its power
spectral density (PSD).
In order to develop the CRLB, a stochastic model of the
above in the form of a probability distribution is needed.
Then expressions for the score and subsequently the Fisher
Information Matrix (FIM) are derived, after which a channel
model will be discussed.
As shown in [18, Chapter 2], the information in a
bandlimited random process observed over a time interval
T is uniquely represented by values of samples spaced
Δt
= 1/(2W) apart by virtue of the Nyquist-Shannon
sampling theorem: any and every realization of the process
is represented by its sample values at these intervals because
the realizations may be recreated by interpolating with the
ideal interpolating function (a sinc for signals of infinite
duration). The distribution of the sampled, stationary,
random Gaussian process is [19]
f
θ
(
x
)
= c
n
Exp
−
1
2
x − z
θ
2
t
, K
n,t
=
R
n
t
j
− t
i
ij
,
(7)
where x, z
θ
are the sample vectors of length N = 2M +1,c
n
is a normalizing constant independent of θ, and K
n,t
is the
noise covariance matrix in the time domain.
For sufficient observation time T, the discrete Fourier
transform (DFT) coefficients are essentially independent
random variables as are the real and imaginary parts. In
the development by Van Trees [19,Volume1,Chapter3],it
was shown that transform coefficients are uncorrelated when
the orthonormal basis is composed of eigenvectors of the
covariance of the random process. Large observation time
means the eigenvectors tend towards complex exponentials.
Under these conditions, the distribution in the frequency
domain can be shown as
f
θ
(
X
)
= c
n
Exp
−
1
2
X − Z
θ
2
,
K
n, f
= E
N
[
i
]
N [j]
=
diag
Γ
n
f
k
Δt
,
(8)
where K
n, f
is the covariance matrix in the frequency domain.
We see that both the time-domain and frequency-
domain distributions show that the maximum-likelihood
estimator is also the nonlinear least-squares solution:
Frequency domain : θ
ML
= Argmin
θ∈Θ
X − Z
θ
2
=
Argmin
θ∈Θ
Z
θ
2
,
−2Re
(
X − Z
θ
)
},
(9)
Time domain :
= Argmin
θ∈Θ
x − z
θ
2
t
. (10)
In the case where the signal channel simply introduces
adelay,
Z
θ
2
is independent of θ and the second term
in (9) should hence be maximized. By using the Cauchy-
Schwartz inequality, this optimization can be shown to
be identical to searching for the maximum of the cross-
correlation. However, here both the norm and signal form
(z
θ
)aredependentuponθ and hence the “matched filter”
corresponds to a search over the parameter space (Θ)of
dimension p.
The score is the derivative of the log-likelihood,
s
(
θ; X
)
=
d
dθ
ln
f
θ
(
X
)
=−
1
2
d
dθ
X − Z
θ
2
=
Re
X − Z
θ
,
dZ
θ
dθ
i
∈ R
p
.
(11)
In the theory of maximum likelihood estimators,
θ
ML
is
chosen such that score becomes null.
Next, the FIM (J(θ)) is defined either through the vari-
ance of the score, which has expectation zero, or equivalently
through the expected value of the double-derivative,
J
(
θ
)
ij
=−E
d
dθ
j
s
(
θ; X
)
i
=−
E
Re
−
dZ
θ
dθ
j
,
dZ
θ
dθ
i
+
X − Z
θ
,
d
2
Z
θ
dθ
i
dθ
j
=
Re
dZ
θ
dθ
j
,
dZ
θ
dθ
i
,
J
(
θ
)
= Re
dZ
θ
dθ
H
K
−1
n, f
dZ
θ
dθ
.
(12)
Equation (12) uses the fact that the expectation E[X]is
Z
θ
. Although each element may be formulated as an inner
product, J(θ) may not be formulated as an inner product of
matrices Z
θ
. Using the model Z
θ
[k] = H
θ
[k]S[k]weget
J
(
θ
)
=
M
k=−M
|S[k]|
2
K
n, f
[
k, k
]
Re
dH
θ
[
k
]
dθ
dH
θ
[k]
dθ
H
.
(13)
EURASIP Journal on Advances in Signal Processing 5
Using the approximations S( f
k
) ≈ Δt
√
NS[k], K
n, f
[k, k] ≈
Γ
n
( f
k
)/Δt,and1/T = df , and assuming sufficient observa-
tion time,
J
(
θ
)
ij
≈
W
S( f )
2
Γ
n
f
Re
dH
θ
f
dθ
i
dH
θ
( f )
dθ
j
df. (14)
The CRLB are the values along the diagonal of the inverse
of the FIM, σ
2
θ
i
≥ J(θ)
−1
ii
. It follows that, generally, the
lowest CRLB for an estimator is achieved when the FIM
is maximum. Also, the CRLB of different parameters are
mutually related through the inversion of the matrix.
Given that both Γ
n
and H
θ
are determined by the
measurement situation, what remains is an intelligent choice
of the signal in order to enhance those frequencies such
that the lower bound becomes minimum. For simplicity,
assuming the signal is an ideal bandpass signal and the noise
is white (Γ
n
( f ) = Γ
0
), the above may be reformulated as
S( f )
2
=
E
s
2B
rect
f − f
c
B
+rect
f + f
c
B
,
J
(
θ
)
ij
≈
E
s
Γ
0
1
B
f
c
+B/2
f
c
−B/2
Re
dH
θ
f
dθ
i
dH
θ
( f )
dθ
j
df ,
(15)
where E
s
is the energy of the continuous signal and Γ
0
the
white noise spectral density, while B is the signal bandwidth
and f
c
its center frequency. This shows that the CRLB
scales linearly with the ratio Γ
0
/E
s
. This is the reciprocal
of the transmitted signal energy (E
s
) to the noise spectral
density (Γ
0
). If the signal energy had been referred to
the receiver end, this would have been the signal-to-noise
ratio. This expression (15) shows that the FIM components
are maximum when the average value of the integrand is
maximum. More generally, the signal PSD effectively weighs
the channel components.
3.2. Channel Model. Akeyobjectivewithamathematical
model as opposed to complex simulations is, in addition
to less computational burden, the facility of analyzing the
influence of different system parameters. However, primarily
due to the above integral even the simplest of models, for
instance, a layered representation, fails to allow for a closed-
form solution because the material properties complicate the
issue.
In Figure 1, a gray scale encoding of tissues is presented
based on the Voxel Man [20] data set, which has in turn been
based on the Visible Human Project [21]. This figure shows
that the channel between an antenna at the back and the
aorta is a complex function of geometry. In order to simplify
the mathematical representation of the problem, all materials
outside the aorta are treated as a single, lossy environment.
As justified in [22], an acceptable material representation
of the original geometry is to average the permittivity of the
materials (M ) based on the ratio of their respective area (A
m
)
to total area (A),
γ = ω
μ
m∈M
A
m
A
m
,
(16)
where ω is the angular frequency,
γ is the average material
propagation constant,
m
is the permittivity of material
with indice m,andμ is the permeability of the materials
andisassumedtohaveidenticalrelativepermeabilityof
unity. This approach was based on the analogy with a
heterogeneous one-dimensional problem with a sequence
of material properties, whose accumulated effect, while
disregarding transmission and reflection coefficients, may
be represented by a homogeneous material with average
propagation constant. By averaging permittivities instead
of propagation constants, the resulting “average properties”
were found to lie within the variation of the different tissues
involved and relatively close to the propagation constant
average, denoted “true average” in [22].
The channel model is, therefore, constructed as a cylinder
of radius r (θ[2]) immersed in a different material and at
a distance R(θ[1]) from an antenna in a monostatic radar
measurement situation. Both materials are lossy; the cylinder
material is “blood” (γ) and the surrounding material is the
above average material (
γ); all material characterizations are
originally based on C. Gabriel and S. Gabriel [23].
A third parameter in the model incorporates the fact
of subtracting two distinct radar echoes separated by some
time interval and during which the aorta radius has changed
by Δr (θ[3]). Due to the strong attenuation of biological
tissue in general, it is expected that the subtraction is
necessary to remove clutter from static materials and allow
for observing the radar echo from the aorta in presence of
much stronger reflections. This subtraction is integrated into
the model as it is expected to constitute a common part
of any estimation strategy. Furthermore, by expressing the
subtraction as a function of actual radial change, the precise
temporal behaviour of the aorta radius may be disregarded.
In [24], the theoretic response from a cylinder of
arbitrary material in a lossless material with arbitrary
propagation speed is developed (C
r
). This expression defines
two parameters: r, the radius of the cylinder and R, the
distance at which the response is observed. Here, we have
used the far field approximation of this response (R infinite)
thereby assuming that the antenna is sufficiently far from
the aortic structure compared with the wavelength in the
surrounding material. To account for the phase of the
response, R in the factor e
jγR
has been set to the radius of the
cylinder (r). From the edge of the cylinder, the “material”
transfer function (M
R
) will account for the phase due to
propagation from the antenna to the aorta and back. This
assumes a planar propagation approximation between both
transmit and receiver antenna and the aorta.
The fact of assuming a far field approximation has two
motivations: the expression in [24] assumes an incident
plane wave and the distance between the antenna and the
6 EURASIP Journal on Advances in Signal Processing
aorta (R) is close to satisfying the common criterion for the
limit of the near-field,
R
near field
=
2D
2
λ
=
2D
2
f
v
p
≤ 15 cm,
when f
≤ 5 GHz, v
p
≥ c
0
/5,
R
near field
≤ 9cm,
when f
≤ 3 GHz, v
p
≥ c
0
/5,
(17)
where v
p
is the phase velocity of the wave, D is the greater of
antenna and target dimension and is chosen as the maximum
diameter of the aorta used in this paper. Hence, the wavefront
at the aorta is nearly planar, and the reflection likewise
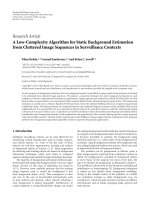
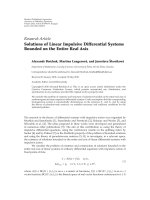
back at the antenna. In Figure 2, this model simplification
is compared with actual simulation results for r
= 10 mm.
We observe that the forms of the responses are similar
although with a flat factor F separating the two, principally
due to the 1/R
2
round-trip loss factor of cylindrical versus
planar propagation. The cylindrical propagation models
geometry, sources, and fields that are symmetrical about any
appropriately oriented 2D cross-section.
The combined, resulting channel model is hence
expressed according to the following equations. The total
response (H
θ
) is first decomposed as the subtraction of
independent radar echoes (G
r,R
) corresponding to two
distinct radii (r and r + Δr), which also implies two distinct
distances R as this has been defined relative to the front edge
of the cylinder,
H
θ
[
k
]
= G
r+Δr,R−Δr
[
k
]
− G
r,R
[
k
]
,
G
r,R
[
k
]
= M
R
[
k
]
C
r
[
k
]
.
(18)
The material transfer function is a simple exponential factor
(19), while the cylinder response (20), see Ruck et al. [24], is
an infinite series (T(r, k)) with complicated terms (A
n
(r, k))
in the form of fractions (numerator N
n
(r, k), denominator
D
n
(r, k)) of Bessel functions (J
n
(x)) and Hankel functions of
the first kind (H
n
(x)),
M
R
[
k
]
= Exp
−
jγ
k
2R
, (19)
C
r
[
k
]
=
2e
j(γ
k
r−π/4)
γ
k
T
(
r, k
)
=
2e
j(γ
k
r−π/4)
γ
k
⎧
⎨
⎩
∞
n=0
A
n
(
r, k
)
⎫
⎬
⎭
,where
(20)
A
n
(
r, k
)
=
⎧
⎪
⎪
⎪
⎨
⎪
⎪
⎪
⎩
−
N
0
(
r, k
)
D
0
(
r, k
)
, n
= 0,
−2
(
−1
)
n
N
n
(
r, k
)
D
n
(
r, k
)
, n
≥ 1,
N
n
(
r, k
)
= γ
k
J
n
γ
k
r
J
n
γ
k
r
−
γ
k
J
n
γ
k
r
J
n
γ
k
r
,
D
n
(
r, k
)
= γ
k
H
n
γ
k
r
J
n
γ
k
r
−
γ
k
H
n
γ
k
r
J
n
γ
k
r
.
(21)
The FIM (13) is based on the derivatives of H
θ
, which are
δH
θ
[
k
]
δR
=
−
j2γ
k
H
θ
[
k
]
;
δH
θ
[
k
]
δr
=
jγ
k
H
θ
[
k
]
+
2e
j(γ
k
r−π/4)
γ
k
δT
(
r + Δr, k
)
δr
e
jγ
k
3Δr
−
δT
(
r, k
)
δr
,
(22)
where the derivative of the sum term T(r, k)is
δT
(
r, k
)
δr
=
∞
n=0
A
n
(
r, k
)
,
A
n
(
r, k
)
=
⎧
⎪
⎪
⎪
⎪
⎪
⎪
⎪
⎪
⎪
⎨
⎪
⎪
⎪
⎪
⎪
⎪
⎪
⎪
⎪
⎩
−
N
0
(
r, k
)
D
0
(
r, k
)
− N
0
(
r, k
)
D
0
(
r, k
)
D
2
0
(
r, k
)
,
n
= 0,
−2
(
−1
)
n
N
n
(
r, k
)
D
n
(
r, k
)
− N
n
(
r, k
)
D
n
(
r, k
)
D
2
n
(
r, k
)
,
n
≥ 1,
N
n
(
r, k
)
= γ
2
k
J
n
γ
k
r
J
n
γ
k
r
−
γ
2
k
J
n
γ
k
r
J
n
γ
k
r
,
D
n
(
r, k
)
= γ
2
k
H
n
γ
k
r
J
n
γ
k
r
−
γ
2
k
H
n
γ
k
r
J
n
γ
k
r
.
(23)
Finally we have
δH
θ
[
k
]
δΔr
= lim
δr →0
H
[R,r,Δr+δr]
[
k
]
− H
[R,r,Δr]
[
k
]
δr
=
lim
δr →0
H
[R−Δr,r+Δr,δr]
[
k
]
δr
.
(24)
3.3. Numerical Evaluation of Lower Bounds. The objective
is to evaluate the influence of signal choice upon the FIM
(13) and particularly see if a general constraint on center
frequency ( f
c
) and bandwidth (B)emerges.However,in
order to evaluate the expression, a definition of the noise
process is needed and is assumed to be white:
K
n, f
[
k, k
]
= N
0
≈
Γ
0
Δt
. (25)
If not white, and contingent on knowledge of the process,
it may be whitened by a suitable transformation which
would necessarily imply a transformation of the signal s.The
present results would then apply to the transformed signal.
The second choice concerns the signal space to search. It
is apparent in (13) that only the energy in each frequency
bin has an influence on the FIM and is hence invariant to
any phase transformation of the signal. For simplicity, the
EURASIP Journal on Advances in Signal Processing 7
−120
−110
−100
−90
−80
−70
−60
−50
−40
−30
11.522.533.54 4.55
Frequency (GHz)
PSD (dB)
F
|H
θ
|
2
|H
simulated
|
2
Figure 2: The model H
θ
basedonplanarpropagationM
R
combined with the cylinder response C
r
compared with simulation
results. Using a flat factor of F
= 10, the two PSDs practically
overlap, although the model has deeper troughs and more lopsided
peaks. The figure is based on results in [22].
energy in each frequency bin over the bandwidth is assumed
constant,
|S[k]|
2
=
E
sd
2N
B
rect
k −k
c
N
B
+rect
k + k
c
N
B
,
E
sd
N−1
m=0
s
[
m
]
2
=
M
k=−M
|S
[
k
]
|
2
≈
E
s
Δt
,
(26)
where k
c
, k, N
B
are related to f
c
, f , B; their ratios are all
1/T.Asin(15), the FIM scales directly as a function of the
ratio E
s
/Γ
0
and we have E
s
/Γ
0
≈ E
sd
/N
0
.Wehavementioned
earlier that this implies that the CRLB may be calculated
for a constant ratio and then the value for any other ratio
simply scales the CRLB. Therefore, in what follows, this ratio
is assumed equal to unity. For clarity, whenever we refer to
the CRLB we will assume a ratio of unity, which will result in
expected standard deviation on the order of meters whereas
the radius is on the order of 10–20mm in our application.
The assumption is of course that in a practical situation
the ratio is sufficiently large for the CRLB to be meaningful
(order of 1 mm).
In summary, for each value of the CRLB, we are consid-
ering the class of signals with equal bandwidth and center
frequency and with a signal energy such that E
s
/Γ
0
= 1. T is
an independent parameter and, therefore, this approach does
not constrain the time-bandwidth product, for example,
compare a linearly frequency-modulated signal (chirp) to a
sinc, each with equal energy.
Finally, relevant ranges on the parameter space must
be set. With regards to ( f
c
, B),andastheFIMisstrongly
dependent on signal energy at the receiver, it is expected that
the CRLB for bands above 5GHz will be exceedingly high.
The calculations will be limited to the intervals
f
c
, B
∈
0.5, 5GHz ×0.1,3GHz.
(27)
With regards to R, from infants up to obese adults, it may
vary over very large ranges, and will also vary upon position
along the aorta for a given individual. Although the variation
is not as important, similar remarks apply to r.Withrespect
to Δr, an accurate study over several individuals sets the
peak-to-peak radius variations, for normal, adult individuals
to 1.09
± 0.22 mm [15]. In a typical measurement setup,
the radial variation between two measurements may be any
value although limited above by this peak. Relevant, arbitrary
ranges have been chosen as
(
R, r, Δr
)
∈ Θ =8, 15cm ×8, 15mm ×0.05, 1mm.
(28)
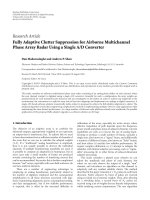
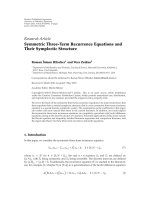
In Figures 3(a), 3(b),and3(c), the results of numerical
calculations are displayed. In order to visualize the structure,
the values have been truncated to appropriate levels. With
respect to Figure 3(c), the average is based on assuming that
every element in the parameter space Θ is equally likely.
However, with regard to Δr, this weighting reflects a less than
optimum approach as the performance can be improved if
small Δr are avoided. It may be possible in a real system
to avoid such small values if for each echo the reference is
chosen which produces the greatest difference.
4. Simulations
In order to verify the expressions and numerical calculations
of the lower bound, we have chosen to perform simulations.
In principle, verifying a lower bound requires proving that
no estimator performs better. If we had found one that did,
we would have proven it wrong. On the other hand, showing
that an estimator does not violate the lower bound does not
constitute a verification unless the estimator was efficient in
the statistical sense, or sufficiently close to it. ML estimators
are known to be asymptotically efficient, subject to certain
conditions, and may therefore qualify. Furthermore, due
to the quadric nature of the log-likelihood in the vicinity
of
θ
ML
, the Newton-Raphson gradient-based technique is
recommended in [25, Chapter 6].
However, the need to calculate the Stochastic Fisher
Information Matrix (SFIM), which requires evaluating a set
of integrals of functions expressed as infinite series, results in
a procedure that proved too slow using available resources.
Therefore, a grid-based procedure has been chosen. One
consequence is the fact that the grid-based procedure is not
efficient unless letting the grid-size tend to zero, which is
prohibitive. Therefore, the resulting estimations should not
expect to perfectly attain the CRLB, but the bias due to the
grid will be chosen sufficiently small to disregard this effect.
8 EURASIP Journal on Advances in Signal Processing
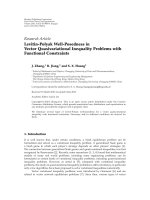
As illustrated schematically in Figure 4, the estimation of
θ
ML
need not find the closest grid point. It follows that the
grid may introduce an additional variance. For multivariate
normal (MVN) distributions or if one may assume a point
close enough to
θ
ML
, surfaces of equal log-likelihood may
be approximated by ellipsoids. If the axes of this ellipsoid is
skewed relative to the grid axes, then the point on the grid
with lowest log-likelihood may be farther than half a grid step
away. The log-likelihood (l(θ, x)),givenanobservation,may
be expanded in a Taylor series centered at
θ
ML
[25,Chapter
6],
l
(
θ, x
)
≈
l
θ
ML
, x
−
1
2
θ −
θ
ML
T
J
θ
ML
, x
θ −
θ
ML
,
(29)
where J(
θ
ML
, x) is the SFIM.
The problem inherent in Figure 4 may be avoided by
performing an eigenvalue analysis of the SFIM and orienting
the axes of the grid along the eigenvectors. Using the FIM
instead of the SFIM, this reasoning should still hold on the
average, and the expected error introduced by the grid will
be bounded by half the grid size in either direction,
By performing an eigenvalue analysis of the SFIM and
orienting the axes of the grid along the eigenvectors avoids
the problem inherent in Figure 4 by aligning the grid along
the ellipsoids. Using the FIM, developed for the CRLB,
instead of SFIM, this reasoning should still hold on the
average, and hence the error introduced by the grid will be
bounded by half the grid size in either direction,
J
θ
ML
=
E
v
Λ E
T
v
,
where Λ
= diag
λ
−2
1
, λ
−2
2
, λ
−2
3
,
θ −
θ
ML
T
J
θ
ML
θ −
θ
ML
=
y
T
Λy,
where y
= E
T
v
θ −
θ
ML
.
(30)
E
v
is the matrix with orthonormal eigenvectors arranged in
columns and Λ contains the eigenvalues along the diagonal.
Parameters are real quantities. This means that the error
in our estimate of the CRLB follows the classical error
introduced by quantization (q): VAR[q]
= Δ
2
/12. Further,
by choosing Δ as a fraction of λ
i
,forexample,Δ = λ
i
/k, the
relative error may be made insignificant,
λ
2
i
+
(
λ
i
/k
)
2
12
= λ
i
1+
1
12k
2
k=3
= 1.0046λ
i
, (31)
where λ
i
is the standard deviation along the eigenvector axis
i.
As for the numerical evaluations of the lower bound, we
will select an ideal bandpass signal. As the expressions scale
directly with E
sd
/N
0
, performing simulations for a single
value is sufficient,
E
sd
= 1.0W=
E
s
Δt
,
−
10
B
≤ t ≤
25
B
, s
(
t
)
=
2BE
s
sinc
(
tB
)
2πf
c
t,
S
f
=−
j
E
s
2B
rect
f − f
c
B
−
rect
f + f
c
B
,
Δt
=
20 f
c
−1
, m = 0, , N −1, s
[
m
]
= s
(
mΔt
)
.
(32)
The estimation of each parameter θ
0
∈ Θ is repeated
R
= 1000 times with independent instances of the noise
random process, which are generated as white, Gaussian
random processes,
{n
[
m
]
}∼N
0
,
K
n
, K
n
= N
0
I. (33)
The ratio E
sd
/N
0
is set such that ambiguities are not
expected because the expected estimation error becomes
much less than the distance between θ
0
and the nearest
ambiguity,
E
sd
N
0
= Max
⎧
⎨
⎩
CRLB
R
(
0.2mm
)
2
,
CRLB
(
r
)
(
0.1mm
)
2
,
CRLB
Δr
(
0.01 mm
)
2
⎫
⎬
⎭
.
(34)
This choice assures that the estimation error is above
the threshold level in the Ziv-Zakai lower bound. A grid
offset from the actual parameter value θ
0
= (R
0
, r
0
, Δr
0
)is
selected with step size λ
i
/3, extending 4λ
i
in each eigenvector
direction,
θ
0
= θ
0
+ δθ
0
, δθ
0
∼ Uniform
0
,
diag
σ
R
12
,
σ
r
12
,
σ
Δr
12
,
y
i
∈{−12, ,12}·
λ
i
3
+ e
T
vi
θ
0
,
θ
∈
E
v
y
.
(35)
Simulation results for various selections of parameters
are displayed in Figures 5(a), 5(b), 5(c), 5(d),and5(e).
In Figure 5(a), the CRLB is shown as a function of center
frequency; in Figure 5(b), it is displayed as a function of
bandwidth, while in Figures 5(c), 5(d),and5(e) the CRLB
is illustrated as functions of R, r,andΔr,respectively.
4.1. Threshold Effect. In the above simulations, the objective
was to verify the expressions and numerical calculations of
the CRLB. In doing so, the necessity of a sufficient E
sd
/N
0
ratio was emphasized in order to avoid ambiguities, which
are not accounted for by the CRLB. In this simulation series,
the objective is to illustrate through simulation the point at
which the threshold effect becomes visible by successively
EURASIP Journal on Advances in Signal Processing 9
0.5
1
1.5
2
2.5
3
3.5
4
4.5
5
00.511.522.53
2
4
6
8
10
12
14
16
18
20
B (GHz)
f
c
(GHz)
(a) Minimum CRLB
0.5
1
1.5
2
2.5
3
3.5
4
4.5
5
00.511.522.53
100
200
300
400
500
600
700
800
900
1000
B (GHz)
f
c
(GHz)
(b) Maximum CRLB
0.5
1
1.5
2
2.5
3
3.5
4
4.5
5
00.511.522.53
100
200
300
400
500
600
700
800
900
1000
B (GHz)
f
c
(GHz)
(c) Average CRLB
Figure 3: CRLB for r over Θ as a function of ( f
c
, B).
ˆ
θ
ML
N
θ
0
ˆ
θ
Large second derivative values
Small second derivative values
Figure 4: Illustrate properties of the grid-based approach to
θ
ML
.Here,θ
0
is the actual parameter value,
θ
ML
is the true minima due to noise
N ,and
θ is the minima on the grid and hence the ML estimate based on the grid-based approach. The figure does not use a rotated grid to
adjust to the principle axes of the FIM schematically represented by the dashed-line axes in the figure.
reducing the E
sd
/N
0
ratio while all other parameters are kept
constant,
θ
=
(
13 cm, 10mm, 0.6mm
)
∧
f
c
, B
=
(
1.0 GHz, 1.0GHz
)
,
E
sd
N
0
∈{64.8, 69.8, 74.8, 79.8,82.8, 86.8, 89.8,
92.8, 94.8, 96.8
}dB.
(36)
The CRLB in terms of standard deviation for this choice
of θ is σ
r
= 7.04 m at E
sd
/N
0
= 0 dB; the observed
standard deviations are appropriately scaled
σ
r
·
E
sd
/N
0
and
compared with the CRLB. The threshold may be defined
where the variance becomes larger than the CRLB by a factor
of 2,
σ
r
·
E
sd
N
0
threshold
=
√
2σ
r
= 9.96 m. (37)
10 EURASIP Journal on Advances in Signal Processing
The results of the simulations are illustrated in Figure 5(f),
which suggest a threshold around E
sd
/N
0
≈ 75 dB, which is
equivalent to a CRLB of σ
r
≈ 1.25 mm.
5. Discussion
In the previous sections, we have argued for the use of
the CRLB in order to describe the performance of radius
estimation as a function of the channel parameters. The
CRLB for a general transfer function has been derived. We
further elaborated a channel model dependent on three
parameters: a cylinder of radius r of lossy material is
immersed in a lossy material separated from the antenna in
a monostatic radar configuration by a distance R. The third
parameter is the difference in radius Δr between two echoes.
In order to verify the CRLBs, simulations have been
performed using an estimator which comes sufficiently close
to the actual ML estimate value compared with the expected
standard deviation of the ML estimate according to the CRLB
value. This estimator uses a grid-based approach, oriented
according to the eigenvector directions of the FIM in order
to improve the performance. The results of these simulations
are shown in Figures 5(a) through 5(f). In Figures 5(a) and
5(b), the dependency on system parameters f
c
and B is
shown. In Figures 5(c), 5(d),and5(e) the dependency on
model parameters R, r,andΔr is shown, while in Figure 5(f)
the threshold effect, where the CRLB is no longer precise, is
illustrated.
Given that the results of simulations are realizations of
a stochastic variable, confidence intervals have been added
to quantify their variations. These confidence intervals are
based on the assumption that the distribution of
θ
ML
may
be modeled as a normally distributed random variable.
This assumption would naturally be violated if the variance
was too large compared with the second derivative of the
norm
X − Z
θ
2
as a function of θ close to θ
ML
. Then the
distribution of the estimate of the standard deviation of
θ(σ
θ
)
is a χ-distribution,
R − 1
σ
2
θ
σ
θ
=
R
i=1
⎛
⎝
θ
i
− μ
θ
σ
θ
⎞
⎠
2
∼ χ
R−1
. (38)
Using the distribution of the estimate of σ
θ
, 99% confidence
intervals can be calculated and are shown in Figures 5(a)
through 5(f).
Comparing estimated variance based on simulations to
the numerically calculated CRLBs shows that the general
dependencies on different parameters correspond very well;
all simulation points have a confidence interval that contains
the numerically calculated CRLB.
5.1. Interpretations of the CRLB’s Dependency on f
c
and B.
In Figures 3(a), 3(b),and3(c), a region of low variance is
limited at both low and high center frequencies as well as by
the impossible region where the bandwidth is twice or more
the center frequency. This low-variance region is also limited
at low bandwidths, except when considering the minimum
attainable CRLB; at high bandwidths, the variance tends to
increase more slowly. In sum, there is a region that seems
optimal, and which could loosely be defined by the inequality
f
c
− 1GHz
0.25 GHz
2
+
B −1.25 GHz
0.5GHz
2
≤ 1.
(39)
It is true that the minima over the parameter space
Θ does not restrict the use of very narrowband signals,
to the contrary, there are values of ( f
c
, B) which perform
verywell.However,forsuchprocessingtobeefficient, it
would be necessary to adapt the choice of ( f
c
, B) to the
actual, unknown parameters. Furthermore, the above region
appears to perform even better.
As mentioned earlier, the FIM is largest where the average
value of the integrand is maximum. This may be used to
explain the boundaries of the above region. At low frequency
the phase difference between the two radar echoes in the
difference (small Δr) is small and results in significant
attenuation. At high frequency the tissues are increasingly
lossy and the signal is strongly attenuated resulting in higher
variance. The fact that the bound for high frequency seems
to increase with higher bandwidth simply means that with
higher bandwidth a significant lower bandwidth content is
included even for higher center frequency.
For low bandwidth, it is clear that beyond some point, the
information concerning the radius r of the aorta contained
in reflections from the front and rear walls diminishes to the
point where only the amplitude of a sinusoid is modulated by
the combination of reflections. However, this modulation is
coupled with the attenuation due to unknown R.Moreover,
the channel model in (13) exhibits both notches and peaks
due to the resonant behavior of the cylinder, and their
locations are hence dependent on r. In the best case, the
narrow window is centered on a peak. In the worst case, it
is centered on a notch which explains the behavior of the
worst-case scenario as shown in Figure 3(b) and influences
the behavior in Figure 3(c).
Finally, for increasing bandwidth, a greater portion of the
spectrum is averaged. When the bandwidth is greater than
the effective bandwidth of the radar echo, this average value
decreases, hence, increasing estimation variance.
5.2. Implications on E
s
/Γ
0
for Aorta Radius Estimation. Once
( f
c
, B) has been chosen and a CRLB at E
s
/Γ
0
= 1hasbeen
identified, a required minimum value on E
s
/Γ
0
is necessary
in order to obtain a given accuracy on radius estimation. The
first question concerns a relevant value for CRLB.
The values in Figures 3(a), 3(b),and3(c) all are based on
the entire set Θ, however, it is clear that low values of Δr have
significant impact on received energy and will hence tend
to reduce estimation quality. Thus, if measurements may be
appropriately arranged to avoid small values of Δr, then the
expected worst-case scenario may improve considerably. On
the other hand, R has been limited to 15cm in Θ,yeta
larger upper limit could be justified. The larger this value,
the larger the attenuation in the average material and the
less measurements will be precise. In conclusion, the actual
parameter range that must be taken into consideration will
influence the choice of E
s
/Γ
0
. Conversely, given an upper
EURASIP Journal on Advances in Signal Processing 11
0
10
20
30
40
50
0.511.522.53
f
c
(GHz)
σ (m)
CRLB(
ˆ
r)
σ
ˆ
r
√
SNR
(a) Variablecenterfrequeny f
c
0
5
10
15
20
00.511.522.53
B (GHz)
σ (m)
CRLB(
ˆ
r)
σ
ˆ
r
E
s
/Γ
0
(b) Variable bandwidth B ( f
c
= 1.5GHz)
0
2
4
6
8
10
12
14
80 90 100 110 120 130 140 150 160
R (mm)
σ (m)
CRLB(
ˆ
r)
σ
ˆ
r
E
s
/Γ
0
(c) Variable distance R
0
1
2
3
4
5
6
7
8
8 9 10 11 12 13 14 15
r (mm)
σ (m)
CRLB(
ˆ
r)
σ
ˆ
r
E
s
/Γ
0
(d) Variable radius r
0
20
40
60
80
100
00.20.40.60.81
Δr (mm)
σ (m)
CRLB(
ˆ
r)
σ
ˆ
r
E
s
/Γ
0
(e) Variable radius difference Δr
0
2
4
6
8
10
12
14
16
65 70 75 80 85 90 95 100
E
sd
/N
0
(mm)
σ (m)
CRLB(
ˆ
r)
σ
ˆ
r
E
s
/Γ
0
(f) Variable E
sd
/N
0
ratio
Figure 5: CRLB for r as a function of a single parameter; default values are R = 13 cm, r = 10mm, dr = 0.6mm, f
c
= 1.0GHz, and
B
= 1.0GHz.
12 EURASIP Journal on Advances in Signal Processing
bound on E
s
/Γ
0
, a subset of individuals’ aorta diameter
variations may be measured reliably. With respect to our
specific choice for Θ and taking the worst-case scenario into
consideration, a practical value of CRLB (E
s
/Γ
0
= 1) = 100 m
may be assumed as a reference.
The required precision depends on the blood-pressure
estimation strategy. Let σ
r
≤ 0.1 mm be assumed adequate
and representative. This results in the following requirement
on E
s
/Γ
0
:
E
s
Γ
0
≥
CRLB|
E
s
/Γ
0
=1
σ
r
2
=
100 m
0.1mm
2
= 10
12
.
(40)
The noise spectral density Γ
0
is bounded below by the
thermal noise at the receiver input, Γ
0
≥ k
b
T
abs
,wherek
b
is Boltzmann’s constant and T
abs
is absolute temperature.
To quantify the energy E
s
of the signal, it is necessary to
determine the time available for a single observation (T).
Whether the signal is pulsed during this period or emits
continuously is of no consequence with respect to (13)
and (14). Therefore, assume an average power is emitted
during T : P
s
= E
s
/T. The final objective in our project
is to estimate blood pressure, which is based on recreating
the profile of the Aortic diameter variations, which have
a period equal to the heart-beat of an individual. This
heart-beat is bounded above by approximately 220 min
−1
=
3.7 Hz. Sampling it with frequency 100 Hz, the resulting
representation contains 13 harmonics. This implies T
=
10 ms for a single measurement. For T
abs
= 300K and B =
1 GHz,
E
s
Γ
0
=
P
s
T
Γ
0
=
PSD
s
TB
k
b
T
abs
≥ 10
12
,
P
s
≥
k
b
T
abs
10
12
T
= 0.41 μW,
PSD
s
≥
P
s
B
=
k
b
T
abs
10
12
TB
= 4.14 · 10
−16
W/Hz
=−63.8dBm/MHz,
(41)
where the power spectral density (PSD
s
) is scaled for a one-
sided spectrum in order to correspond to the thermal noise
expression. As a measure of comparison, the FCC has set the
general level within the UWB mask to
−41.3dBm/MHz [26,
Subpart F].
Note that the channel model does not consider the loss
in the air-skin reflection and disregards the 1/R
2
loss due
to cylindrical propagation, we have assumed a perfectly 2D
structure, which will add to the above requirement. The air-
skin reflection loss is on the order of a flat factor 6.4dB,
while the 1/R
2
loss factor was indicated, for R ≈ 10 cm,
to be on the order of 10 dB. Finally, although subtracting
two returns will null all static responses, the indirect paths
from the aorta will not be suppressed, nevertheless clutter is
not considered in the above model. Hence, the above values
represent optimistic estimations.
6. Conclusion
This article focuses on identifying an optimal signal choice
for the estimation of the diameter of a lossy cylinder
with slowly-varying radius, in a lossy environment, which
has been simplified to that of determining optimal center
frequency and bandwidth based on an ideal bandpass filter.
The electromagnetic material characteristics are based on
tissues as described by C. Gabriel and S. Gabriel [23], and
the heterogeneous tissue environment surrounding the aorta
has been replaced by a single, average tissue.
By using the Cram
´
er-Rao lower bound (CRLB) as an
indicator of estimator performance, it has been shown
that both at high and low center frequencies the estimator
will perform poorly due to lossy propagation in tissue at
high frequencies and the subtraction of signals with small
phase shifts at low frequencies. Also at low bandwidths,
the estimator will perform less than optimal due to low
information content and lack of robustness with respect
to parameter values. At high bandwidths, the estimator
performs poorly due to indiscriminate filtering. Given our
choice of channel model, the optimal selection may be
loosely described as an ellipse centered at 1 GHz center
frequency and 1.25 GHz bandwidth with axes of 0.5 GHz and
1 GHz, respectively.
By considering the necessary signal energy to noise
spectral density ratio (E
s
/N
0
) to achieve a radius estimation
precision of 0.1 mm, it was found that this ratio should
exceed 10
12
, when considering the worst case over a range
of parameter values. Requiring a measurement every 10 ms,
this was found to be equivalent to a mean effect of
0.4 μW, or equivalently a power spectral density superior to
−63 dBm/MHz, for a bandwidth of 1 GHz. These figures do
not consider the air-skin interface.
As a future work, we plan to construct a phantom
model in which the different parameters are studied in
a controlled manner and which may allow for verifying
theoretical behavior. Furthermore, using the phantom, the
relationship between pressure estimation of pulsatile flow in
an elastic tube and diameter as a function of time can be
studied in practice.
Acknowledgments
The voxel model of the human body has been provided by
the VOXEL-MAN Group at the University Medical Center
Hamburg-Eppendorf, Germany [23]. These data are in turn
based on the data set provided by the National Library
of Medicine (USA) through the Visual Human Project.
The electromagnetic propagation solver, OPEN-TEMSI-FD,
has been provided by the Xlim Laboratory, University of
Limoges, France [27]. This work is part of the MELODY
project, which is funded by the Research Council of Norway
under the Contract no. 187857/S10.
EURASIP Journal on Advances in Signal Processing 13
References
[1] G. Parati, G. Ongaro, G. Bilo et al., “Non-invasive beat-to-
beat blood pressure monitoring: new developments,” Blood
Pressure Monitoring, vol. 8, no. 1, pp. 31–36, 2003.
[2] K. Matthys and P. Verdonck, “Development and modelling
of arterial applanation tonometry: a review,” Technology and
Health Care, vol. 10, no. 1, pp. 65–76, 2002.
[3] J. Y. A. Foo and S. L. Chu, “Pulse transit time as an indirect
marker for variations in cardiovascular related reactivity,”
Technology and Health Care, vol. 14, no. 2, pp. 97–108, 2006.
[4] G. Sharwood-Smith, J. Bruce, and G. Drummond, “Assess-
ment of pulse transit time to indicate cardiovascular changes
during obstetric spinal anaesthesia,” British Journal of Anaes-
thesia, vol. 96, no. 1, pp. 100–105, 2006.
[5] A. D. Droitcour, Non-contact measurements of heart and
respiration rates with a single-chip microwave doppler radar,
Ph.D. dissertation, Department of Electrical Engineering,
Stanford University, June 2006.
[6] T. W. McEwan, “Body monitoring and imaging apparatus and
method,” patent, August 1994.
[7] C. Fowler, J. Entzminger, and J. Corum, “Assessment of ultra-
wideband (UWB) technology,” IEEE Aerospace and Electronic
Systems Magazine, vol. 5, no. 11, pp. 45–49, 1990.
[8] I. Immoreev, “Ultra-wideband radars. Features and ways
of development,” in Proceedings of the 2nd European Radar
Conference (EURAD ’05), pp. 113–116, October 2005.
[9] X. Li, E. J. Bond, B. D. Van Veen, and S. C. Hagness, “An
overview of ultra-wideband microwave imaging via space-
time beamforming for early-stage breast-cancer detection,”
IEEE Antennas and Propagation Magazine,vol.47,no.1,pp.
19–34, 2005.
[10] D. J. Kurrant, E. C. Fear, and D. T. Westwick, “Tumor response
estimation in radar-based microwave breast cancer detection,”
IEEE Transactions on Biomedical Engineering, vol. 55, no. 12,
pp. 2801–2811, 2008.
[11] L. Anitori, A. de Jong, and F. Nennie, “FMCW radar for life-
sign detection,” in IEEE Radar Conference (RADAR ’09),pp.
1–6, May 2009.
[12] M. Sugawara, K. Niki, H. Furuhata, S. Ohnishi, and S.
Suzuki, “Relationship between the pressure and diameter of
the carotid artery in humans,” Heart and Vessels, vol. 15, no. 1,
pp. 49–51, 2000.
[13] J. Lass, K. Meigas, D. Karai, R. Kattai, J. Kaik, and M.
Rossmann, “Continuous blood pressure monitoring during
exercise using pulse wave transit time measurement,” in
Proceedings of the 26th Annual International Conference of the
IEEE Engineering in Medicine and Biology Society (EMBC ’04),
vol. 1, pp. 2239–2242, September 2004.
[14] R. G. Gosling and M. M. Budge, “Terminology for describing
the elastic behavior of arteries,” Hypertension,vol.41,no.6,
pp. 1180–1182, 2003.
[15] C. Stefanadis, C. Stratos, C. Vlachopoulos et al., “Pressure-
diameter relation of the human aorta: a new method of
determination by the application of a special ultrasonic
dimension catheter,” Circulation, vol. 92, no. 8, pp. 2210–2219,
1995.
[16] B. M. Sadler and R. J. Kozick, “A survey of time delay esti-
mation performance bounds,” in Proceedings of the 4th IEEE
Sensor Array and Multichannel Signal Processing Workshop
Proceedings (SAM ’06), pp. 282–288, July 2006.
[17] J. P. Ianniello, E. Weinstein, and A. Weiss, “Comparison of
the Ziv-Zakai lower bound on time delay estimation with
correlator performance,” in Proceedings of IEEE Internat ional
Conference on Acoustics, Speech and Signal Processing (ICASSP
’83), pp. 875–878, April 1983.
[18] P. M. Woodward, Probability and Information Theory, with
Applications to Radar, Artech House Books, Boston, Mass,
USA, 1980.
[19] H. L. Van Trees, Detection, Estimation and Modulation Theory,
Part I, John Wiley & Sons, New York, NY, USA, 1968.
[20] A.Pommert,K.H.H
¨
ohne, B. Pflesser et al., “Creating a high-
resolution spatial/symbolic model of the inner organs based
on the visible human,” Medical Image Analysis
, vol. 5, no. 3,
pp. 221–228, 2001.
[21] National Library of Medicine (NLM), “Visual human project,”
1994, />[22] L. E. Solberg, I. Balasingham, S E. Hamran, and E. Fosse,
“A feasibility study on aortic pressure estimation using
UWB radar,” in Proceedings of IEEE International Conference
on Ultra-Wideband (ICUWB ’09), pp. 464–468, Vancouver,
Canada, September 2009.
[23] C. Gabriel and S. Gabriel, “Compilation of the dielectric
properties of body tissues at RF and microwave frequencies,”
Tech. Rep., Physics Department, King’s College, London, UK,
June 1996.
[24] G.T.Ruck,D.E.Barrick,W.D.Stuart,andC.K.Krichbaum,
Radar Cross Section Handbook, vol. 1, Columbus Laboratories,
Battelle Memorial Institute, Plenium Press, Columbus, Ohio,
USA, 1970.
[25] L. L. Scharf, Statistical Signal Processing: Detection, Estimation
and Time Series Analysis, Addison-Wesley, Reading, Mass,
USA, 1991.
[26] FCC, “Title 47 of the code of federal regulations, part 15:
Radio frequency devices,” February 2002, http://www
.access.gpo.gov/nara/cfr/waisidx
02/47cfr15 02.html.
[27] C. Guiffaut, “OPEN-TEMSI-FD: Time Electromagnetic
Simulator—Finite Diference,” Licence CECILL-C, Laboratory
XLIM, University of Limoges, UMR CNRS 6172,
/>