Báo cáo sinh học: " Research Article Estimation of Sound Source Number and Directions under a Multisource Reverberant Environment" doc
Bạn đang xem bản rút gọn của tài liệu. Xem và tải ngay bản đầy đủ của tài liệu tại đây (1.88 MB, 14 trang )
Hindawi Publishing Corporation
EURASIP Journal on Advances in Signal Processing
Volume 2010, Article ID 870756, 14 pages
doi:10.1155/2010/870756
Research Article
Estimation of Sound Source Number and Directions under
a Multisource Reverberant Environment
Jwu-Sheng Hu and Chia-Hsin Yang
Department of Electrical and Control Engineering, National Chiao-Tung University, Lab 905, Engineering Building No. 5,
1001 Ta Hsueh Road, Hsinchu 300, Taiwan
Correspondence should be addressed to Chia-Hsin Yang,
Received 3 December 2009; Revised 4 April 2010; Accepted 27 May 2010
Academic Editor: Sven Nordholm
Copyright © 2010 J S. Hu and C H. Yang. This is an open access article distributed under the Creative Commons Attribution
License, which permits unrestricted use, distribution, and reproduction in any medium, provided the original work is properly
cited.
Sound source localization is an important feature in robot audition. This work proposes a sound source number and directions
estimation method under a multisource reverberant environment. An eigenstructure-based generalized cross-correlation method
is proposed to estimate time delay among microphones. A source is considered as a candidate if the corresponding time delay
combination among microphones gives reasonable sound speed estimation. Under reverberation, some candidates might be
spurious but their direction estimations are not consistent for consecutive data frames. Therefore, an adaptive K-means++
algorithm is proposed to cluster the accumulated results from the sound speed selection mechanism. Experimental results
demonstrate the performance of the proposed algorithm in a real room.
1. Introduction
Sound source localization is one of the fundamental features
of robot audition for human-robot interaction as well
as recognition of the environment. The idea of using
multiple microphones to localize sound sources has been
developed for a long time. Among various kinds of sound
localization methods, generalized cross correlation (GCC)
[1–3] was used for robotic applications [4] but it is not
robust under multiple sources environment. Improvements
on the performance in the multiple sources and reverberant
environment have also been discussed [5, 6]. Another
approach, proposed by Balan and Rosca [7], explores the
eigenstructure of the correlation matrix of the microphone
array by separating speech signals and noise signals into
two orthogonal subspaces. The direction-of-arrival (DOA)
is then estimated by projecting the manifold vectors onto
the noise subspace. MUSIC [8, 9] combined with spatial
smoothing [10] is one of the most popular methods for
eliminating the coherence problem and it is also applied to
the robot audition [11].
Based on the geometrical relationship among time delay
values, Walworth and Mahajan [12] proposed a linear equa-
tion formulation for the estimation of the three-dimensional
(3D) position of a wave source. Later, Valin et al. [13]gave
a simple solution for the linear equation in [12]basedon
the far-field assumption and developed a novel weighting
function method to estimate the time delay. In a real
environment, the sound source may move. Valin et al. [14]
proposed a localization and tracking of simultaneous moving
sound sources method using eight microphones and this
method is based on a frequency domain implementation
of a steered beamformer along with a particle filter-based
tracking algorithm. In addition, Badali et al. [15]investigated
the accuracy of different time delay of arrival estimation
audio localization implementations in the context of artificial
audition for robotic systems.
Ya o e t a l. [16] presented an efficient blind beamformer
technique to estimate the time delays from the dominant
source. This method estimated the relative time delay from
the dominant eigenvector computed from the time-averaged
sample correlation matrix. They have also formulated
2 EURASIP Journal on Advances in Signal Processing
a source linear equation similar with [12] to estimate
the source location and velocity via least square method.
Statistical methods [17–19] have also been proposed to
solve the DOA problem under complex environment. These
methods yield superior performance than conventional DOA
method especially when the sound source is not within line-
of-sight. However, a training procedure is needed for these
methods to obtain the pattern of sound wave arrival. This
may not be realistic for the robot applications when the
environment is unknown.
The methods above assume that the sound source
number is known. But this may not be a realistic assumption
because the environment usually contains various kinds of
sound sources. Several eigenvalue-based methods have been
proposed [20, 21] to estimate the sound source number.
However, the eigenvalue distribution is sensitive to noise and
reverberation. The work in [22] used the support vector
machine (SVM) to classify the distribution with respect to
the sound source number. However, it still requires a training
stage for a robust result and the binary classification is
inadequate when the sound source number is larger than
two.
The objective of this work is to estimate the multiple
fixed sound source directions without a priori information
of the sound source number and the environment. This
work utilizes the time delay information and microphone
array geometry to estimate the sound source directions [23].
A novel eigenstructure-based GCC (ES-GCC) method to
estimate the time delay under a multi-source environment
between two microphones is proposed. The theoretical proof
of the ES-GCC method is given, and the experimental
results show that it is robust in a noisy environment. As
a result, the sound source direction and velocity can be
obtained by solving the proposed linear equation model
using the time delay information. Fundamentally, the sound
source number should be known while estimating the sound
source directions. Hence, the method which can estimate
sound source number and directions simultaneously using
the proposed adaptive K-means++ is introduced and all
the experiments are conducted in a real environment. This
paper is organized as follows. In Section 2, we introduce
the novel ES-GCC method for time delay estimation. With
the time delay estimation, the sound source direction and
speed estimation method is presented in Section 3,where
the estimation error is also analyzed. In Section 4,we
propose the sound speed selection mechanism and adaptive
K-means++ algorithm. Experimental results, presented in
Section 5, demonstrate the performance of the proposed
algorithm in a real environment. Section 6 concludes the
paper.
2. Time Delay Estimation
Consider an array with M microphones in a noisy envi-
ronment. The received signal of the mth microphone which
contains D sources can be described as:
x
m
(
t
)
=
D
d=1
a
md
(
t
)
⊗s
d
(
t
)
+ n
m
(
t
)
,(1)
where a
md
(t) is the transfer function from the dth sound
source to the mth microphone assumed to be time-invariant
over the observation period and
⊗ represents the convolu-
tion operation. s
d
(t)andn
m
(t) are the dth sound source
and the nondirectional noise, respectively. It is assumed that
s
d
(t)andn
m
(t) are mutually uncorrelated and sound source
signals are mutually independent. Applying the short-time
Fourier transform (STFT) to (1), we have
X
m
(
ω, k
)
=
D
d=1
A
md
(
ω
)
S
d
(
ω, k
)
+ N
m
(
ω, k
)
,
ω
= 0, 1, , N
STFT
−1,
(2)
where ω is the frequency band, k is the frame number, and
N
STFT
is the STFT point. A
md
(ω), X
m
(ω, k), S
d
(ω, k), and
N
m
(ω, k) are the STFT of the respective signals. Rewrite (2)
in matrix form:
X
(
ω, k
)
= A
(
ω
)
S
(
ω, k
)
+ N
(
ω, k
)
,(3)
where
X
(
ω, k
)
=
X
1
(ω, k), , X
M
(
ω, k
)
T
∈ C
M×1
,
N
(
ω, k
)
=
N
1
(ω, k), , N
M
(ω, k)
T
∈ C
M×1
,
S
(
ω, k
)
=
S
1
(ω, k), , S
D
(ω, k)
T
∈ C
D×1
,
A
(
ω
)
=
⎡
⎢
⎢
⎣
A
11
(
ω
)
··· A
1D
(
ω
)
.
.
.
.
.
.
A
M1
(
ω
)
··· A
MD
(
ω
)
⎤
⎥
⎥
⎦
∈
C
M×D
.
(4)
Suppose the noises are spatially white, and the noise correla-
tion matrix is diagonal matrix σ
2
n
I. Therefore, the received
signal correlation matrix using K frames with eigenvalue
decomposition (EVD) can be described as
R
xx
(
ω
)
=
1
K
K
k=1
X
(
ω, k
)
X
H
(
ω, k
)
= A
(
ω
)
R
ss
(
ω
)
A
H
(
ω
)
+ σ
2
n
I
=
M
i=1
λ
i
(
ω
)
V
i
(
ω
)
V
H
i
(
ω
)
,
(5)
where H denotes conjugation transpose; R
ss
(ω) = (1/K)
K
k
=1
S(ω, k)S
H
(ω, k); λ
i
(ω)andV
i
(ω)areeigenvaluesand
corresponding eigenvectors with λ
1
(ω) ≥ λ
2
(ω) ≥ ··· ≥
λ
M
(ω). The signal-only correlation matrix A(ω)R
ss
(ω)A
H
(ω)
can be expressed as (6) using the property σ
2
n
I =
M
m=1
σ
2
n
V
m
(ω)V
H
m
(ω) (the proof of this property is given in
the appendix):
A
s
(
ω
)
R
ss
(
ω
)
A
H
s
(
ω
)
=
M
m=1
λ
m
(
ω
)
−σ
2
n
V
m
(
ω
)
V
H
m
(
ω
)
. (6)
The eigenvalues and eigenvectors are divided into two
groups. The first group, consisting of D eigenvectors (V
1
(ω)
EURASIP Journal on Advances in Signal Processing 3
to V
D
(ω)) is referred to as signal eigenvectors and spans the
signal subspace. The second group, consisting of M-D eigen-
vectors (V
D+1
(ω)toV
M
(ω)) is referred to as noise eigenvec-
tors and spans the noise subspace. The MUSIC algorithm
[8, 9] uses the orthogonal property of the signal and noise
subspaces to estimate the signal directions and it mainly uses
the eigenvectors that lie in the noise subspace. Rather than
using the noise subspace information, this paper considers
the eigenvectors that lie in the signal subspace for time delay
estimation (TDE) to minimize the influence of noise. The
idea that employs the eigenvectors in the signal subspace
can also be referred as the Blackman-Tukey frequency
estimation method [24]. In the signal eigenvectors, V
1
(ω)is
the eigenvector associated with the maximum eigenvalue:
V
1
(
ω
)
=
V
11
(
ω
)
V
21
(
ω
)
··· V
M1
(
ω
)
T
∈ C
M×1
. (7)
This paper chooses the eigenvector V
1
(ω)forTDEbecause
it lies in the signal subspace and it contributes most to
construct the signal-only correlation matrix. We call the
eigenvector V
1
(ω) first principal component vector since it
contains the information of the speech sound sources and
is robust to the noise. It is different from the conventional
GCC methods where a number of weighting functions are
adjusted for different applications. In essence, this paper
replaces the microphone-received signal X(ω, k)withV
1
(ω)
for TDE since V
1
(ω) can be considered as the approximation
of A(ω)S(ω, k). A detailed explanation is given in the
appendix. Hence, the ES-GCC function between the ith and
jth microphone can be represented as
R
x
i
x
j
(
τ
)
=
N
STFT
−1
ω=0
1
V
i1
(
ω
)
V
j1
(
ω
)
V
i1
(
ω
)
V
j1
(
ω
)
e
jωτ
. (8)
The weighting function in (8) follows the idea of GCC-PHAT
[2] and the reason is that studies [3, 25] showed it is more
immune to reverberation time than other cross-correlation-
based methods but sensitive to noise. By replacing the
original signals with the principal component vectors, the
robustness to noise can be enhanced. As a result, the time
delay sample can be estimated by finding the maximum peak
of the ES-GCC function as
τ
1
x
i
x
j
= arg max
τ
R
x
i
x
j
(
τ
)
. (9)
3. Sound Source Localization and
Speed Estimation
3.1. Sound Source Locat ion Estimation Using Least-Square
Method. The sound source location can be estimated from
geometrical calculation of the time delays among the
microphone array elements. The work in [16]providesa
linear equation model for estimating the source localization
and propagation speed. The following derivations explain
the idea. Consider sound source location vector r
s
=
[x
s
y
s
z
s
], the ith microphone location r
i
= [x
i
y
i
z
i
],
and the relative time delays, t
i
− t
1
, between the ith
microphone and the first microphone. The relative time
delay satisfies
t
i
−t
1
=
|
r
i
−r
s
|−|r
1
−r
s
|
v
, (10)
where t
i
is the time delay from the sound source to the ith
microphone and v is the speed of sound. Equation (10)is
equivalent to
t
i
−t
1
+
|r
s
−r
1
|
v
=
|
(
r
i
−r
1
)
−
(
r
s
−r
1
)
|
v
. (11)
Squaring both sides, we have
(
t
i
−t
1
)
2
+2
(
t
i
−t
1
)
|r
s
−r
1
|
v
=
|
r
i
−r
1
|
v
2
−
2
(
r
i
−r
1
)
·
(
r
s
−r
1
)
v
2
.
(12)
By some algebraic manipulations, (12)becomes
−
(
r
i
−r
1
)
·
(
r
s
−r
1
)
v|r
s
−r
1
|
+
|r
i
−r
1
|
2
2v|r
s
−r
1
|
−
v
(
t
i
−t
1
)
2
2|r
s
−r
1
|
=
(
t
i
−t
1
)
.
(13)
Next, define the normalized sound source position vector as,
w
s
≡
[
w
1
w
2
w
3
]
T
=
r
s
−r
1
v|r
s
−r
1
|
. (14)
And define two other variables as
w
4
=
1
2v|r
s
−r
1
|
, w
5
=
v
2|r
s
−r
1
|
. (15)
The linear equation (13) considering all M microphones can
be written as
A
g
w = b, (16)
where w
= [w
T
s
w
4
w
5
]
T
= [w
1
w
2
w
3
w
4
w
5
]
T
,
A
g
=
⎡
⎢
⎢
⎢
⎢
⎢
⎢
⎣
−
(
r
2
−r
1
)
|r
2
−r
1
|
2
−
(
t
2
−t
1
)
2
−
(
r
3
−r
1
)
|r
3
−r
1
|
2
−
(
t
3
−t
1
)
2
.
.
.
.
.
.
.
.
.
−
(
r
M
−r
1
)
|r
M
−r
1
|
2
−
(
t
M
−t
1
)
2
⎤
⎥
⎥
⎥
⎥
⎥
⎥
⎦
,
b
=
⎡
⎢
⎢
⎢
⎢
⎢
⎣
t
2
−t
1
t
3
−t
1
.
.
.
t
M
−t
1
⎤
⎥
⎥
⎥
⎥
⎥
⎦
.
(17)
For more than five sensors, the least square solution of
equation is given by
w =
w
T
s
w
4
w
5
T
=
w
1
w
2
w
3
w
4
w
5
T
=
A
T
g
A
g
−1
A
T
g
b.
(18)
4 EURASIP Journal on Advances in Signal Processing
The estimated sound source location and speed of sound can
be obtained as
r
s
=
w
s
2 w
4
+ r
1
, v =
w
5
w
4
or v =
1
w
s
. (19)
3.2. Sound Source Direction Estimation Using Least-Square
Method for Far-Field Case. To s o l v e ( 16), the matrix A
g
must
be full rank. However, for matrix A
g
, the condition on rank
is more complicated and can be ill-conditioned easily. For
example, if the microphones are distributed on a spherical
surface (i.e., r
i
= [R
m
cos θ
i
sin φ
i
R
m
sin θ
i
sin φ
i
R
m
cos φ
i
],
R
m
is radius, and θ
i
and φ
i
are azimuth and elevation angle
resp.), it can be verified that the fourth column in A
g
is
the linear combination of column 1, 2, and 3. Secondly, if
the aperture of the array is small compared with the source
distance (far-field), the distance estimation is also sensitive to
noise. In the following, a detailed analysis of (13)ispresented
which leads to a formulation for the far-field case. Define
r
s
and ρ
i
as,
r
s
=
r
s
−r
1
|r
s
−r
1
|
, ρ
i
=
|
r
i
−r
1
|
|r
s
−r
1
|
. (20)
r
s
represents the unit vector in the source direction and ρ
i
means the ratio of the array size to the distance between
the array and source, that is, for far-field sources, ρ
i
1.
Substituting (20)to(13), we have,
−
(
r
i
−r
1
)
·
r
s
v
+
|r
i
−r
1
|
v
ρ
i
2
−
1
v
v
2
(
t
i
−t
1
)
2
|r
i
−r
1
|
ρ
i
2
=
(
t
i
−t
1
)
.
(21)
The term v(t
i
−t
1
) means the distance difference between the
sound source to the ith and the first microphones. Let the
distance difference be d
i
, that is,
d
i
= v
(
t
i
−t
1
)
=|r
s
−r
i
|−|r
s
−r
1
|. (22)
Equation (21)canberewrittenas
−
(
r
i
−r
1
)
v
·r
s
+ f
i
ρ
i
2
=
(
t
i
−t
1
)
, (23)
where
f
i
=
|
r
i
−r
1
|
v
−
|
d
i
|
v
|d
i
|
|r
i
−r
1
|
. (24)
It is straightforward to see that f
i
≥ 0 since
d
i
≤|r
i
−r
1
|. (25)
Also, f
i
achieves its maximum value of |r
i
− r
1
|/v when
d
i
= 0 (i.e., when the source is located along the line
passing through the midpoint of and perpendicular to the
segment connecting the ith and the first microphone). This
also means that f
i
has the order of magnitude less than or
equal to the magnitude of vector(r
i
−r
1
)/v.
From (23), it is clear that for far-field sources (ρ
i
1), the
delay relation approaches
−
(
r
i
−r
1
)
·w
s
=
(
t
i
−t
1
)
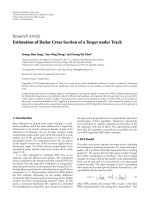
. (26)
Plane wave
Z
Y
r
s
−r
1
θ
i
r
i
−r
1
X
Microphone 1 Microphone i
Figure 1: Geometry model of plane wave and two microphones.
Thus, the left hand side of (23) consists of the far-field term
and near field influence of the delay relation. We define ρ
i
as the field distance ratio and f
i
as the near field influence
factor for their roles in the sound source localization using
microphone array. Equation (26) can also be derived from
a plane wave assumption. Consider a single incident plane
wave and a pair of microphones as shown in Figure 1 and
the relative time delay between two microphones can be
described as:
|r
i
−r
1
|cos
(
θ
i
)
v
= t
1
−t
i
. (27)
The parameters cos(θ
i
)canberepresentedas:
cos
(
θ
i
)
=
(
r
i
−r
1
)
|r
i
−r
1
|
·
(
r
s
−r
1
)
|r
s
−r
1
|
. (28)
Equation (26) can be derived by substituting (28) into (27).
For far-field sources (ρ
i
1), the overdetermined linear
equation system (16) becomes (from (26))
A
f
w
s
= b, (29)
where
A
f
=
⎡
⎢
⎢
⎢
⎢
⎢
⎣
−
(
r
2
−r
1
)
−
(
r
3
−r
1
)
.
.
.
−
(
r
M
−r
1
)
⎤
⎥
⎥
⎥
⎥
⎥
⎦
. (30)
The unit vector of the source direction (w
s
)canbeestimated
using the least square method similar with (18). And the
speed of sound is obtained by
v =
1
w
s
=
1
A
T
f
A
f
−1
A
T
f
b
. (31)
Then, the sound source direction for far-field case can be
given by:
r
s
=
w
s
w
s
=
A
T
f
A
f
−1
A
T
f
b
A
T
f
A
f
−1
A
T
f
b
. (32)
EURASIP Journal on Advances in Signal Processing 5
3.3. Estimation Error Analysis. Equation (29) is an approx-
imation by considering plane wave only. It will give errors
both in the source direction and the speed of sound. The
error in the speed of sound is more interesting as it can
reveal the relative distance information of sources to the
microphone array. It can be shown that the closer the sound
source, the larger the estimate of the speed. To see this,
consider the original close form relation of (23) by moving
the second term on the left-hand side to the right:
−
(
r
i
−r
1
)
v
·r
s
=
(
t
i
−t
1
)
− f
i
ρ
i
2
. (33)
Without loss of generality, assume that t
i
>t
1
. Since both
ρ
i
and f
i
are nonnegative, (33) shows that if the far-field
assumption is utilized (see (26)), the delay shall be decreased
to match the real situation. However, when solving (26),
there is no modification of the value t
i
− t
1
. Therefore,
one possibility to match the case of augmented delay is to
decrease the speed of sound. Another possibility is to change
the direction of the source vector
r
s
. However, for an array
spans the 3D space, the possibility of adjusting the source
direction for all sensor pairs is small since the least square
method is applied. For example, changing the direction may
workforsensorpair(1,i) but has adverse effect on sensor pair
(1, j)if(r
i
−r
1
)and(r
j
−r
1
) are perpendicular to each other.
A simple simulation for estimation error is illustrated for
the microphone locations depicted in Figure 7. We assume
that there is no time delay estimation error and the sound
velocity is 34300 cm/sec. The sound source location is moved
on the direction vector (0.3256, 0.9455, 0) to make sure that
t
i
>t
1
. The estimated sound source direction and velocity are
obtained by using (31)and(32). Figure 2 shows the relation
between direction estimation error and the factor 1/ρ
2
.
The direction estimation error is defined as the difference
between real angel and estimated angle. As it can be seen, the
estimation error becomes smaller and converges to a small
value when 1/ρ
2
is increased. In particular, the estimation
error would not change dramatically when 1/ρ
2
is larger than
5(
|r
s
− r
1
| is larger than five times of |r
2
− r
1
|). Figure 3
shows the relation between estimated velocity and 1/ρ
2
.The
estimated velocity converges to 34300 when 1/ρ
2
is increased
and this is consistent with the analysis at the beginning of this
section.
4. Sound Source Number and
Directions Estimation
This paper assumes that the distance from source to the
array is much larger than the array aperture, and (29)
is used to solve the sound source direction estimation
problem. If the number of sound sources is known, the
sound source directions can be estimated by putting time
delay vector b of corresponding sound source into (32).
However, if the sound source number is unknown, the sound
source directions estimation will become more complicated
since there are several combinations to form the timed
delay vectors. This section describes how to estimate the
sound sources number and directions simultaneously using
0
10
20
30
40
50
60
70
80
Direction estimation error (degree)
0 5 10 15 20 25 30 35
1/ρ
2
Figure 2: Direction estimation error versus 1/ρ
2
.
3.4
3.6
3.8
4
4.2
4.4
4.6
4.8
5
×10
4
Estimated velocity (cm/sec)
0 5 10 15 20 25 30 35
1/ρ
2
Figure 3: Estimated velocity versus 1/ρ
2
.
the proposed method in Sections 2 and 3.2. A two-step
algorithm is proposed to estimate the source number. First,
the combinations of delays are filtered by the estimated
sound velocity which does not fall within a reasonable range
of the true one. But in a reverberant environment, it is still
possible to have a phantom source that results in reasonable
sound speed estimation. This paper assumes that the power
level of phantom source is much weaker than that of the
true source. Therefore, only a true source can exhibit a
consistent estimation of direction on consecutive frames
of signals because the weighting function of ES-GCC also
has certain robustness to reverberation. The second step
of source number estimation is to cluster the accumulated
results from the first step using clustering technique and
the reverberation can be considered as the outlier for the
clustering technique. The well-known clustering method, K-
means, is sensitive to initial conditions and is not robust to
outliers. In addition, the cluster number should be known in
6 EURASIP Journal on Advances in Signal Processing
α.R
x
2
x
1
(τ
1
x
2
x
1
)
R
x
2
x
1
(τ)
−20
τ
α.R
x
3
x
1
(τ
1
x
3
x
1
)
−30 3
τ
R
x
3
x
1
(τ)
α.R
x
M
x
1
(τ
1
x
M
x
1
)
R
x
M
x
1
(τ)
1
τ
Microphone
pair
Time delay
sample candidates
n
max
i
(2, 1)
(3, 1)
(M,1)
−2
−3
1
0
03
n
max
2
= 2
n
max
3
= 3
n
max
M
= 1
.
.
.
.
.
.
.
.
.
.
.
.
.
.
.
1
f
s
⎡
⎢
⎢
⎢
⎢
⎢
⎣
−
2
−3
.
.
.
1
⎤
⎥
⎥
⎥
⎥
⎥
⎦
1
f
s
⎡
⎢
⎢
⎢
⎢
⎢
⎣
−
2
0
.
.
.
1
⎤
⎥
⎥
⎥
⎥
⎥
⎦
···
1
f
s
⎡
⎢
⎢
⎢
⎢
⎢
⎣
0
3
.
.
.
1
⎤
⎥
⎥
⎥
⎥
⎥
⎦
Possible time delay
vector combinations
b
1
b
2
···b
n
max
2
×n
max
3
×···×n
max
M
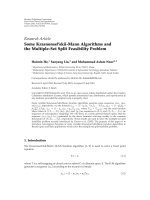
Figure 4: Illustration of the procedure of forming possible time delay vector combinations.
advance for K-means which cannot be met in our scenario
since we have no information of the sound source number.
To improve the problems of robustness and cluster number,
this paper proposes the adaptive K-means++ method based
on the K-means [26] and K-means++ [27] methods for
clustering. The K-means++ method is a way of initializing
K-means by choosing random starting centers with very
specific probabilities. It then runs the normal K-means
algorithm afterwards. Because the seeding technique of K-
means++ method can improve both the speed and accuracy
of the K-means method [27], this paper employs the seeding
technique of K-means++ method to seed the initial centers
for the proposed adaptive K-means++ method.
4.1. Rejecting Incorrect Time Delay Combinations Using
Acceptable Velocity Range. For multiple sound sources envi-
ronment, the GCC function should have multiple peaks [28].
Without a priori knowledge of the sound source number, the
time delay sample for each microphone pair which meets the
constraint below will be selected as the time delay sample
candidates:
R
x
i
x
1
τ
n
i
x
i
x
1
>α·R
x
i
x
1
τ
1
x
i
x
1
, n
i
= 2, 3, , n
max
i
,
i
= 2, 3, , M,
(34)
where α is a gain factor and
τ
1
x
i
x
1
and τ
n
i
x
i
x
1
are the time delay
samples corresponding to the largest and the n
i
th largest peak
in ES-GCC function R
x
i
x
1
.IfR
x
i
x
1
possesses no time delay
sample that can meet the constraint above, the n
max
i
will be
set to one. Hence, there are n
max
2
×n
max
3
×···×n
max
M
possible
combinations to form the possible time delay vector b
u
and
there should be D correct combinations in those possible
combinations. Figure 4 illustrates the procedure of forming
the possible time delay vector combinations and f
s
is the
sampling rate. The relation between estimated time delay and
estimated time delay sample is:
t
i
−
t
1
=
1
f
s
× τ
x
i
x
1
, (35)
where
t
i
is the estimated time delay from the sound
source to the ith microphone and
τ
x
i
x
1
is the estimated
time delay sample between the ith microphone and the
first microphone. The next issue is how to choose correct
combinations and determine the sound source number.
To access whether the delay combination is likely to be a
correct one, this work proposes a novel concept of evaluating
if the corresponding sound velocity estimation of (31)is
within an acceptable range. In other words, each possible
combination b
u
is plugged into (31) to compute the sound
velocity. It is considered as a correct combination if the
following criterion is satisfied.
1
A
T
f
A
f
−1
A
T
f
b
u
−
v
<ε,
u
= 1, 2, 3, , n
max
2
×n
max
3
×···×n
max
M
,
(36)
where
v = 34300 is the sound velocity in cm/sec and ε is
a threshold representing the acceptable range. Assume that
EURASIP Journal on Advances in Signal Processing 7
there are
D combinations (
b
1
,
b
2
, ,
b
D
) satisfying (36)and
the corresponding sound sources direction can be obtained
by
r
u
=
x
u
y
u
z
u
=
A
T
f
A
f
−1
A
T
f
b
u
A
T
f
A
f
−1
A
T
f
b
u
,
θ
u
= tan
−1
y
u
x
u
, φ
u
= tan
−1
⎛
⎝
z
u
x
2
u
+ y
2
u
⎞
⎠
,
u
= 1, 2, 3, ,
D,
(37)
where θ
u
and φ
u
are azimuth and elevation angle for the
sound source, respectively.
4.2. Proposed Adaptive K-means++ for Sound Source Number
and Directions Estimation. For the robustness consideration,
the final sound source number and directions will be
determined over Q-times results from (37). Define all the
accumulated estimation angle results over Q-times of (37)
estimation as
θ =
θ
1
θ
2
···
θ
G
,
ϕ =
φ
1
φ
2
···
φ
G
,
G
= Q ×
D
1
+
D
2
+ ···+
D
Q
,
(38)
where
D
q
represents the combination number which meets
(36) constraint at the qth testing. So far, we have G data and
each data has two features (
θ
g
and
φ
g
). Our goal is to divide
these data into
D clusters based on the two features. A cluster
is defined as a set of sound source direction data points. For
a cluster, the data within this cluster should be similar to one
another and it means that the data within this cluster should
come from the same sound source direction. The number
D
is defined as the sound source number. Therefore, among
the set of G sound source direction data points, we wish
to choose
D cluster centers so as to minimize the potential
function:
min
D
d=1
σ
g
∈C
d
σ
g
−μ
d
2
, σ
g
=
θ
g
φ
g
,
g
= 1, 2, 3, , G,
(39)
where there are
D clusters {C
1
, C
2
, , C
D
} and μ
d
is the
center of all the points σ
g
∈ C
d
. The sound source direction
data σ
g
is assigned to C
d
,ifμ
d
is the closet cluster center
to σ
g
. Because the sound source number is unknown, we
set the cluster number
D to be one and initial center μ
1
to be the median of
θ and ϕ as the initial condition to
execute K-means. When the K-means algorithm converges,
the constraint below is checked:
E
σ
g
−μ
d
2
<δ, σ
g
∈ C
d
,
d = 1, 2, ,
D, (40)
where E(
·) is the expectation operation and δ is a specified
threshold. Equation (40) is used to check the variance of each
cluster when the K-means algorithm converges. If one of the
variance of each cluster is not less than δ, the value of
D is
increased by one. Then the other initial center μ
D
is found by
using the seeding technique of K-means++ [27]definedin
(41) and the K-means algorithm is computed again.
Find the integer
G that
G
g=1
DIS
σ
g
≥
DIS >
G−1
g=1
DIS
σ
g
,
μ
D
= σ
G
,
(41)
where DIS(σ
g
) represents the distance between σ
g
and the
nearestcenterwehavealreadychosen;
DIS is the real number
chosen uniformly at random between 0 and
G
g
=1
DIS(σ
g
).
Otherwise, the final sound source number is
D and the
sound source directions are
θ
d
φ
d
=
μ
d
d = 1, 2, ,
D. (42)
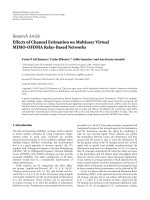
For the adaptive K-means++ algorithm, the inputs are
σ
g
and the outputs are μ
d
and
D. The flowchart of the
adaptive K-means++ algorithm for estimating the sound
sources number and directions is shown in Figure 5 and is
summarized as follows.
Step 1. Calculate ES-GCC function R
x
i
x
1
(τ). Pick the peaks
satisfying (34)fromR
x
i
x
1
(τ) for each microphone pair and
list all the possible time delay vector combinations b
u
.
Step 2. Select
D time delay vector from b
u
using (36)and
estimate the corresponding sound source direction using
(37).
Step 3. Repeat Steps 1 to 2 Q times and accumulate the
results. Before each repeat, shift the start frame of Step 1 with
K frames.
Step 4. Cluster the accumulated results using adaptive K-
means++ algorithm and the final cluster number and centers
are sound source number and directions, respectively.
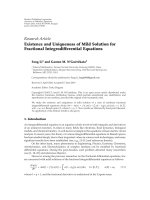
5. Experimental Results
The experiments were performed in a real room approx-
imately of the size 10.5 m
× 7.2 m and height of 3.6 m
and its reverberation time at 1000 Hz is 0.52 second. The
reverberation time was measured by playing a 1000 Hz tone
and then estimating the time of the direct sound to decay
by 60 dB below the level of the direct sound. An 8-channel
digital microphone array platform is installed on the robot
for the experiment shown in Figure 6 and the microphone
positions are marked with the circle symbol. The room
temperature is approximately 22
◦
C and the sampling rate is
16 kHz. The experimental condition is shown in Figure 7 and
8 EURASIP Journal on Advances in Signal Processing
Set
D = 1andthe
first initial center to be
the median of
θ and ϕ
Start
Execute
K-means algorithm
Find the other initial
center using
the seeding technique of
K-means++ algorithm
defined in (41)
Sound source number
=
D
Sound source directions
θ
d
φ
d
=
μ
d
d = 1, 2, ,
D
Check
equation (40)
constraint
D
=
D +1
Ye s N o
Figure 5: The flowchart of adaptive K-means++ algorithm.
the distance from each sound source to the origin is 270 cm.
The sound sources are Chinese and English conversational
speech in female and male. Each conversational speech
source is different and is spoken by different people. In
Figure 7, the microphone and sound source locations are set
to (cm)
Mic.1
=
20 20 0
,Mic.2 =
20 −20 0
,
Mic.3
=
[
−20 −20 0
]
,Mic.4 =
−
20 20 0
,
Mic.5 =
02030
,Mic.6 =
020−30
,
Mic.7
=
0 −20 30
,Mic.8 =
0 −20 −30
,
S1 =
190 −190 0
, S2 =
190 190 24
,
S3
=−
188 188 47
, S4 =
−
190 −190 0
,
S5 =
0 269 −24
, S6 =
0 −266 −47
.
(43)
The dehumidifier which is 430 cm from the first micro-
phone is turned on during this experiment (Noise 1 in
Figure 7). The parameters of α, ε,andδ are determined by
our experience and are empirically set to be 0.7, 5000, and
23. The accumulation parameters Q and
K are set to be 20
and 25.
5.1. ES-GCC Time Delay Estimation Performance Evaluation.
Two GCC-based TDE algorithms, GCC-PHAT and GCC-
ML [2], are computed to compare with the proposed ES-
GCC algorithm. Seven microphone pairs ((1,2), (1,3), (1,4),
(1,5), (1,6), (1,7), and (1,8) ) and six sound source positions
in Figure 7 are selected for this TDE experiment. For each
test, only one speech source is active and seven microphone
Figure 6: Digital microphone array mounted on the robot.
pairs are all chosen to test. The STFT size is set to be 512
with 50% overlap and mutually independent white Gaussian
noise is properly scaled and added to each microphone signal
to control the signal-to-noise ratio (SNR). The performance
index, Root Mean Square Error (RMSE), is defined below to
evaluate the performance of the suggested method:
RMSE
=
1
N
T
N
T
i=1
D
i
−D
i
2
, (44)
where N
T
is the total number of estimation,
D
i
is the ith time
delay estimation, and D
i
is the ith correct delay sample with
a integer. Figure 8 shows the RMSE results as a function of
SNR for three different TDE algorithms. The total number of
EURASIP Journal on Advances in Signal Processing 9
Noise 1
S5
S2
S1
S6
S4
S3
Mic.7
Mic.5
Mic.4
Mic.3
Mic.8
Mic.6
Mic.2
Mic.1
Y
X
Z
Figure 7: Arrangement of microphone array and sound sources.
0
2
4
6
8
10
12
RMSE (samples)
−505101520
SNR
ES-GCC
GCC-ML
GCC-PHAT
Figure 8: TDE RMSE results versus SNR.
estimation N
T
is 294. As seen from Figure 8, the GCC-PHAT
yields better TDE performance than GCC-ML at higher SNR.
This is because the experimental environment is reverberant
and the GCC-ML suffers significant performance degrada-
tion under reverberation.
Comparing to GCC-ML, the GCC-PHAT has robustness
with respect to reverberation. However, the GCC-PHAT
method neglects the noise effect, and hence, it begins to
exhibit dramatic performance degradation as the SNR is
decreased. Unlike GCC-PHAT, GCC-ML does not exhibit
this phenomenon since it has a priori knowledge about
the noise power spectra which can help estimator to cope
with distortion. The ES-GCC achieves the best performance,
because the ES-GCC method does not focus on the weighting
function process of GCC-based method and it directly
takes the principal component vector as the microphone
received signal for further signal processing. The appendix
0
0.5
1
1.5
2
2.5
3
3.5
4
RMSE (sound source number)
123456
Sound source number
Proposed
ITC
Figure 9: Sound source number estimation result.
provides the proof that the principal component vector can
be considered as the approximation of speech-only signal
and this is the reason why the ES-GCC method is robust to
the SNR.
5.2. Evaluation of Sound Source Number and Directions
Estimation. The wideband incoherent MUSIC algorithm
[9] with arithmetic mean is adopted to compare with
the proposed algorithm. Ten major frequencies, ranging
from 0.1 KHz to 3.4KHz, were adopted for the MUSIC
algorithm. Outliers were removed from the estimated angles
by utilizing the method provided in [29]. In addition, the
sound source number should be known first for MUSIC
algorithm to construct the noise projection matrix. There-
fore, the eigenvalues-based information theoretic criteria
(ITC) method [21] is employed to estimate the sound source
number. The sound source number estimation RMSE result
is shown in Figure 9 and the averaged SNR is 17.23 dB. The
RMSE is defined similar to (44) with a different measurement
unit. The sound source positions are chosen randomly
from six positions shown in Figure 7 and the number of
estimation N
T
for each condition is 100. The noise 1 in
Figure 7 is active in this experiment. As can be seen, the
proposed sound source number estimation method yields
better performance than the ITC method. One of the reasons
is that the eigenvalue distribution is sensitive to reverberation
and background noise. When the sound source number is
larger than or equal to three, the ITC method often estimates
a higher sound source number (5, 6, or 7).
The sound source direction estimation RMSE result is
shown in Figure 10. For fair comparison, the RMSE is calcu-
lated when the sound source number estimation is correct.
Figure 10 shows that the MUSIC algorithm becomes worse
as the sound source number is increased since the MUSIC
algorithm is sensitive to coherent signal especially when the
environment is multiple sound sources and reverberant. The
10 EURASIP Journal on Advances in Signal Processing
0
10
20
30
40
50
60
70
RMSE (degree)
0123456
Sound source number
Proposed
MUSIC
Figure 10: Sound source directions estimation result.
proposed method uses sound velocity as the criterion for
time delay candidate selection and the adaptive K-means++
is employed at final stage to cluster the sound source number
and directions. The other advantage of the proposed method
is that there is no a priori knowledge for sound source
number and we use the adaptive K-means++ to estimate
the sound source number and directions simultaneously.
An incorrect sound source number for MUSIC algorithm
would cause an even worse performance than Figure 10.In
addition, in multiple sound sources case, if we take all time
delay combinations to estimate the sound source direction
without sound velocity selection mechanism, the result
becomes very poor. We find that the wrong combination of
time delay vector b
u
will cause the estimated sound speed to
range between 9000 and 15000 or more than 50000.
6. Conclusion
This work explains a sound source number and directions
estimation algorithm. The multiple source time delay vec-
tor combination problem can be solved by the proposed
reasonable sound velocity-based method. By accumulating
the estimated sound source angle, the sound source number
and directions can be obtained by the proposed adaptive K-
means++ algorithm. The proposed algorithm is evaluated in
a real environment and the experimental results show that
the proposed algorithm is robust to real environment and
can provide reliable information for further robot audition
research.
The accuracy of adaptive K-means++ may be influenced
by outliers if there is no outlier rejection. Therefore, the
outlier rejection method may be incorporated to improve
the performance. Moreover, the parameters of α, ε,andδ
are determined by our experience. In our experience, the
parameter ε is not as sensitive as α and δ to influence the
results. The sensitivity of these parameters to influence the
results is the other issue and this is left as a further research
topic.
Appendix
Equation (2) can also be written as a square matrix form:
X
(
ω, k
)
= A
s
(
ω
)
S
s
(
ω, k
)
+ N
(
ω, k
)
,(A.1)
where
X
(
ω, k
)
=
X
1
(
ω, k
)
, , X
M
(
ω, k
)
T
∈ C
M×1
,
N
(
ω, k
)
=
N
1
(ω, k), , N
M
(
ω, k
)
T
∈ C
M×1
,
S
s
(
ω, k
)
=
S
1
(
ω, k
)
, , S
D
(
ω, k
)
0, ,0
T
∈ C
M×1
,
A
s
(
ω
)
=
⎡
⎢
⎢
⎢
⎣
A
11
(
ω
)
··· A
1D
(
ω
)
0
···0
.
.
.
.
.
.
.
.
.
A
M1
(
ω
)
··· A
MD
(
ω
)
0
···0
⎤
⎥
⎥
⎥
⎦
∈
C
M×M
.
(A.2)
Suppose that the noises are spatially white, and the noise
correlation matrix is diagonal matrix σ
2
n
I. Therefore, the
received signal correlation matrix with EVD can be described
as
R
xx
(
ω
)
=
1
K
K
k=1
X
(
ω, k
)
X
H
(
ω, k
)
= A
s
(
ω
)
R
ss
(
ω
)
A
H
s
(
ω
)
+ σ
2
n
I
=
M
m=1
λ
m
(
ω
)
V
m
(
ω
)
V
H
m
(
ω
)
,
(A.3)
where R
ss
(ω) = (1/K)
K
k=1
S
s
(ω, k)S
H
s
(ω, k); λ
m
(ω)and
V
m
(ω) are eigenvalues and corresponding eigenvectors with
λ
1
(ω) ≥ λ
2
(ω) ≥···≥λ
M
(ω). Since the M eigenvectors are
orthogonal to one another, they form a basis and can be used
to express an arbitrary vector v(ω) in the following
v
(
ω
)
=
M
m=1
λ
m
(
ω
)
V
m
(
ω
)
∈ C
M×1
. (A.4)
Since V
H
m
(ω)V
i
(ω) = 0form
/
=i and V
H
m
(ω)V
i
(ω) = 1for
m
= i. Therefore, the dot product of v(ω)andV
i
(ω)is
v
H
(
ω
)
V
i
(
ω
)
=
M
m=1
λ
H
m
(
ω
)
V
H
m
(
ω
)
V
i
(
ω
)
= λ
H
i
(
ω
)
. (A.5)
Substituting (A.5) into (A.4), we have
v
(
ω
)
=
M
m=1
V
H
m
(
ω
)
v
(
ω
)
V
m
(
ω
)
=
M
m=1
V
m
(
ω
)
V
H
m
(
ω
)
v
(
ω
)
.
(A.6)
EURASIP Journal on Advances in Signal Processing 11
Therefore, I
=
M
m
=1
V
m
(ω)V
H
m
(ω). Because σ
2
n
I =
M
m=1
σ
2
n
V
m
(ω)V
H
m
(ω), we have the signal-only correlation
matrix:
C
xx
(
ω
)
= A
s
(
ω
)
R
ss
(
ω
)
A
H
s
(
ω
)
=
M
m=1
λ
m
(
ω
)
−σ
2
n
V
m
(
ω
)
V
H
m
(
ω
)
= V
s
(
ω
)
Λ
s
(
ω
)
V
H
s
(
ω
)
,
(A.7)
where
V
s
(
ω
)
=
V
1
(
ω
)
··· V
M
(
ω
)
∈
C
M×M
,
Λ
s
(
ω
)
=
⎡
⎢
⎢
⎣
λ
1
(
ω
)
−σ
2
n
0
.
.
.
0 λ
M
(
ω
)
−σ
2
n
⎤
⎥
⎥
⎦
∈
C
M×M
.
(A.8)
Applying QR factorization to A
s
(ω), we have
A
s
(
ω
)
= Q
(
ω
)
R
(
ω
)
,(A.9)
where
Q
(
ω
)
=
⎡
⎢
⎢
⎣
q
11
(
ω
)
··· q
1M
(
ω
)
.
.
.
.
.
.
.
.
.
q
M1
(
ω
)
··· q
MM
(
ω
)
⎤
⎥
⎥
⎦
∈
C
M×M
,
R
(
ω
)
=
⎡
⎢
⎢
⎢
⎢
⎣
r
11
(
ω
)
··· r
1M
(
ω
)
0
.
.
.
.
.
.
.
.
.
00
···0 r
MM
(
ω
)
⎤
⎥
⎥
⎥
⎥
⎦
∈
C
M×M
.
(A.10)
Hence,
C
xx
(
ω
)
= A
s
(
ω
)
R
ss
(
ω
)
A
H
s
(
ω
)
= Q
(
ω
)
R
(
ω
)
R
ss
(
ω
)
R
H
(
ω
)
Q
H
(
ω
)
= Q
(
ω
)
R
(
ω
)
R
ss
(
ω
)
R
H
(
ω
)
Q
−1
(
ω
)
.
(A.11)
A
s
(ω)R
ss
(ω)A
H
s
(ω)andR(ω)R
ss
(ω)R
H
(ω) are similar
matrix and they have the same eigenvalues. Decompose
R(ω)R
ss
(ω)R
H
(ω) using EVD, and we have
R
(
ω
)
R
ss
(
ω
)
R
H
(
ω
)
= Δ
(
ω
)
Λ
s
(
ω
)
Δ
H
(
ω
)
, (A.12)
where Δ(ω) is the eigenvector matrix of R(ω)R
ss
(ω)R
H
(ω)
defined as
Δ
(
ω
)
=
Δ
1
(
ω
)
··· Δ
M
(
ω
)
∈
C
M×M
,
Δ
m
(
ω
)
=
Δ
1m
(ω) ··· Δ
Mm
(ω)
T
∈ C
M×1
.
(A.13)
Therefore, substituting (A.12) into (A.11), we have the
relationship between V
m
(ω)andΔ
m
(ω):
V
m
(
ω
)
= Q
(
ω
)
Δ
m
(
ω
)
m
= 1, 2, , M (A.14)
Next, we need to represent Δ
m
(ω) using R(ω)andS
d
(ω)for
further process. The matrix R(ω)R
ss
(ω)R
H
(ω) can also be
expressed as
R
(
ω
)
R
ss
(
ω
)
R
H
(
ω
)
= E
R
(
ω
)
S
s
(
ω
)
S
H
s
(
ω
)
R
H
(
ω
)
=
E
⎧
⎪
⎪
⎪
⎪
⎪
⎪
⎪
⎪
⎪
⎪
⎪
⎪
⎪
⎪
⎪
⎪
⎪
⎪
⎪
⎪
⎪
⎪
⎪
⎪
⎪
⎪
⎪
⎨
⎪
⎪
⎪
⎪
⎪
⎪
⎪
⎪
⎪
⎪
⎪
⎪
⎪
⎪
⎪
⎪
⎪
⎪
⎪
⎪
⎪
⎪
⎪
⎪
⎪
⎪
⎪
⎩
⎡
⎢
⎢
⎢
⎢
⎢
⎢
⎢
⎢
⎢
⎢
⎢
⎢
⎢
⎢
⎢
⎢
⎢
⎢
⎢
⎢
⎢
⎢
⎢
⎢
⎢
⎣
D
d=1
r
1d
(
ω
)
S
d
(
ω
)
D
d=2
r
2d
(
ω
)
S
d
(
ω
)
.
.
.
D
d=D
r
Dd
(
ω
)
S
d
(
ω
)
0
.
.
.
0
⎤
⎥
⎥
⎥
⎥
⎥
⎥
⎥
⎥
⎥
⎥
⎥
⎥
⎥
⎥
⎥
⎥
⎥
⎥
⎥
⎥
⎥
⎥
⎥
⎥
⎥
⎦
⎡
⎢
⎢
⎢
⎢
⎢
⎢
⎢
⎢
⎢
⎢
⎢
⎢
⎢
⎢
⎢
⎢
⎢
⎢
⎢
⎢
⎢
⎢
⎢
⎢
⎢
⎣
D
d=1
r
1d
(ω)S
d
(ω)
D
d=2
r
2d
(ω)S
d
(ω)
.
.
.
D
d=D
r
Dd
(ω)S
d
(ω)
0
.
.
.
0
⎤
⎥
⎥
⎥
⎥
⎥
⎥
⎥
⎥
⎥
⎥
⎥
⎥
⎥
⎥
⎥
⎥
⎥
⎥
⎥
⎥
⎥
⎥
⎥
⎥
⎥
⎦
H
⎫
⎪
⎪
⎪
⎪
⎪
⎪
⎪
⎪
⎪
⎪
⎪
⎪
⎪
⎪
⎪
⎪
⎪
⎪
⎪
⎪
⎪
⎪
⎪
⎪
⎪
⎪
⎪
⎬
⎪
⎪
⎪
⎪
⎪
⎪
⎪
⎪
⎪
⎪
⎪
⎪
⎪
⎪
⎪
⎪
⎪
⎪
⎪
⎪
⎪
⎪
⎪
⎪
⎪
⎪
⎪
⎭
=
⎡
⎢
⎢
⎢
⎢
⎢
⎢
⎢
⎢
⎢
⎢
⎢
⎢
⎢
⎢
⎢
⎢
⎢
⎣
E
z
1
(
ω
)
z
H
1
(
ω
)
E
z
1
(
ω
)
z
H
2
(
ω
)
···
E
z
1
(
ω
)
z
H
D
(
ω
)
0 ··· 0
E
z
2
(
ω
)
z
H
1
(
ω
)
.
.
.
E
z
2
(
ω
)
z
H
2
(
ω
)
···
.
.
.
E
z
2
(
ω
)
z
H
D
(
ω
)
.
.
.
0
···
.
.
.
0
.
.
.
E
z
D
(
ω
)
z
H
1
(
ω
)
E
z
D
(
ω
)
z
H
2
(
ω
)
···
E
z
D
(
ω
)
z
H
D
(
ω
)
0 ··· 0
0
.
.
.
0
···
.
.
.
0
.
.
.
0
···
.
.
.
0
.
.
.
00
··· 00··· 0
⎤
⎥
⎥
⎥
⎥
⎥
⎥
⎥
⎥
⎥
⎥
⎥
⎥
⎥
⎥
⎥
⎥
⎥
⎦
∈
C
M×M
,
(A.15)
12 EURASIP Journal on Advances in Signal Processing
where E(
·) is the expectation operation and
z
i
(
ω
)
=
D
d=i
r
id
(
ω
)
S
d
(
ω
)
E
z
i
(
ω
)
z
H
j
(
ω
)
=
D
d=i
E
(
r
id
(
ω
)
S
d
(
ω
))
×
D
d=j
E
S
H
d
(
ω
)
r
H
jd
(
ω
)
+ σ
2
ij
(
ω
)
σ
2
ij
(
ω
)
=
⎧
⎪
⎪
⎪
⎪
⎪
⎪
⎨
⎪
⎪
⎪
⎪
⎪
⎪
⎩
D
d=i
r
id
(
ω
)
r
H
jd
(
ω
)
var
(
S
d
(
ω
))
if i
= j
D
d=max
(
i,j
)
r
id
(
ω
)
r
H
jd
(
ω
)
var
(
S
d
(
ω
))
if i
/
= j
(A.16)
where var(x) is the variance of x,max(i, j) is the maximum
value and between i and j.
From (A.15) and the eigenvalue equation (R(ω)R
ss
(ω)R
H
(ω)Δ
m
(ω) = (λ
m
(ω) − σ
2
n
)Δ
m
(ω)), we have the linear
equation in M unknowns (Δ
1m
(ω), Δ
2m
(ω), , Δ
Mm
(ω))
shown at (A.17):
D
k=1
E
θ
1
(
ω
)
θ
H
k
(
ω
)
Δ
km
(
ω
)
=
λ
m
(
ω
)
−σ
2
n
Δ
1m
(
ω
)
−μ
1m
(
ω
)
,
D
k=1
E
θ
2
(
ω
)
θ
H
k
(
ω
)
Δ
km
(
ω
)
=
λ
m
(
ω
)
−σ
2
n
Δ
2m
(
ω
)
−μ
2m
(
ω
)
,
.
.
.
D
k=1
E
θ
D
(
ω
)
θ
H
k
(
ω
)
Δ
km
(
ω
)
=
λ
m
(
ω
)
−σ
2
n
Δ
Dm
(
ω
)
−μ
Dm
(
ω
)
,
0
=
λ
m
(
ω
)
−σ
2
n
Δ
βm
(
ω
)
,
(A.17)
where μ
pm
(ω) is the variance part which is defined as
μ
pm
(
ω
)
=
D
k=1
Δ
km
σ
2
pk
(
ω
)
, p
= 1, 2, ···D
β
= D +1,D +2, , M
E
θ
i
(
ω
)
θ
H
j
(
ω
)
=
E
z
i
(
ω
)
z
H
j
(
ω
)
−
σ
2
ij
(
ω
)
(A.18)
To solve Δ
dm
(ω), we assume that the variance part μ
pm
(ω)
can be neglected. This is possible if (λ
m
(ω)−σ
2
n
)Δ
dm
(ω)
μ
dm
(ω). Therefore we chose the maximum eigenvalue
(λ
1
(ω) −σ
2
n
) to solve this linear equation. In (A.17), the first
row divided by the second row is and we have
D
k=1
E
θ
1
(
ω
)
θ
H
k
(
ω
)
Δ
k1
(
ω
)
D
k=1
E
θ
2
(
ω
)
θ
H
k
(
ω
)
Δ
k1
(
ω
)
=
Δ
11
(
ω
)
Δ
21
(
ω
)
=
D
d=1
E
(
r
1d
(
ω
)
S
d
(
ω
))
×A
D
d=2
E
(
r
2d
(
ω
)
S
d
(
ω
))
×A
,
(A.19)
where A denotes (
D
k=1
D
d=k
E(S
H
d
(ω)r
H
kd
(ω))Δ
k1
(ω)).
Therefore,
Δ
11
(
ω
)
Δ
21
(
ω
)
=
D
d=1
E
(
r
1d
(
ω
)
S
d
(
ω
))
D
d
=2
E
(
r
2d
(
ω
)
S
d
(
ω
))
. (A.20)
With the similar method, the eigenvector Δ
1
(ω) associated
with the maximum eigenvalue can be obtained:
Δ
i1
(
ω
)
=
⎧
⎪
⎪
⎨
⎪
⎪
⎩
β ·
D
d=i
E
(
r
id
(
ω
)
S
d
(
ω
))
if i
≤ D
0ifi>D,
i
= 1, 2, ···M,
(A.21)
where β is a scalar.
Hence, the eigenvector can be represented as
V
1
(
ω
)
= Q
(
ω
)
Δ
1
(
ω
)
=
⎡
⎢
⎢
⎢
⎢
⎢
⎢
⎢
⎢
⎢
⎢
⎢
⎢
⎢
⎢
⎢
⎢
⎢
⎣
β ·
D
i=1
⎛
⎝
q
1i
(
ω
)
×
D
d=i
E
(
r
id
(
ω
)
S
d
(
ω
))
⎞
⎠
β ·
D
i=1
⎛
⎝
q
2i
(
ω
)
×
D
d=i
E
(
r
id
(
ω
)
S
d
(
ω
))
⎞
⎠
.
.
.
β
·
D
i=1
⎛
⎝
q
Mi
(
ω
)
×
D
d=i
E
(
r
id
(
ω
)
S
d
(
ω
))
⎞
⎠
⎤
⎥
⎥
⎥
⎥
⎥
⎥
⎥
⎥
⎥
⎥
⎥
⎥
⎥
⎥
⎥
⎥
⎥
⎦
.
(A.22)
If the observation time is sufficiently long, then S
d
(ω, k) ≈
E(S
d
(ω)). Therefore, the microphone received signal can be
EURASIP Journal on Advances in Signal Processing 13
modeled as
X
(
ω, k
)
= A
s
(
ω
)
S
s
(
ω, k
)
+ N
(
ω, k
)
= Q
(
ω
)
R
(
ω
)
S
s
(
ω, k
)
+ N
(
ω, k
)
=
⎡
⎢
⎢
⎢
⎢
⎢
⎢
⎢
⎢
⎢
⎢
⎢
⎢
⎢
⎢
⎢
⎣
D
i=1
⎛
⎝
q
1i
(
ω
)
×
D
d=i
r
id
(
ω
)
E
(
S
d
(
ω
))
⎞
⎠
+ N
1
(
ω, k
)
D
i=1
⎛
⎝
q
2i
(
ω
)
×
D
d=i
r
id
(
ω
)
E
(
S
d
(
ω
))
⎞
⎠
+ N
2
(
ω, k
)
.
.
.
D
i=1
⎛
⎝
q
Mi
(
ω
)
×
D
d=i
r
id
(
ω
)
E
(
S
d
(
ω
))
⎞
⎠
+ N
M
(
ω, k
)
⎤
⎥
⎥
⎥
⎥
⎥
⎥
⎥
⎥
⎥
⎥
⎥
⎥
⎥
⎥
⎥
⎦
=
1
β
V
1
(
ω
)
+ N
(
ω, k
)
.
(A.23)
Ascanbeseenfrom(A.23), the received speech signal is
only the scalar version of the corresponding eigenvector for
the maximum eigenvalue. Therefore, we take this eigenvector
as the microphone received signal for time delay estima-
tion. Equation (A.23) is obtained by using the maximum
eigenvalue to solve (A.17). If other eigenvalues can also
neglect the variance as (λ
m
(ω) −σ
2
n
)Δ
dm
(ω) μ
dm
(ω), they
can also have the speech signal approximation property. It
represents that if the sound source number is one, V
1
(ω)
is the only eigenvector which can represent the received
speech signal since λ
1
(ω) is the only dominant eigenvalue
and the other eigenvectors (V
i
(ω), i = 2, 3, , M)contain
the noise information. If the sound source number is larger
than one, the other eigenvectors (V
i
(ω), i = 2, 3, , D)
may contain some speech signal information. However, the
conversational speech sources are asynchronous and contain
many short pauses. Some speech sources information may
not be represented by V
1
(ω) in this frame but may be
represented in the next frame. Based on this concept, this
paper uses eigenvector V
1
(ω) for time delay estimation since
it can represent received speech signal most, accumulates the
estimated DOA results, and uses adaptive K-means++ for
clustering the accumulated results. The algorithms that use
the vectors that lie in the signal subspace are based on a
principal components analysis (PCA) of the autocorrelation
matrix and are referred to as signal subspace method [24].
This paper further justifies the use of V
1
(ω) since it can
represent the speech signal better than the other eigenvectors
from (A.17)and(A.23).
References
[1] G.C.Carter,A.H.Nuttall,andP.G.Cable,“Thesmoothed
coherence transform (SCOT),” Tech. Memo TC-159-72, Naval
Underwater Systems Center, New London Laboratory, New
London, Conn, USA, 1972.
[2]C.H.KnappandG.C.Carter,“Thegeneralizedcorrelation
method for estimation of time delay,” IEEE Transactions on
Acoustics, Speech, and Signal Processing, vol. 24, pp. 320–327,
1976.
[3] M.S.BrandsteinandH.F.Silverman,“Arobustmethodfor
speech signal time-delay estimation in reverberant rooms,” in
Proceedings of the IEEE International Conference on Acoustics,
Speech, and Signal Processing (ICASSP ’97), pp. 375–378,
Munich, Germany, April 1997.
[4]Q.H.Wang,T.Ivanov,andP.Aarabi,“Acousticrobot
navigation using distributed microphone arrays,” Information
Fusion, vol. 5, no. 2, pp. 131–140, 2004.
[5] J. Scheuing and B. Yang, “Correlation-based TDOA-
estimation for multiple sources in reverberant environments,”
in Speech and Audio Processing in Adverse Environments,
Chapter 11, pp. 381–416, Springer, Berlin, Germany, 2008.
[6] S. Doclo and M. Moonen, “Robust adaptive time delay
estimation for speaker localization in noisy and reverberant
acoustic environments,” EURASIP Journal on Applied Signal
Processing, vol. 2003, no. 11, pp. 1110–1124, 2003.
[7] R. V. Balan and J. Rosca, “Apparatus and method for
estimating the direction of Arrival of a source signal using a
microphone array,” European Patent no. US2004013275, 2004.
[8] R. O. Schmidt, “Multiple emitter location and signal param-
eter estimation,” IEEE Transactions on Antennas and Propaga-
tion, vol. 34, no. 3, pp. 276–280, 1986.
[9] M. Wax, T. Shan, and T. Kailath, “Spatio-Temporal spectral
analysis by eigenstructure methods,” IEEE Transactions on
Acoustics, Speech, and Signal Processing, vol. 32, no. 4, pp. 817–
827, 1984.
[10] H. Wang and M. Kaveh, “Coherent signal-subspace processing
for detection and estimation of angles of arrival of multiple
wide-band sources,” IEEE Transactions on Acoustics, Speech,
and Signal Processing, vol. 33, no. 4, pp. 823–831, 1985.
[11] I. Hara, F. Asano, H. Asoh et al., “Robust speech interface
based on audio and video information fusion for humanoid
HRP-2,” in Proceedings of the IEEE/RSJ International Confer-
ence on Intelligent Robots and Systems (IROS ’04), pp. 2404–
2410, Sendai, Japan, October 2004.
[12] M. Walworth and A. Mahajan, “3D Position sensing using the
difference in the time-of-flights from a wave source to various
receivers,” in Proceedings of the International Conference on
Advanced Robotics (ICAR ’97), pp. 611–616, Monterey, Calif,
USA, July 1997.
[13] J M. Valin, F. Michaud, J. Rouat, and D. L
´
etourneau, “Robust
sound source localization using a microphone array on a
mobile robot,” in Proceedings of the IEEE/RSJ International
Conference on Intelligent Robots and Systems, pp. 1228–1233,
Maui, Hawaii, USA, October 2003.
[14] J M. Valin, F. Michaud, and J. Rouat, “Robust localization
and tracking of simultaneous moving sound sources using
beamforming and particle filtering,” Robotics and Autonomous
Systems, vol. 55, no. 3, pp. 216–228, 2007.
[15] A. P. Badali, J. M. Valin, and P. Aarabi, “Evaluating real-
time audio localization agorithms for artificial audition on
mobile robots,” in Proceedings of the IEEE/RSJ International
Conference on Intelligent Robots and Systems, pp. 2033–2038,
St. Louis, Mo, USA, 2009.
[16] K. Yao, R. E. Hudson, C. W. Reed, D. Chen, and F. Lorenzelli,
“Blind beamforming on a randomly distributed sensor array
system,” IEEE Journal on Selected Areas in Communications,
vol. 16, no. 8, pp. 1555–1566, 1998.
[17] N. Strobel and R. Rabenstein, “Classification of time delay
estimates for robust speaker localization,” in Proceedings of the
IEEE International Conference on Acoustics, Speech, and Signal
Processing (ICASSP ’99), vol. 6, pp. 3081–3084, March 1999.
14 EURASIP Journal on Advances in Signal Processing
[18] I. Potamitis, H. Chen, and G. Tremoulis, “Tracking of multiple
moving speakers with multiple microphone arrays,” IEEE
Transactions on Speech and Audio Processing,vol.12,no.5,pp.
520–529, 2004.
[19] J S. Hu, C C. Cheng, and W H. Liu, “Robust speaker’s
location detection in a vehicle environment using GMM
models,” IEEE Transactions on Systems, Man, and Cybernetics,
Part B, vol. 36, no. 2, pp. 403–412, 2006.
[20] A. Cantoni and P. Butler, “Properties of the eigenvectors of
persymmetric matrices with applications to communication
theory,” IEEE Transactions on Communications,vol.24,no.8,
pp. 804–809, 1976.
[21] M. Wax and T. Kailath, “Detection of signals by information
theoretic criteria,” IEEE Transactions on Acoustics, Speech, and
Signal Processing, vol. 33, no. 2, pp. 387–392, 1985.
[22] K. Yamamoto, F. Asano, W. F. G. Van Rooijen, E. Y. L. Ling, T.
Yamada, and N. Kitawaki, “Estimation of the number of sound
sources using support vector machine,” in Proceedings of the
IEEE International Conference on Accoustics, Speech, and Signal
Processing, pp. 485–488, Hong Kong, April 2003.
[23] J S. Hu, C H. Yang, and C K. Wang, “Estimation of
sound source number and directions under a multi-source
environment,” in Proceedings of the IEEE/RSJ International
Conference on Intelligent Robots and Systems (IROS ’09),pp.
181–186, St. Louis, Mo, USA, December 2009.
[24] M. H. Hayes, Statistical Digital Signal Processing and Modeling,
John Wiley & Sons, New York, NY, USA, 1996.
[25] J. Chen, J. Benesty, and Y. Huang, “Time delay estimation in
room acoustic environments: an overview,” EURASIP Journal
on Applied Signal Processing, vol. 2006, Article ID 26503, 19
pages, 2006.
[26] J. A. Hartigan and M. A. Wong, “A k-means clustering
algorithm,” Applied Statistics, vol. 28, pp. 100–108, 1979.
[27] D. Arthur and S. Vassilvitskii, “K-means++: the advantages
of careful seeding,” in Proceedings of the Annual ACM-SIAM
Symposium on Discrete Algorithms (SODA ’07), New Orleans,
La, USA, 2007.
[28] D. Bechler and K. Kroschel, “Considering the second peak
in the GCC function for multi-Source TDOA estimation
with a microphone array,” in Proceedings of t he International
Workshop on Acoustic Echo and Noise Control (IWAENC ’03),
pp. 315–318, Kyoto, Japan, September, 2003.
[29] T. Pham and B. M. Sadler, “Adaptive wideband aeroacoustic
array processing,” in Proceedings of the IEEE Signal Processing
Workshop on Statistical Signal and Array Processing, pp. 295–
298, Corfu, Greece, June 1996.