Báo cáo hóa học: " Micro-Raman Mapping of 3C-SiC Thin Films Grown by Solid–Gas Phase Epitaxy on Si (111)" docx
Bạn đang xem bản rút gọn của tài liệu. Xem và tải ngay bản đầy đủ của tài liệu tại đây (299.89 KB, 5 trang )
NANO EXPRESS
Micro-Raman Mapping of 3C-SiC Thin Films Grown
by Solid–Gas Phase Epitaxy on Si (111)
T. S. Perova
•
J. Wasyluk
•
S. A. Kukushkin
•
A. V. Osipov
•
N. A. Feoktistov
•
S. A. Grudinkin
Received: 5 May 2010 / Accepted: 7 June 2010 /Published online: 20 June 2010
Ó The Author(s) 2010. This article is published with open access at Springerlink.com
Abstract A series of 3C-SiC films have been grown by a
novel method of solid–gas phase epitaxy and studied by
Raman scattering and scanning electron microscopy
(SEM). It is shown that during the epitaxial growth in an
atmosphere of CO, 3C-SiC films of high crystalline quality,
with a thickness of 20 nm up to few hundreds nanometers
can be formed on a (111) Si wafer, with a simultaneous
growth of voids in the silicon substrate under the SiC film.
The presence of these voids has been confirmed by SEM
and micro-Raman line-mapping experiments. A significant
enhancement of the Raman signal was observed in SiC
films grown above the voids, and the mechanisms
responsible for this enhancement are discussed.
Keywords 3C-SiC Á Voids in SiC Á
Micro-Raman spectroscopy Á Micro-Raman mapping
Introduction
Silicon carbide (SiC) is a very attractive material for the
fabrication of microelectronic and optoelectronic devices
due to its wide bandgap, high thermal conductivity,
excellent thermal and chemical stability and its resistance
to radiation damage and electrical breakdown [1]. SiC has
over 170 different polytypes [2]. The most common forms
are 4H, 6H, known as the hexagonal (a-SiC) types, and the
cubic 3C-SiC type [2–5]. Among the various polytypes, the
3C-SiC variety possesses unique properties, including a
high electron mobility up to 1000 cm
2
/Vs and a consequent
high saturation drift velocity. 3C-SiC can be used as a
buffer layer for the subsequent heteroepitaxial growth of
gallium nitride and other group III-nitrides [6]. Because of
the small lattice mismatch between SiC and gallium nitride
(GaN), 6H-SiC can also act as a substrate for the epitaxial
growth of GaN [7], which has application in blue and violet
light-emitting diodes and lasers. Therefore, reproducible
growth of SiC on silicon wafers is a very important issue
for the semiconductor and MEMS industry.
The theoretical and experimental basis for a new method
of solid–gas phase epitaxy of different polytypes of SiC on
Si has been demonstrated recently in Refs. [8, 9]. The
essence of the approach is that during SiC seed formation,
simultaneous growth of pores, or voids, from the vacancies
occurs (see Fig. 1b). These voids provide an optimum
relaxation of elastic strain and, in this case, misfit dislo-
cations are not formed, in contrast to traditional techniques
using a mixture of gases. The voids typically have an
inverted pyramid or rectangular shape when using (111) Si
or (100) Si, respectively. Formation of voids, visible using
SEM and TEM methods, at the initial stage of SiC film
growth on Si substrates has already been discussed in the
literature [10–13]. The formation of voids discussed in the
present investigation is different, since the voids formed
are not hollow (see Fig. 1a), but filled with a type of SiC
material attached to the Si (110) and (-211) planes inside
the voids. Micro-Raman mapping experiments were used
in this study for the first time, in order to investigate the
T. S. Perova (&) Á J. Wasyluk
Department of Electronic and Electrical Engineering, University
of Dublin, Trinity College, Dublin 2, Ireland
e-mail:
S. A. Kukushkin Á A. V. Osipov
Institute of Problems of Mechanical Engineering, Russian
Academy of Sciences IPME RAS, Bolshoy 61, V.O.,
199178 St. Petersburg, Russia
N. A. Feoktistov Á S. A. Grudinkin
Ioffe Physical Technical Institute, Polytechnicheskaya ul.,
26, 194021 St. Petersburg, Russia
123
Nanoscale Res Lett (2010) 5:1507–1511
DOI 10.1007/s11671-010-9670-6
structural properties of the SiC film grown on the Si sub-
strate and also on top of the voids.
Experimental
A low-pressure CVD system with a vertical cold-wall
reactor made from sapphire, with a diameter of 40 mm and
length of 50 mm, in which the central zone was heated,
was used for SiC film deposition. The silicon wafer was
placed on a graphite holder, with a thermocouple attached
to the end. The sapphire tube was connected to a high
vacuum system, consisting of diffusion and turbo-molec-
ular pumps. Initially, the system was pumped down to a
pressure of 10
-5
–10
-6
Torr. For SiC deposition, a 2
0
(111)-
orientated Si substrate with a thickness of 300 lm and a tilt
of 4° was used. Growth of SiC films on Si(111) was
achieved using the chemical reaction of monocrystalline
silicon and CO gas, supplied at a rate of 1–10 ncm
3
/min
and a pressure of 0.1–10 Torr. Growth occurs in the tem-
perature range 1100–1350°C, and growth durations of 10–
60 min were used. Due to the fabrication procedure, the
SiC samples obtained are mainly lightly doped with
nitrogen at a level of 10
14
cm
-3
.
Raman spectroscopy is a powerful technique for the
characterisation of SiC structures in particular, since it
allows the identification of various polytypes [2–5]. The
Raman efficiency of SiC is sufficiently high because of the
strong covalent bonds in the material. In addition, Raman
spectral parameters such as peak position, intensity, line-
width and polarisation provide useful information on the
crystal quality [14]. Raman spectra were registered in a
backscattering geometry using a RENISHAW 1000 micro-
Raman system equipped with a CCD camera and a Leica
microscope. Two types of measurements were performed:
single-spot measurements from both a void area and
outside the void area in the SiC layers, and line-mapping
measurements conducted along the voids with nanoscale
depth profile of the void varied from 30 nm up to 2000 nm
(at the centre of void). For single measurements, an
Ar
?
laser at 457 nm with a power of 10 mW was used as
the excitation source, while for line mapping an excitation
wavelength of 633 nm from a HeNe laser with a laser
power of 10 mW was used. Line mapping was performed
at a distance, x, ranging from 0 to 13 lm with an in-plane
step size of 300 nm, where zero corresponds to the starting
point of the measurements. Laser radiation was focused
onto the sample using a 1009 microscope objective with a
short-focus working distance, providing a spot size of
*600 nm. Cross-sectional morphologies of the SiC films
were characterised with a Tescan Mira SEM.
Results and Discussions
Figure 2 shows a representative Raman spectra from a SiC
film on Si (111) measured at the void and outside the void.
The feature seen in the range 900–1100 cm
-1
is associated
with second-order Raman scattering from the Si [15]. The
characteristic transverse optical (TO) and longitudinal
optical (LO) phonon modes are observed at *794 cm
-1
and *968 cm
-1
, respectively. This confirms that the SiC
layers analysed in this work mainly consist of a cubic
polytype structure [5, 16]. A low intensity shoulder, clearly
observed at *764 cm
-1
near the TO band, indicates the
presence of a small amount of the 6H-SiC polytype in this
SiC layer. From Fig. 2a and b, the TO peak at 794 cm
-1
demonstrates asymmetry from the low-frequency side. At
the same time, in accordance with Nakashima [5], struc-
tural disorder in the SiC leads to a symmetrical widening of
all the TO peaks. We conclude that the observed asym-
metry of the TO peak is due to the presence of a 6H-SiC
SiC
SiO
CO
SiO
Si
Si
Si
SiC
SiC
CO SiO
VOIDS
a
b
CO
Fig. 1 a SEM image of sample
SiC/(111)Si and b schematic
model of void formation during
SiC growth
1508 Nanoscale Res Lett (2010) 5:1507–1511
123
peak at *789 cm
-1
, clearly demonstrated by fitting of the
TO band in Fig. 2b. From the fit, the linewidth of the band
at *794 cm
-1
is approximately *7.8 cm
-1
. This is
2.5 cm
-1
larger than that for relaxed 3C-SiC on a 6H-SiC
substrate in Ref. [17]. This relatively small difference in
linewidth leads to the conclusion that the thin SiC layer
grown on Si (111) has reasonably good crystalline quality;
this was confirmed by energy dispersive X-ray analysis in
Ref. [17].
A large enhancement of the Raman peak intensity, by up
to 40 times for some samples, for both TO and LO modes,
is observed at the void area. This enhancement enables the
acquisition of a reasonably good Raman spectrum from
ultra-thin SiC layers, as shown in Fig. 2a. Three mecha-
nisms can contribute to the observed enhancement of
Raman signal: (a) multiple reflection of the incident light
inside the void, (b) multiple reflection of the Raman signal
in the SiC layer on top of the void and (c) the presence of
additional SiC material grown on the (110) Si ribs of the
pyramid inside the voids [9, 10, 18]. The first mechanism is
also responsible for the moderate enhancement of the Si
second-order peak, by approximately 4 times, from the Si
ribs. A somewhat similar effect was discussed for porous
Si and SiC in Refs. [19, 20]. For the second mechanism, the
enhancement of the Raman signal in thin films, surrounded
by media with low refractive indices, was discussed
recently in Ref. [21] for graphene. We use a similar
approach for the estimation of the effect of multiple
reflections of the Raman signal on the peak intensity from
the thin film using a three-layer model consisting of
SiC–air–silicon. This model will be discussed together with
the line-mapping results in the next paragraph.
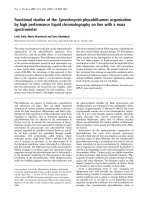
Figure 3a presents an optical microscopy image of a
3C-SiC/Si sample, where the brighter dots correspond to
the voids seen under thin SiC layers. The arrow on Fig. 3a
shows the route of the line-mapping measurements. The
Raman mapping was performed at the different depth of
the void varied from 30 nm up to 2000 nm (correspondent
to the centre of the void). Figure 3b, c and d show Raman
line-maps for the peak position, peak intensity and
linewidth of the SiC-TO peak along the voids for the
3C-SiC/Si sample. Note that not all the points, collected
during mapping experiment, are shown in these figures for
the clarity of presentation. Since the TO peak position is
more sensitive to the stress relaxation effect [19], the TO-
SiC peak was used to study the relaxation level in 3C-SiC
films with different thicknesses and void size. The peak
position of the SiC-TO band in a relaxed 3C-SiC structure
is typically located at 796 cm
-1
, but for SiC layers grown
on Si, the TO band shifts to the low-frequency side [16].
We observed the TO-SiC peak position at around
794 cm
-1
, indicating that the SiC layer is under stress.
Tensile stress in the SiC layer is observed since the lattice
constant for SiC (a
SiC
= 4.3 A
˚
) is less than that for Si
(a
Si
= 5.38 A
˚
). Figure 3b presents the peak position of the
TO-SiC peak as a function of distance, x. From this figure,
the peak position varies from 794.5 cm
-1
at the middle of
the void to 793.5 cm
-1
outside the voids. A larger tensile
stress is observed outside the voids than at voids, con-
firming that stress relief is occurring at the cavities. Fig-
ure 3d shows the full width at half maximum (FWHM) of
the SiC-TO mode as a function of mapping distance. The
linewidth of the TO peak significantly increases at the
cavities (by *3cm
-1
), a result of the contribution of
differently oriented SiC materials inside the void as
mentioned earlier.
The strong enhancement of the Raman peak intensity of
the SiC-TO mode, by a factor of 20, inside the cavities is
confirmed by the line-mapping measurements presented in
Fig. 3c. It can be seen that the enhancement is significantly
larger at the centre of the voids, corresponding to a larger
cavity depth or a thicker air layer (see Fig. 1). By con-
sidering the multiple reflection of the Raman signal based
on Fresnel’s equation [21], and by varying the thickness of
the air layer from 0 to 2000 nm and the thickness of the
SiC layer between 0 and 800 nm, we estimated the Raman
enhancement at the centre of the void to be approximately
10 times larger than that at the edge of the void for a SiC
layer with a thickness of about 120 nm (details of these
calculations will be published elsewhere [22]). An increase
0
50
100
150
200
250
TO 6H-SiC
(~794)
LO SiC
(~968)
Si 2nd order
(~970)
Raman Intensity, a. u.
Raman shift, cm
-1
from a void
out of void
TO SiC
(~794)
700 800 900 1000 1100
740 760 780 800 820 840
TO (E
1
) 6H-SiC
~764.4
TO (2E
2
) 6H-SiC
~789.4
Raman Intensity, a. u.
Raman shift, cm
-1
exp. data
fitting
fitting components
TO 3C-SiC
~794.3
a b
Fig. 2 a Raman spectra from
SiC layer grown on Si substrate
measured at the void area and
outside the void area. b Fitting
of TO band from Raman
spectrum, detected at the void,
with three functions
(Lorentzian ? Gaussian)
Nanoscale Res Lett (2010) 5:1507–1511 1509
123
in the layer thickness to 800 nm reduces the Raman signal
enhancement by a factor of * 5. This was confirmed
experimentally by Raman line-mapping measurements for
the sample with an *800-nm-thick SiC layer, where
enhancement of the Raman signal by a factor of only two
was detected at the void centre.
Conclusion
In summary, the presence of voids during the growth of
thin SiC layers by solid–gas phase epitaxy has been
confirmed experimentally by scanning electron micros-
copy and micro-Raman spectroscopy. The Raman line-
mapping experiments presented in this work confirm that
the voids formed in the Si substrate under the SiC layer
cause relaxation of the elastic stress caused by lattice
mismatch between the SiC and Si. It is shown that the SiC
layers investigated here are composed mainly of the cubic
polytype of SiC, with small amounts of 6H-SiC. It is
worth mentioning that in accordance with Ref. [23], the
quality of GaN layers grown on SiC layers consisting of a
mixture of the cubic and hexagonal polytype is better than
that for GaN layers grown on a single SiC polytype. A
strong enhancement in the peak intensity of the TO and
LO modes is observed for the Raman signal measured at
the voids.
Acknowledgments J. Wasyluk would like to acknowledge the
financial support of the IRCSET Ireland (Postgraduate Award) and
ICGEE Programme. The study has been performed with financial
support from the Russian Foundation for Fundamental Research
(grants 07-08-00542, 09-03-00596 and 08-08-12116-ofi) and the RAS
Program: «Basis of Fundamental Research in Nanotechnologies and
Nanomaterials». S. Dyakov is acknowledged for performing the
calculation of Raman enhancement.
Open Access This article is distributed under the terms of the
Creative Commons Attribution Noncommercial License which per-
mits any noncommercial use, distribution, and reproduction in any
medium, provided the original author(s) and source are credited.
References
1. O. Kordina, L.O. Bjo
¨
rketun, A. Herry, C. Hallin, R.C. Glass,
L. Hultman, J.E. Sundgren, E. Janzen, J. Cryst. Growth 154, 303
(1995)
2. M.J. Pelletier, Analytical applications of Raman spectroscopy
(Blackwell Science, UK, 1999)
3. S. Nakashima, K. Tahara, Phys. Rev. B 40, 6339 (1989)
4. S. Nakashima, H. Harima, T. Tomita, T. Suemoto, Phys.Rev. B
62, 16605 (2000)
5. S. Nakashima, H. Harima, Phys. Stat. Sol. A 162, 39 (1997)
6. T. Takeuchi, H. Amano, K. Hiramatsu, N. Sawaki, I. Akasaki, J.
Cryst. Growth 115, 634 (1991)
7. A.S. Zubrilov, Yu.V. Melnik, A.E. Nikolaev, Semiconductors 33,
1067 (1999)
8. S.A. Kukushkin, A.V. Osipov, N.A. Feoktistov, Patent RF No
2008102398, filed on 22 January (2008)
9. S.A. Kukushkin, A.V. Osipov, Phys. Solid State 50, 1238 (2008)
7
8
9
10
11
12
Linewidth, cm
-1
Distance, µm
793.2
793.6
794.0
794.4
Peak Position, cm
-1
X
(0,0) (13,0)
024681012
024681012
0
20
40
60
80
100
120
140
Raman Intensity, a. u.
Distance x, µm
024681012
Distance x, µm
ab
dc
Fig. 3 a Top view of the sample of 3C-SiC obtained by optical
microscopy (scale in lm), the red arrow shows the mapping line.
Results of Raman line mapping for b peak position, c linewidth and
d peak intensity of the TO phonon mode for the 3C-SiC/Si sample
(dashed lines correspond to the centres of the voids)
1510 Nanoscale Res Lett (2010) 5:1507–1511
123
10. R. Scholz, U. Go
¨
sele, E. Niemann, F. Wischmeyer, Appl. Phys. A
64, 115 (1997)
11. A. Severino, G. D’Arrigo, C. Bongiorno, S. Scalese, F. La Via,
G. Foti, J.Appl. Phys. 102, 023518 (2007)
12. J.P. Li, A.J. Steckl, J. Electrochem. Soc. 142, 2 (1995)
13. W. Attenberger, J. Lindner, V. Cimalla, J. Pezoldt, Mater. Sci.
Eng. B 61/62, 544 (1999)
14. W.J. Choyke, H. Matsunami, G. Pensl, V.I. Taylor, Francis,
Silicon Carbide—A review of fundamental questions and appli-
cations to current device technology, (1997)
15. P.A. Temple, C.E. Hathaway, Phys. Rev. B 7, 3685 (1973)
16. Z.C. Feng, W.J. Choyke, J.A. Powell, J. Appl. Phys. 64, 6827
(1988)
17. J. Wasyluk, T.S. Perova, S.A. Kukushkin, A.V. Osipov, N.A.
Feoktistov, S.A. Grudinkin, Mater. Sci. Forum 645–648, 359
(2010)
18. L.M. Sorokin, N.V. Veselov, M.P. Shcheglov, A.E. Kalmykov,
A.A. Sitnikova, N.A. Feoktistov, A.V. Osipov, S.A. Kukushkin,
Techn. Phys. Let. 34, 992 (2008)
19. V. Lysenko, D. Barbier, B. Champagnon, Appl. Phys.Lett. 79,
2366 (2001)
20. I. Gregora, B. Champagnon, L. Saviot, Y. Monin, Thin Solid
Film 255, 139 (1995)
21. Y.Y. Wang, Z.H. Ni, Z.X. Shen, H.M. Wang, Y.H. Wu, Appl.
Phys. Lett. 92, 043121 (2008)
22. S. Dyakov, J. Wasyluk, T.S. Perova, (in preparation)
23. I.G. Aksyanov, V.N. Bessolov, Yu.V. Zhilyaev, M.E. Kompan,
E.V. Konenkova, S.A. Kukushkin, A.V. Osipov, N.A. Feoktistov,
Sh. Sharofidinov, M.P. Shcheglov, Semiconductors (submitted
for publication)
Nanoscale Res Lett (2010) 5:1507–1511 1511
123