Báo cáo hóa học: " Characterisation and Skin Distribution of Lecithin-Based Coenzyme Q10-Loaded Lipid Nanocapsules" ppt
Bạn đang xem bản rút gọn của tài liệu. Xem và tải ngay bản đầy đủ của tài liệu tại đây (996.09 KB, 9 trang )
NANO EXPRESS
Characterisation and Skin Distribution of Lecithin-Based
Coenzyme Q10-Loaded Lipid Nanocapsules
Huafeng Zhou
•
Yang Yue
•
Guanlan Liu
•
Yan Li
•
Jing Zhang
•
Zemin Yan
•
Mingxing Duan
Received: 10 March 2010 / Accepted: 29 June 2010 / Published online: 20 July 2010
Ó The Author(s) 2010. This article is published with open access at Springerlink.com
Abstract The purpose of this study was to investigate the
influence of the inner lipid ratio on the physicochemical
properties and skin targeting of surfactant-free lecithin-
based coenzyme Q10-loaded lipid nanocapsules (CoQ10-
LNCs). The smaller particle size of CoQ10-LNCs was
achieved by high pressure and a lower ratio of CoQ10/
GTCC (Caprylic/capric triglyceride); however, the zeta
potential of CoQ10-LNCs was above /- 60 mV/ with no
distinct difference among them at different ratios of
CoQ10/GTCC. Both the crystallisation point and the index
decreased with the decreasing ratio of CoQ10/GTCC and
smaller particle size; interestingly, the supercooled state of
CoQ10-LNCs was observed at particle size below about
200 nm, as verified by differential scanning calorimetry
(DSC) in one heating–cooling cycle. The lecithin mono-
layer sphere structure of CoQ10-LNCs was investigated by
cryogenic transmission electron microscopy (Cryo-TEM).
The skin penetration results revealed that the distribution of
Nile red-loaded CoQ10-LNCs depended on the ratio of
inner CoQ10/GTCC; moreover, epidermal targeting and
superficial dermal targeting were achieved by the CoQ10-
LNCs application. The highest fluorescence response was
observed at a ratio of inner CoQ10/GTCC of 1:1. These
observations suggest that lecithin-based LNCs could be
used as a promising topical delivery vehicle for lipophilic
compounds.
Keywords Coenzyme Q10 Á Cryo-TEM Á DSC Á
Topical delivery Á Lipid nanocapsules
Introduction
Coenzyme Q10 (CoQ10), a vitamin-like substance with a
yellow-coloured crystalline powder form and the melting
point of 49°C, is widely biosynthesised in living organisms
such as plants and animals [1]. It has been found in vir-
tually all cells of the human body, including the heart, liver
and skeletal muscles [2]. Initially, it became a popular
supplement due to participation in two major physiological
activities: as a mitochondrial electron-transporter in the
high-energy metabolic pathways of liver cells and other
cells of the body and as an antioxidant against free radicals
and lipid peroxidation [3–5]. Recently, CoQ10, as a cuta-
neous antioxidant and energiser, had been demonstrated to
prevent photoaging in topical application. It not only
penetrates into the viable epidermis and reduces the level
of oxidation and wrinkle depth but also reduces the detri-
mental effects of ultraviolet A (UVA) on dermal fibro-
blasts, which maintain the dermal matrix. To be able to act
as a cutaneous antioxidant and energiser, CoQ10 needs to
penetrate into the above living layers [6, 7].
However, stratum corneum acts as an effective barrier
to many compounds [8, 9]. Regarding the skin barrier,
several delivery carriers, such as solid lipid nanoparticles
(SLN) [10–12], nanostructured lipid carriers (NLC)
[13–15], nanoemulsions (NE) [16, 17], microemulsions
[18, 19], liposomes [20, 21] and niosomes [22, 23], have
been developed and focused on drug absorption and tar-
geting. NLC formulation has been proven to be a suitable
colloidal carrier for epidermal targeting, and the degree of
H. Zhou Á Y. Yue Á G. Liu Á Y. Li Á J. Zhang Á M. Duan (&)
State-key Laboratory of Biomembrane and Membrane
Biotechnology, School of Life Sciences, Tsinghua University,
100084 Beijing, China
e-mail:
H. Zhou Á Z. Yan
Jiangsu Longliqi Bioscience Co., Ltd., 215555 Suzhou, China
e-mail:
123
Nanoscale Res Lett (2010) 5:1561–1569
DOI 10.1007/s11671-010-9677-z
epidermal targeting depended on the oil content and the
occlusion factor [24]. It was reported that, following SLN
dispersion, dye penetration increased by about fourfold
over the uptake obtained following cream application.
NLC proved to be less potent (less than threefold
increase), and penetration even appeared reduced when
applying an NE [25]. Podophyllotoxin-loaded SLN, sta-
bilised by 1.5% soybean lecithin and 0.5% poloxamer 188,
provided a good epidermal targeting effect [26]. Interest-
ingly, lecithin microemulsion has shown the highest
deposition of fluorescent dye in the dermis layer as the
time of treatment increased due to the presence of lecithin
[27], but has shown no significant difference in the epi-
dermis layer. Recently, lipid nanocapsules, a medium-
chain triglyceride core surrounded by a membrane made
from a mixture of lecithin and a PEGylated surfactant,
were invented based on the above delivery carrier systems
as an intravenous delivery system for application of lipo-
philic drugs. The lipid nanocapsules were prepared by
phase-inversion temperature method. The selection of
surfactant and the preparation temperature were the key
factors and were difficult to control. The relative amount
of surfactant to lipid core content had potential cytotox-
icity. However, tissue targeting of lipid nanocapsules was
investigated [28–33].
In this study, aimed to establish a delivery system that
can target CoQ10 to the dermis layer and the epidermis
layer, surfactant-free CoQ10-loaded lipid nanocapsules
(CoQ10-LNCs), composed of the lamellar shell of lecithin
and an inner lipid core of CoQ10 and GTCC, were
developed by high-pressure homogenisation at a high
temperature. Varying ratio of CoQ10/GTCC, CoQ10-LNC
physicochemical properties, particle size and zeta potential,
degree of crystallisation and micromorphology structure
were investigated. Furthermore, targeting of CoQ10-LNCs
was determined on rat skin in vivo using Nile red as the
fluorescence model.
Materials and Method
Materials
Soybean lecithin was purchased from Cargill Texturizing
Solutions Deutschland GmbH & Co. KG. (Germany),
CoQ10 was purchased from Zhejiang Medicine Co. Ltd.,
Xinchang Pharmaceutical Factory (China), Nile red (NR)
was obtained from Sigma–Aldrich (USA). 2-Propanol and
optimal cutting temperature compound (OCT) were pur-
chased from Leica Microsystem (Germany). Caprylic/
capric triglyceride (GTCC) was provided by Croda Co.
Ltd. (UK).Glycerol, ethane and hexane were reagent
grade.
Preparation of CoQ10-Loaded Lipid Nanocapsules
CoQ10-LNCs were prepared according to the process
described by Huynh et al. [28], including several changes.
The content of CoQ10 was varied from 100% (w/w) to 0%
(w/w) in the lipid (CoQ10 and GTCC), and the amount of
lipid (CoQ10 and GTCC) was kept at a fixed concentration
of 12.5% (w/w) with regard to the total mass of 100 g.
Briefly, CoQ10 and GTCC were mixed at 60°C, and then
5% (w/w) lecithin was dissolved into. Next, the above
liquid lipid phase was dispersed in 82.5% (w/w) glycerol
aqueous solution (glycerol concentration was 40% (w/w))
at 60°C and emulsified by a stirrer at 1500 rpm for 1 min.
Lastly, the resulting pre-emulsion was homogenised by
high-pressure homogenisation (HPH, NS1001L, Niro
Soavi, Italy) at 60°C for 3 cycles at 300 bar, 600 bar and
1000 bar, respectively. The resulting dispersion was cooled
at ambient conditions to room temperature to obtain the
CoQ10-LNCs.
Particle Size Analysis
The mean particle size (MPZ) was analysed by photon
correlation spectroscopy (PCS) using a Malvern Zetasizer
2000 (Malvern Instruments, UK). The MPZ was obtained
by averaging three measurements at an angle of 90° in 1-
cm diameter cells at 25°C. All of the samples were diluted
with distilled water about 50 times.
Zeta Potential Analysis
Malvern Zetasizer 2000 was used to measure the zeta
potential (ZP) of CoQ10-LNCs. The value of ZP was
obtained by averaging three measurements at 25°C. All
the samples were diluted with distilled water about 200
times.
Differential Scanning Calorimetry
Differential scanning calorimetry (DSC) was measured on
a DSC Q2000 apparatus (TA Instruments, USA). About
10 mg of each sample was sealed in a 40-ll aluminium
pan. Heating was performed from -60°Cto60°Cata
heating rate of 5
°C/min, and cooling was performed from
60°Cto-60°C at a cooling rate of 5°C/min. An empty
aluminium pan was used as a reference. The crystalline
index (CI [%]) was calculated by applying the following
equation:
CI½%¼
DH
LNCs
DH
Bulk material
 Concentration
Lipid
 100 ð1Þ
where, DH represents the melting enthalpy (J/g).
1562 Nanoscale Res Lett (2010) 5:1561–1569
123
Cryogenic Transmission Electron Microscopy
(Cryo-TEM)
In this experiment, all the samples were diluted with dis-
tilled water about five times. For Cryo-TEM, 4 llof
sample were applied onto a perforated carbon film grid
(R1.2/1.3 Quantifoil Micro Tools GmbH, Jena, Germany)
and were blotted by filter paper (Whatman 1 l) for about
3 s. After blotting, the grid was immediately plunged into
pre-cooled liquid ethane for flash freezing. The Cryo-grid
was held in a Gatan 626 cryo-holder (Gatan, USA) and
transferred into TEM (JEOL JEM-2010 with 200 kV LaB6
filament) at -172°C. The sample was observed under
minimal dose condition at -172°C. The micrographs were
recorded by a Gatan 832 CCD camera at a magnification of
10,000–50,000 9 and at a defocus of 3–5.46 lm.
Skin Permeation Studies in vivo
Treatment of Animals
Fifteen ten-week-old female SD rats (200–250 g, Vitalriver
Inc., Beijing, China), in similar development stages, were
selected as the animal model. They were anaesthetised by a
suitable dose of barbital sodium throughout the entire
experiment. The fur on the abdominal area of the rats was
carefully removed by an electrical shaver to avoid damage
to their stratum corneum. The furless abdominal area was
used for in vivo transport studies.
Transport Studies
For each set of experiments, 50 mg of sample was well
distributed on the hairless abdominal skin area of approx-
imately 3.14 cm
2
. At a fixed time after application, surplus
sample was removed from the skin surface, and the skin
surface was washed three times with PBS and dried gently
under cold wind with an electric hair drier. A
0.5 cm 9 0.5 cm skin piece was cut out from the treated
area, embedded in OCT and frozen rapidly by liquid
nitrogen. The specimen, taken out from liquid nitrogen,
was frozen on a metal block. The metal block was then
transferred into a cryostat microtome (LE ICACM 1850,
Germany) for slicing the vertical cross-sections of skin.
Twelve vertical skin sections with a thickness of 25 lm
were obtained and stored at 4°C until microscopy analysis.
Fluorescent Microscopy
Skin sections were subjected to fluorescent microscopy
using an Olympus CK40 microscope (Olympus, Japan)
equipped with a UV source and a filter for fluorescent
measurement. Image capture and analysis were carried out
by Image-pro plus software (Media Cybernetics, USA).
The excitation and emission wavelengths were 549 and
628 nm for NR. We selected green light and red light as
excitation and emission ranges, respectively. Images were
recorded by setting the camera integration time to 1/1.8 s.
The same parameters were used for imaging all samples.
Fluorescence intensity values were quantified using Image-
pro plus software.
Data Analysis
All the data tests were repeated three times and expressed
as the mean ± SD. The statistical data were analysed by
t-test analysis via Origin 7.0; p \ 0.01 was considered to
be statistically significant.
Results and Discussion
Particle Size and Zeta Potential of CoQ10-LNCs
Table 1 shows the MPZ of CoQ10-LNCs evaluated by
Zetasizer 2000 after production at different homogenisa-
tion pressures. At the homogenisation pressure of 300 bar,
MPZ of CoQ10-LNCs was in the range of 290–420 nm;
when the pressure reached 600 bar, the MPZ of CoQ10-
LNCs was between 200 and 140 nm; when the pressure
was raised to 1000 bar, the MPZ of CoQ10-LNCs was
from 100 to 70 nm. MPZ of CoQ10-LNCs declined with
decreasing CoQ10 content in the lipid phase. Several fac-
tors, e.g., type and concentration of lipids and surfactants
[34], the viscosity of the lipid phase [24] and homogeni-
sation pressure and cycle time [35], affected the mean
particle size of LNCs. During the production process of
CoQ10-loaded LNCs, the lipid phase was heated up to
60°C and the viscosity of the lipid phase, dependent on the
content of CoQ10, declined with decreasing concentration
of CoQ10, similarly to previously described evaluation
[36].
The zeta potential characterises the surface charge of the
particles, gives information about repulsive forces between
particles or droplets and makes a prediction about the
stability of colloid dispersions. An absolute value above
30 mV usually indicates good stability of the colloid dis-
persion [37]. The ZP of the CoQ10-LNCs is shown in
Table 2. All developed LNCs displayed a negative charge,
and the highest ZP value was above -60 mV, indicating
good physical stability of LNCs (data not shown). The
CoQ10-loaded LNCs displayed similar ZP values (-64.5,
-66.2, -65.3 and -65.5 mV for different CoQ10 load-
ings) with no significant difference, while the LNCs free of
CoQ10 had a lower ZP value (-62.2 mV). However, the
LNCs free of lipid phase had the lowest ZP value of about
Nanoscale Res Lett (2010) 5:1561–1569 1563
123
-49.2 mV (data not shown). Because GTCC has carbox-
ylic groups with negative charges and CoQ10 possesses
carbonyl groups and a double-bond group with negative
charges, when the lipid CoQ10 and GTCC were incorpo-
rated into the LNCs, CoQ10-loaded LNCs demonstrated
higher ZP value.
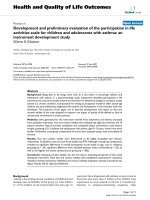
DSC Investigation
Figure 1 shows the DSC curves of CoQ10, GTCC and
CoQ10-LNCs recorded from -60°Cto60°C at a heating
rate of 5°C/min and cooled from 60°Cto-60°C at a rate of
5°C/min. Table 3 shows the DSC parameters of the above
developed sample. Compared to bulk CoQ10, the CoQ10-
LNC dispersions without any homogenisation process
showed a melting peak indicating a solid state. Both melting
point and CI of CoQ10 in the formulation decreased with
decreasing ratio CoQ10/GTCC from 100% CoQ10 to 25%
CoQ10; conversely, the peaks broadened. The melting point
of CoQ10 decreased from 48.11°C (CoQ10-NLCs-100-
0 bar) to 34.41°C (CoQ10-NLCs-25-0 bar), and CI%
declined from 95.77 to 68.91% due to the addition of liquid
GTCC. Furthermore, the CoQ10-loaded LNC dispersions
(290–420 nm), homogenisation at 300 bar for 3 cycles,
showed a weak peak, and the melting point of CoQ10
decreased by slightly less than 1°C in the formulation with
the same component, but the CI% greatly decreased (from
95.77 to 1.94%, from 85.06 to 2.24%, from 77.56 to 2.52%
and from 68.91 to 2.78% for different formulations).
However, when the homogenisation pressure reached
600 bar, resulting in a smaller size of 200–140 nm, the
melting point of CoQ10 was absent from the heating DSC
curves, indicating no heating enthalpy change and a high
likelihood of a supercooled state. The decrease of melting
point and CI and the presence of supercooled state were
explained by the effect of the nanometre particle size with
higher specific surface area. Attributed to the Kelvin effect
described by the Thomson equation [38–40], the nanosize
effect delays or avoids the recrystallisation of CoQ10
matrix. Additionally, the decrease of the melting point is
also affect by surfactants [39]. From the above results, it
was determined that CoQ10 loaded in the LNCs was likely
in the supercooled state when the particle size of CoQ10-
LNCs reached or dropped below 200 nm.
Compared to bulk GTCC, the formulations without any
homogenisation showed a melting peak. Both melting point
and CI of GTCC in the formulation decreased with
decreasing concentration of GTCC. When the homogeni-
sation pressure was 300 bars, the melting point of GTCC
decreased by large amounts for changes in the formulation
with the same composition, excluded the formulation
CoQ10-LNCs-75 (25% GTCC). The same phenomena were
observed at 600 bars. However, the melting point of GTCC
is absent in the formulation CoQ10-LNCs-75. Interestingly,
when the homogenisation pressure was 1000 bar, the DSC
parameters were similar to the ones at 600 bars.
On the cooling curves, without any homogenisation
pressure, the crystallisation point of GTCC declined from
-44.34 (100% GTCC) to -49.9°C (75% GTCC). When
the concentration of GTCC decreased to 50%, the crys-
tallisation point decreased to below -60°C, the possible
reason being that CoQ10 molecule entered into the struc-
ture of GTCC and disturbed the ordered structure of GTCC
[41]. When the concentration of CoQ10 increased to 25%,
one broadened crystallisation peak at about -35°C was
present on the cooling curves, possibly representing the
co-melting complex of GTCC/CoQ10. When the concen-
tration of CoQ10 increased to 50%, one narrow crystalli-
sation peak (-30.89°C) and two weak crystallisation peaks
(-22.75 and -10.08°C) were present. When the concen-
tration of CoQ10 increased to 75%, one relatively narrow
crystallisation peak (-31.21°C) and one broadened strong
peak (-9.28°C) was shown on the cooling curves. Com-
pared to pure CoQ10 (0% GTCC), the depression of the
crystallisation point of CoQ10 may be explained by the
Table 1 Mean particle size
(MPZ) of CoQ10-LNCs after
being produced for three cycles
at 300 bar/600 bar/1000 bar,
respectively (n = 3)
Formulation Lipid content MPZ (nm)
CoQ10 (w/w %) GTCC (w/w %) 300 bar 600 bar 1000 bar
CoQ10-LNCs-100 100 0 414 ± 15 192 ± 398± 6
CoQ10-LNCs-75 75 25 343 ± 16 181 ± 682± 8
CoQ10-LNCs-50 50 50 313 ± 9 174 ± 278± 5
CoQ10-LNCs-25 25 75 317 ± 4 175 ± 976± 3
CoQ10-LNCs-0 0 100 298 ± 2 141 ± 471± 11
Table 2 Zeta potential (ZP) of CoQ10-LNCs analysed by Zetasizer
2000 after being homogenised at 1000 bar for three cycles (n = 3)
Formulation ZP (mV)
CoQ10-LNCs-100 -64.5 ± 0.8
CoQ10-LNCs-75 -66.2 ± 1.1
CoQ10-LNCs-50 -65.3 ± 0.5
CoQ10-LNCs-25 -65.5 ± 1.8
CoQ10-LNCs-0 -62.2 ± 1.2
1564 Nanoscale Res Lett (2010) 5:1561–1569
123
GTCC molecule entering into the structure of CoQ10
resulted in less ordered crystal structure of CoQ10 during
the cooling process [10], delaying the crystallisation point.
However, after high-pressure homogenisation (above 300
bar), the crystallisation peaks of CoQ10 and of the co-
melting complex of GTCC/CoQ10 were absent, indicating
a supercooled state due to the effect of nanosize particles.
From the above result, the crystallisation point of CoQ10-
LNCs depended mainly on the size of the particles; when
the size reached down to about 200 nm, no crystallisation
of CoQ10 was present, indicating supercooled state.
Supercooled nanoparticles were potentially more stable
with respect to nanoparticles recrystallisation over other
types of lipid nanoparticles like fat emulsions and solid
lipid nanoparticles [42].
Cryo-TEM Investigation
The advantage of Cryo-TEM is that the liquid dispersion
can be frozen and viewed directly in the frozen state; thus,
the samples are investigated close to their natural state [43–
46]. The morphology of the LNC structures was investi-
gated with the composition varying in weight ratio of
CoQ10/GTCC (100, 75, 50, 25 and 0% CoQ10), homoge-
nised at 1000 bar for three cycles. Cryo-TEM images of the
above LNC dispersions, diluted with water five times, are
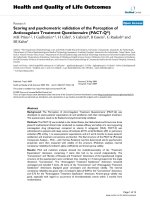
Fig. 1 DSC heating and cooling curves of bulk materials and CoQ10-
LNCS from -60°Cto60°C at a heating rate 5°C/min and cooled from
60°Cto-60°C at a rate 5°C/min. a bulk material GTCC and CoQ10;
b CoQ10-LNCs-100 prepared at 0 bar, 300 bar, 600 bar and 1000 bar;
c CoQ10-LNCs-75 prepared at 0 bar, 300 bar, 600 bar and 1000 bar;
d CoQ10-LNCs-50 prepared at 0 bar, 300 bar, 600 bar and
1000 bar; e CoQ10-LNCs-25 prepared at 0 bar, 300 bar, 600 bar and
1000 bar; and f CoQ10-LNCs-0 prepared at 0 bar, 300 bar, 600 bar
and 1000 bar
Nanoscale Res Lett (2010) 5:1561–1569 1565
123
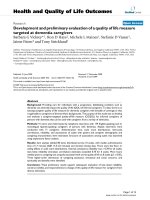
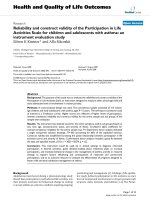
shown in Fig. 2. The bilayer of unilamellar structure
(Fig. 2F-b) and monolayer of unilamellar structure
(Fig. 2F-a) were present in the spherical shape; the thick-
ness of the bilayer and monolayer was about 5 and 2 nm,
respectively. Interestingly, one novel double-sphere struc-
ture (Fig. 2F-c), one bilayer sphere and one monolayer
sphere were discovered. In all five formulations (from
Fig. 2A to E), the monolayer structure spheres were pre-
dominant, and the independent bilayer structure spheres
were a very small minority, replaced by the double-sphere
structure. The ratio of CoQ10/GTCC affected the distribu-
tion of the double-sphere structure; when the GTCC content
was dominant, the double-sphere structure was rare. Several
lipid microstructures, for example, bilayer, monolayer,
multilamellar, were reported, determined by Cryo-TEM
[43–46]. The monolayer of unilamellar structure with the
background inner core, compared to the outer environment,
showed the lipid core, while the bilayer of unilamellar
structure with the same inner core background, compared to
the outer environment, showed no loading in the core.
Skin Penetration Study
NR, a selective fluorescent stain for intracellular lipid
droplets, has been used to visualise the skin penetration
study successfully [47, 48]. To investigate the effect of
LNCs with varying ratio of CoQ10/GTCC as a topical
delivery vehicle, NR (2.5 lg/ml) was used as fluorescent
dye model incorporated into the lipid phase during this
procedure. Five formulations, with composition shown in
Table 1, were homogenised at 1000 bar for three cycles and
used in this study. The rat skin without any treatment was
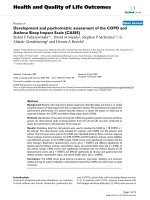
used as the control. Figure 3 shows the fluorescence images
of vertical skin section of rats, having applied the NR-loa-
ded CoQ10-LNCs for 3 h. In Fig. 3f, fluorescence response
from the epidermis and hair follicle was observed at the
excitation and emission wavelength, contributed by auto-
fluorescence; however, almost no fluorescence signal was
detected in the dermis area. After treatment with CoQ10-
LNCs, there was obvious fluorescence, with different dis-
tributions depending on the ratio of CoQ10/GTCC, and the
fluorescence signals of the epidermis and hair follicle were
stronger. When the ratio of CoQ10/GTCC was 1:1, the
fluorescence response of the epidermis was the strongest,
with the decline of the fluorescence signal for CoQ10-
LNCs-25 and CoQ10-LNCs-0, while the fluorescence
response of the hair follicle became stronger with increasing
content of GTCC. Interestingly, a strong fluorescence signal
of the superficial dermis was observed, and the LNCs with a
lower ratio of CoQ10/GTCC showed higher intensity of
fluorescence in the superficial dermis area. When the ratio
of CoQ10/GTCC was decreased to 1:1 (CoQ10-LNCs-50),
the intensity of fluorescence of the superficial dermis was
the strongest, with decreasing fluorescence signal for
CoQ10-LNCs-25 and CoQ10-LNCs-0. The superficial
Table 3 DSC parameters of GTCC and CoQ10 in the bulk GTCC, CoQ10 and CoQ10-LNCs 3 days after being produced for three cycles at
300 bar/600 bar/1000 bar, respectively
Formulation GTCC CoQ10
Melting point (°C) Onset (°C) Enthalpy (J/g) CI% Melting point (°C) Onset (°C) Enthalpy (J/g) CI%
GTCC -2.92 -11.57 95.63 100 / / / /
CoQ10 / / / / 49.12 47.76 131.2 100
100-0 bar / / / / 48.11 45.19 16.75 95.77
100-300 bar / / / / 47.84 45.53 0.3388 1.94
75-0 bar -3.69 -10.29 2.21 69.27 45.16 39.41 11.16 85.06
75-300 bar / / / / 44.72 38.94 0.2943 2.24
50-0 bar -4.03 -12.53 4.29 67.32 40.72 32.61 6.787 77.56
50-300 bar -11 -35.19 4.19 65.67 39.54 31.93 0.2208 2.52
50-600 bar -23.05 -40.19 4.03 63.18 / / / /
50-1000 bar -23.2 -40.76 4.09 64.12 / / / /
25-0 bar -4.08 -11.96 8.57 89.61 34.41 26.35 3.011 68.91
25-300 bar -6.11 -29.92 6.63 69.29 34.44 26.15 0.1216 2.78
25-600 bar -11.92 -19.84 5.39 56.37 / / / /
25-1000 bar -11.61 -19.73 5.38 56.31 / / / /
0-0 bar -3.05 -10.18 12.01 94.21 / / / /
0-300 bar -3.44 -18.24 9.69 75.99 / / / /
0-600 bar -9.23 -16.35 9.28 72.78 / / / /
0-1000 bar -8.69 -16.12 9.17 71.67 / / / /
1566 Nanoscale Res Lett (2010) 5:1561–1569
123
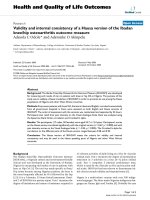
dermis skin fluorescence measurement of NR is expressed
in arbitrary units (ABU), and quantitative analysis of dye
penetration was obtained from pixel intensities derived
from fluorescence measurements of the skin slices (Fig. 4).
However, weak or no fluorescence response was observed
in the lower dermis. Similar results have been previously
reported. Improving the uptake and skin targeting may
become feasible by means of nanoparticular systems such
as solid lipid nanoparticles (SLN), NLC and NE [25]; NLC
revealed higher epidermal drug targeting, and the dye dis-
tribution depended on the MCT content of the NLC [24];
podophyllotoxin-loaded SLN provided good epidermal
targeting [26]. From the above results, LNCs showed not
only good superficial dermis targeting but also good epi-
dermis targeting, indicated by the strong intensity of fluo-
rescence; the degree of fluorescence response depended on
the ratio of CoQ10/GTCC.
The significant extent of skin penetration was most
likely attributed to the fact that nanoparticles provided
superior skin hydration, which was helpful for improving
the permeation effect [49]. Assuming that the average
width of transepidermal hydrophilic pathway is up to
about 100 nm as the intercorneocyte space, it is con-
ceivable for nanosize particles to traverse through the
intercorneocyte spaces [50, 51]. Moreover, an increase in
penetration extent may result from an alteration in the
barrier properties and a greater degree of partitioning of
the LNCs into the stratum corneum and was closely
related to the nature of surfactant [52]. Previous investi-
gations on the mechanism of transdermal permeation of
phospholipid microemulsion indicate that phospholipids
mainly increased the fluidity of the intercellular lipids of
the stratum corneum, which led to enhancement of per-
cutaneous permeation of drugs [49, 53].
Fig. 2 Microstructure obtained by Cryo-TEM of CoQ10-LNCs at a
magnification of 15000 with different contents of CoQ10 in the inner
lipid core, prepared at a pressure of 1000 bar. A CoQ10-LNCs-100;
B CoQ10-LNCs-75; C CoQ10-LNCs-50; D CoQ10-LNCs-25;
E CoQ10-LNCs-0; and F CoQ10-LNCs-100, photo at a magnification
of 50000
Nanoscale Res Lett (2010) 5:1561–1569 1567
123
Conclusion
Surfactant-free CoQ10-LNCs, composed of lecithin,
CoQ10 and GTCC, were successfully prepared by high-
pressure homogenisation. Particle size was the primary
influencing factor on the CI of CoQ10, while the ratio of
CoQ10/GTCC was the key factor affecting the crystalli-
sation point of CoQ10. When the particle size of CoQ10-
LNCs reached about 400 nm, the CI of CoQ10 was
reduced to less than 3%; when the size further decreased to
about 200 nm, no enthalpy was present. From the cooling
process, the supercooled state of CoQ10 was maintained
even at a lower temperature (-40°C). The lecithin mono-
layer structure of CoQ10-LNCs was investigated via the
Cryo-TEM method. CoQ10-LNCs structured with a leci-
thin monolayer sphere have been investigated to be a
suitable delivery system for both epidermal targeting and
superficial dermal targeting; moreover, the degree of dis-
tribution depended on the ratio of CoQ10/GTCC.
Fig. 3 Fluorescent images of skin slices treated with NR-loaded
CoQ10-LNCs (2.5 lg/ml) for NR dye for about 3 h. a Fluorescent
images of skin slices applied with CoQ10-LNCs-100; b fluorescent
images of skin slices applied with CoQ10-LNCs-75; c fluorescent images
of skin slices applied with CoQ10-LNCs-50; d fluorescent images of
skin slices applied with CoQ10-LNCs-25; e fluorescent images of skin
slices applied with CoQ10-LNCs-0; and f fluorescent images of skin
slices without of any application of CoQ10-LNCs
Fig. 4 Fluorescent ABU values of superficial dermis layer treated
with NR-loaded CoQ10-LNCs (2.5 lg/ml) for about 3 h
1568 Nanoscale Res Lett (2010) 5:1561–1569
123
Acknowledgments The authors are grateful for Cryo-TEM support
by Qinfen Zhang from BioEM lab, State Key Lab of Biocontrol,
School of life Sciences, Sun Yat-Sen Universtity, Guangzhou,
510275.
Open Access This article is distributed under the terms of the
Creative Commons Attribution Noncommercial License which per-
mits any noncommercial use, distribution, and reproduction in any
medium, provided the original author(s) and source are credited.
References
1. H. Nohl, L. Gille, K. Staniek, Ann. N. Y. Acad. Sci. 854, 394
(1998). doi:10.1111/j.1749-6632.1998.tb09919.x
2. F. Aberg, E. Appelkvist, G. Dallner, L. Ernster, Arch. Biochem.
Biophys. 295, 230 (1992). doi:10.1016/0003-9861(92)90511-T
3. G. Lenaz, R. Fato, C. Castelluccio, M. Cavazzoni, E. Estornell, J.F.
Huertas, F. Pallotti, G. Parenti Castelli, H. Rauchova, Mol. Aspects
Med. 15, s29 (1994). doi:10.1016/0098-2997(94)90010-8
4. F.L. Crane, J. Am. Coll. Nutr. 20, 591 (2001)
5. L. Ernster, G. Dallner, Biochim. Biophys. Acta 1271, 195 (1995).
doi:10.1016/0925-4439(95)00028-3
6. U. Hoppe, J. Bergemann, W. Diembeck, J. Ennen, S. Gohla, I.
Harris, J. Jacob, J. Kielholz, W. Mei, D. Pollet, D. Schachtsch-
abel, G. Sauermann, V. Schreiner, F. Stab, F. Steckel, Biofactors
9, 371 (1999). doi:10.1002/biof.5520090238
7. Y. Shindo, E. Witt, D. Han, W. Epstein, L. Packer, J. Invest.
Dermatol. 102, 122 (1994)
8. E. Proksch, J.M. Brandner, J. Jensen, Exp. Dermatol. 17, 1063
(2008). doi:10.1111/j.1600-0625.2008.00786.x
9. P.W. Wertz, Acta. Derm. Venereol. Suppl. (Stockh) 208, 7 (2000)
10. V. Jenning, A. Gysler, M. Schafer-Korting, S.H. Gohla, Eur.
J. Pharm. Biopharm. 49, 211 (2000). doi:10.1016/S0939-
6411(99)00075-2
11. V. Sanna, E. Gavini, M. Cossu, G. Rassu, P. Giunchedi, J. Pharm.
Pharmacol. 59, 1057 (2007). doi:10.1211/jpp.59.8.0002
12. H.F. Zhou, Q.H. Ma, Q. Xia, Y. Yan, N. Gu, X. Miao, D. Lu,
Solid State Phenom. 121–123, 271 (2007)
13. E.B. Souto, R.H. Muller, Pharmazie 61, 431 (2006)
14. H.F. Zhou, Q.H. Ma, Y. Ding, Q. Xia, Y.Z. Kuang, X.Z. Hao, N.
Gu, Chin. J. Process Eng. 6, 598 (2006)
15. Q. Xia, A. Saupe, R.H. Mueller, E.B.E.U. Souto, Int. J. Cosmet.
Sci. 29, 473 (2007). doi:10.1111/j.1468-2494.2007.00410.x
16. F. Shakeel, W. Ramadan, M.A. Ahmed, J. Drug Target. 17, 435
(2009). doi:10.1080/10611860902963021
17. H.F. Zhou, Y. Yue, G.L. Liu, Y. Li, J. Zhang, Q. Gong, Z.M. Yan,
M.X. Duan, Nanoscale Res. Lett. 5, 224 (2010). doi:10.1007/
s11671-009-9469-5
18. S. Peltola, R. Saarinen-Savolainen, J. Kiesvaara, T.M. Suhonen,
A. Urtti, Int. J. Pharm. 254, 99 (2003). doi:10.1016/S0378-5173
(02)00632-4
19. E. Peira, D. Chirio, M.E. Carlotti, R. Spagnolo, M. Trotta, J. Drug
Deliv. Sci. Technol. 19, 191 (2009)
20. M. Sentjurc, K. Vrhovnik, J. Kristl, J. Control. Release 59,87
(1999). doi:10.1016/S0168-3659(98)00181-3
21. M.H. Schmid, H.C. Korting, Crit. Rev. Ther. Drug 11, 97 (1994)
22. M.J. Choi, H.I. Maibach, Skin Pharmacol. Physiol. 18, 209
(2005). doi:10.1159/000086666
23. P. Balakrishnana, S. Shanmugam, W.S. Lee, W.M. Lee, J.O.
Kim, D.H. Oh, D.D. Kim, J.S. Kim, B.K. Yoo, H.G. Choi, J.S.
Woo, C.S. Yong, Int. J. Pharm. 377, 1 (2009). doi:10.1016/
j.ijpharm.2009.04.020
24. V. Teeranachaideekul, P. Boonme, E.B. Souto, R.H. Muller, V.B.
Junyaprasert, J. Control. Release 128, 134 (2008). doi:10.1016/
j.jconrel.2008.02.011
25. S. Lombardi Borgia, M. Regehly, R. Sivaramakrishnan, W.
Mehnert, H.C. Korting, K. Danker, B. Ro
¨
der, K.D. Kramer, M.
Scha
¨
fer-Korting, J. Control. Release 110, 151 (2005). doi:
10.1016/j.jconrel.2005.09.045
26. H. Chen, X. Chang, D. Du, W. Liu, J. Liu, T. Weng, Y. Yang, H.
Xu, X. Yang, J. Control. Release 110, 296 (2006). doi:
10.1016/j.jconrel.2005.09.052
27. M. Changez, J. Chander, A.K. Dinda, Colloids Surf. B Biointer-
faces 48, 58 (2006). doi:10.1016/j.colsurfb.2006.01.007
28. N.T. Huynh, C. Passirani, P. Saulnier, J.P. Benoit, Int. J. Pharm.
379, 201 (2009). doi:10.1016/j.ijpharm.2009.04.026
29. E. Allard, N.T. Huynh, A. Vessieres, P. Pigeon, G. Jaouen, J.
Benoit, C. Passirani, Int. J. Pharm. 379, 317 (2009). doi:10.1016/
j.ijpharm.2009.05.031
30. A.B. Dhanikula, N.M. Khalid, S.D. Lee, R. Yeung, V. Risovic,
K.M. Wasan, J.C. Leroux, Biomaterials 28, 1248 (2007). doi:
10.1016/j.biomaterials.2006.10.036
31. D. Hoarau, P. Delmas, S. David, E. Roux, J.C. Leroux, Pharm. Res.
21, 1783 (2004). doi:10.1023/B:PHAM.0000045229.87844.21
32. F. Lacoeuillel, E. Garcion, J.P. Benoit, A. Lamprecht, J. Nanosci.
Nanotechnol. 7, 4612 (2007). doi:10.1166/jnn.2007.006
33. A. Barras, A. Mezzetti, A. Richard, S. Lazzaroni, S. Roux, P.
Melnyk, D. Betbeder, N. Monfilliette-Dupont, Int. J. Pharm. 379,
270 (2009). doi:10.1016/j.ijpharm.2009.05.054
34. F. Han, S. Li, R. Yin, H. Liu, L. Xu, Colloids Surf. Physicochem.
Eng. Aspects 315, 210 (2008). doi:10.1016/j.colsurfa.2007.08.005
35. J. Floury, A. Desrumaux, J. Lardie
`
res, Innov. Food Sci. Emerg.
Technol. 1, 127 (2000). doi:10.1016/S1466-8564(00)00012-6
36. F. Hu, S. Jiang, Y. Du, H. Yuan, Y. Ye, S. Zeng, Colloids Surf.
B Biointerfaces 45, 167 (2005). doi:10.1016/j.colsurfb.2005.08.005
37. C. Freitas, R.H. Mu
¨
ller, Int. J. Pharm. 168, 221 (1998). doi:
10.1016/S0378-5173(98)00092-1
38. E. Zimmermann, E.B. Souto, R.H. Muller, Pharmazie 60, 508
(2005)
39. S.A. Wissing, R.H. Muller, L. Manthei, C. Mayer, Pharm. Res.
21, 400 (2004). doi:10.1023/B:PHAM.0000019291.36636.c1
40. K. Westesen, H. Bunjes, Int. J. Pharm. 115, 129 (1995). doi:
10.1016/0378-5173(94)00347-8
41. V. Jenning, A.F. Thunemann, S.H. Gohla, Int. J. Pharm. 199, 167
(2000). doi:10.1016/S0378-5173(00)00378-1
42. V. Kuntsche, M.H.J. Koch, A. Fahr, H. Bunjes, Eur. J. Pharm.
Sci. 38, 238 (2009). doi:10.1016/j.ejps.2009.07.012
43. A. Saupe, K.C. Gordon, T. Rades, Int. J. Pharm. 314, 56 (2006).
doi:10.1016/j.ijpharm.2006.01.022
44. L. Spernath, O. Regev, Y. Levi-Kalisman, S. Magdassi, Colloids
Surf. A Physicochem. Eng. Aspects 332, 19 (2009). doi:
10.1016/j.colsurfa.2008.08.026
45. R. Waninge, T. Nylander, M. Paulsson, B. Bergenstahl, Colloids
Surf. B Biointerf. 31, 257 (2003). doi:10.1016/S0927-7765
(03)00145-0
46. D.A. Ferreira, M. Bentley, G. Karlsson, K. Edwards, Int.
J. Pharm. 310, 203 (2006). doi:10.1016/j.ijpharm.2005.11.028
47. P. Greenspan, E.P. Mayer, S.D. Fowler, J. Cell Biol. 100, 965
(1985)
48. R. Alvarez-Roman, A. Naik, Y.N. Kalia, H. Fessi, R.H. Guy, Eur.
J. Pharm. Biopharm. 58, 301 (2004). doi:10.1016/j.ejpb.2004.03.027
49. H.B. Gunt, G.B. Kasting, Eur. J. Pharm. Sci. 32, 254 (2007). doi:
10.1016/j.ejps.2007.07.009
50. B.W. Barry, Eur. J. Pharm. Sci. 14, 101 (2001). doi:10.1016/S09
28-0987(01)00167-1
51. G. Cevc, Adv. Drug Deliv. Rev. 56, 675 (2004). doi:10.1016/j.
addr.2003.10.028
52. B.W. Barry, Nat. Biotechnol. 22, 165 (2004). doi:10.1038/nbt0
204-165
53. F. Dreher, P. Walde, P. Walther, E. Wehrli, J. Control. Release
45, 131 (1997). doi:10.1016/S0168-3659(96)01559-3
Nanoscale Res Lett (2010) 5:1561–1569 1569
123