Báo cáo hóa học: " Research Article Reducing the MAC Latency for IEEE 802.11 Vehicular Internet Access" pdf
Bạn đang xem bản rút gọn của tài liệu. Xem và tải ngay bản đầy đủ của tài liệu tại đây (815.41 KB, 9 trang )
Hindawi Publishing Corporation
EURASIP Journal on Wireless Communications and Networking
Volume 2010, Article ID 819168, 9 pages
doi:10.1155/2010/819168
Research Article
Reducing the MAC Latency for IEEE 802.11
Vehicular Internet Access
Daehan Kwak,
1
Moonsoo Kang,
2
and Jeonghoon Mo
3
1
UWB Wireless Communications Research Center, Inha University, Incheon 402-751, Republic of Korea
2
Department of Computer Science and Engineering, Chosun University, Gwangju 501-759, Republic of Korea
3
Depar tment of Information and Industri al Engineering, Younsei University, Seoul 120-749, Republic of Korea
Correspondence should be addressed to Moonsoo Kang,
Received 17 September 2009; Revised 21 April 2010; Accepted 9 May 2010
Academic Editor: Kwan L. Yeung
Copyright © 2010 Daehan Kwak et al. This is an open access article distributed under the Creative Commons Attribution License,
which permits unrestricted use, distribution, and reproduction in any medium, provided the original work is properly cited.
In an intermittently connected environment, access points are sparsely distributed throughout an area. As mobile users travel
along the roadway, they can opportunistically connect, albeit temporarily, to roadside 802.11 (Wi-Fi) APs for Internet access. Net-
working characteristics of vehicular Internet access in an intermittently connected environment face numerous challenges, such as
short periods of connectivity and unpredictable connection times. To meet these challenges, we propose an Access Point Report
(APR) protocol where mobile stations opportunistically collaborate by broadcasting an APR to other mobile stations to fully utilize
the short-lived connection periods. APR can optimize the use of short connection periods by minimizing the scanning delay and
also act as a hint that enables mobile users to predict when connection can be established.
1. Introduction
As the word “ubiquitous” is becoming an essential part of
our lives, seamless connectiv ity gains a growing importance.
The everlasting demand for ubiquitous network connectivity
has driven many developments in wireless technologies
over the past years: WLAN (IEEE 802.11), WiMAX (IEEE
802.16), and 3G networks. IEEE 802.11 wireless access, in
particular, has experienced a tremendous rise in popularity
by providing inexpensive, yet powerful wireless Internet
access. However, 802.11 hotspots have a limited coverage
rangeofuptoafewhundredmetersandarebasedon
intermittent connectiv ity. Intermittent connectivity implies
that connected and disconnected communication areas are
altered while the user is moving along a path; that is, there
is no continuous network access. This poses numerous chal-
lenges: limited short periods of connectivity, unpredictable
connection times, and varying transmission characteristics
[1, 2]. Nevertheless, experiments have shown that WLAN
can be workable over significant distances for mobile users
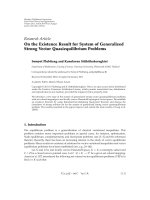
at high speeds [3–5]. Figure 1 introduces a sample of an
intermittent connectivity scenario.
In this paper, we focus on the challenges that accompany
short and unpredictable connectivity periods, that is, an
intermittent connectivity environment [1]. These challenges
can be met by max imizing the us e of short connectivity periods
and providing hints for other mobile users to help them predict
when connection can be established. For instance, as a vehicle
makes an entrance into the edge of the communication range
of an AP, wireless losses occur due to the low signal quality.
This leads to lengthy connection establishment in the MAC
(scanning) and Network (network address acquisition) layer,
continuing to influence the full utilization of the high-quality
link access, that is, near the AP where the signal is strong [4,
5]. To make the best use of short-lived connectivity periods,
we reduce or eliminate the 802.11 scanning latency. This goal
is similar to the objective in the 802.11 handoff operation.
The major difference between the two is that our proposal
is based on reducing the delay in a stand-alone, single-cell
network while the well-known handoff operation aims to
reduce the latency in an infrastructure network consisting of
multiple overlapping cells.
Our basic idea to reduce the scanning latency is as
follows. Once a mobile station (MS) enters a service range
2 EURASIP Journal on Wireless Communications and Networking
Internet
AP 1 AP 2
MS 6
AP 4
AP 5
AP 3
MS 1
MS 2 MS 5
MS 7
MS 4MS 3
Seamless
connectivity
Intermittent
connectivity
Figure 1: Intermittently and Seamlessly Connected Environment.
and associates itself with an access point (AP), it will oppor-
tunistically collaborate with other MSs by relaying the AP’s
information to the incoming MSs that are about to enter the
AP’s communication area. This will allow new incoming MSs
to be directly associated with the AP as soon as they enter the
communication range, avoiding scanning procedures and,
thus, improving the overall performance of the system. The
relayed information can also be used as a hint on where a
connection can be established, which will be a solution to
our second goal. With that in mind, we propose an Access
Point Report (APR) protocol that settles both our goals.
To accomplish our goals, we initially investigated some
related work for preliminary purposes as discussed in
Section 2.Next,inSection 3, we examine the IEEE 802.11
standard scanning procedure. In Section 4, we introduce and
explain our proposed protocol and algorithms. Simulation
results based on vehicle traffic models along with an analysis
are presented in Section 5. Finally, we conclude our work in
Section 6, laying out our plan for future work.
2. Related Work
2.1. Feasibility Study of WLAN Usage in Vehicular Envi-
ronments. The Drive-thru Internet project [3] introduces
the idea of using WLAN access to provide opportunistic
Internet access for users traveling in vehicles. This project
exploits WLAN APs at the roadside to conduct experimental
evaluations on 802.11 b at speeds from 80 to 180 km/h
and confirm the feasibility of data communication for fast
moving vehicles. They divide a connection into three phases
depending on connection quality: the entry, production, and
exit phase. The production phase exhibits high throughput
while throughput is low during the entry and exit phases due
to low signal quality.
Experiments conducted in [4] present the use of “open”
Wi-Fi networks for vehicular Internet access. Based on their
measurement data for over 290 drive hours under prevalent
driving conditions in urban areas, they show that even if
only about 3.2% of all APs participate, it is adequate to
support opportunistic Internet connections for a variety of
applications. They also identify the mean and maximum
active scan latency to be 750 ms and 7030 ms, respectively.
More recently, Hadaller et al. [5] built on a more detailed
experimental analysis based on [3, 4]. They analyze each
phase of a connection and draw out ten problems that
cause throughput reduction. In particular, connection setup
delays, such as lengthy AP selection result in a loss of 25% of
the overall throughput. They further remark, consistent with
[3, 4], that a robust connection setup is crucial in order to
fully utilize the production phase of a short-lived connection
period.
Along with 802.11 b, a myriad of research has been con-
ducted for other standards in the 802.11 family, confirming
the suitability of 802.11 WLANs for vehicle scenarios [6, 7].
2.2. Handoff. In the IEEE 802.11 standard, stations (STA)
are required to consecutively scan all channels. Scanning (or
probing) multiple channels is time consuming; however, a
number of proposals in the handoff area works to reduce this
delay.
The handoff processoccurswhenanMSmigratesfrom
one AP to another, changing its point of attachment, as
shown in Figure 1,whereMS
1
moves from AP
1
to AP
2
.
The handoff latency consists of three phases: scanning,
authentication, and reassociation. Scanning delay is the
dominant contributor to the overall latency which accounts
for more than 90% of the total handoff latency [8].
The emerging draft 802.11 k specification [9] introduces
Neighbor Report, which contains information on candidate
handoff APs. A neighbor report is sent by an AP and
its element contains entries of neighboring APs that are
members of an extended service set (ESS). An MS willing
to use the neighbor report will send a Neighbor Report
Request frame to its associated AP. An AP can send a
Neighbor Report Response frame either upon request or
autonomously. To reduce the scanning latency, using the
neighbor report allows MSs to selectively scan channels or
skip the scanning procedure.
The neighbor report is similar to our proposed APR
protocol. The difference is that (a) neighbor reports require
adjacent APs to fill in its neighbor list entries and (b)
APs send the report. Condition (a) is not suitable for
an intermittently connected environment where APs are
sparsely distributed and condition (b) is not suitable because
APs cannot transmit a neighbor report outside its communi-
cation range.
3. The IEEE 802.11 Scanning Procedure
The process of identifying an existing network is called
scanning. In the scanning procedure, STAs must either
transmit a probe request or listen on a set of channels
to discover the existence of a network. The IEEE 802.11
standard defines two types of scanning procedures: passive
and active scan.
3.1. Scanning Procedure. In passive scanning, APs contend
with other stations to gain access to the wireless medium
EURASIP Journal on Wireless Communications and Networking 3
0
20
60
80
100
120
140
160
40
Connection time (sec)
52035
AP range
200 m
100 m
50 65 80 95
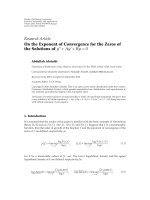
Connection time
Ve l o c i t y ( k m / h )
110 125 155 170 185 200140
72 sec, 10 km/h
9sec,80km/h
6 sec, 120 km/h
4 sec, 180 km/h
Figure 2: Connection time.
and periodically broadcast beacon frames. An MS willing to
access to an AP in its area will probe each channel on the
channel list and wait for beacon frames. After a complete
channel set is scanned, the MS will extract the information
from the beacon frames and use them along with the
corresponding signal strength to select an appropriate AP to
begin communication.
The active scanning mode involves the exchange of probe
frames. Rather than listening for beacon frames, an MS
wishing to join a network will broadcast a probe request
frame on each channel. Scan time can be reduced by using
active scanning; however, it imposes an additional overhead
on the network because of the transmission of probe and
corresponding response frames.
3.2. Scanning Delay. Due to the scanning delay and the high
mobility of vehicles (esp. on highways); the total amount
of time connected to an AP is generally small compared to
static users. As shown as a plot of a mathematical function
in Figure 2, higher speeds mean lesser time to connect to a
single AP. For pedestrian walking speed (10 km/h) the total
connection time is about 72 seconds. However, as speed rises
the total connection time drastically drops. For speeds of
80 km/h, 120 km/h, and 180 km/h the total connection time
is 9, 6, and 4 seconds, respectively. Hence, it is important that
MSs fully utilize the given network.
The total time that an MS can stay connected to an AP,
that is, the time connected (t
c
), can be calculated using t
c
=
d
AP
/v
MS
,wherev
MS
is the velocity of the vehicle, and d
AP
is
the communication range of the A. Given the scanning delay
(s
d
) and using (1), we are able to derive the portion of the
scanning delay (S
p
) as follows:
S
p
= s
d
·
1
t
c
· 100%. (1)
An optimal example of the connectivity time where an
MS (120 km/h) passes through the diameter of an AP (a
range of 200 m) is 6 seconds. If the average delay in active
scanning is 750 msec as in [4] and 1200 msec in passive
scanning, the total portion of the scanning delay is 12.5%
and 20%, respectively.
The total portion of the scanning delay may look
negligible; however, the total scanning portion increases as
the MS crosses the border of the communication range and
it is important to minimize the connection setup time so
the delay does not continue into the high-quality production
phase. Again, this is our motivation to reduce or eliminate
the scanning delay.
4. AP Report (APR) Protocol
4.1. Overall Procedure. Referring to Figure 1,asMS
4
moves
into AP
3
’s radio range, it will first sweep each channel in
the channel set with passive or active scanning mode. If
anybeaconframeorproberesponseisdetected,theMS
buffers and extracts the AP’s information. Before the MS is
associated with the AP, it will opportunistically broadcast
an AP report on each channel so that other MSs, like MS
3
,
can utilize the AP report. Meanwhile, MS
3
will approach
AP
3
, and before it enters AP
3
’s communication range, it will
broadcast the AP report a single hop (e.g., to MS
2
)away.As
MS
3
enters AP
3
’s communication range, the MS will directly
associate itself with the AP, eliminating the scanning phase.
Details of the aforementioned procedures are explained in
the subsections below.
4.2. Main Operation of a Mobile Station
4.2.1. A Mobile Station Relaying AP Reports. After an MS
completes a full scan and acquires a beacon frame or probe
response in the passive or active mode, respectively, it will
extract the buffered AP’s information and place it in its
transmission queue. The MS will then relay the received
information one hop away with a broadcast destination
address. Looking back at Figure 1, this is illustrated as MS
4
relaying information to MS
3
. However, other MSs may
be tuned to other channels and, thus, cannot hear the
information being relayed. In order to allow other MSs on
adifferent channel to receive the relayed frame, the relay
node is required to broadcast the frame on each channel. The
procedure of broadcasting an AP report on each channel is
shown in Algorithm 1.
Algorithm 1 consists of two cycles. An MS will attempt to
broadcast an AP report on each channel during the first cycle.
When a medium is in use, other than backoffing a certain
time, the corresponding channel is to be skipped so that the
broadcasting delay can be minimized. After a channel set is
swiped, the MS will attempt to retry sending the AP report
on each skipped channel. The duration of the first cycle will
act as a backoff time, and thus it would be more probable
to successfully transmit on the skipped channel. Skipped
channels are neglected if the medium is in use again during
the second cycle.
A question arises here; the main objective is to eliminate
the scanning delay, but we end up with broadcast delay, that
is, the amount of time required to transmit an AP report
4 EURASIP Journal on Wireless Communications and Networking
[Cycle 1]
for each channel to broadcast do
check if medium is busy on channel c
if medium is idle on channel c then
broadcast AP report with a broadcast destination
else if medium is busy on channel c then
do not back off
end if
end for
[Cycle 2]
for each skipped channel do
check if medium is busy on channel sc
if medium is idle on channel sc then
broadcast AP report with a broadcast destination
else if medium is busy on channel sc then
do not back off
end if
end for
Algorithm 1: Broadcasting AP report on each channel.
on each channel. Accordingly, it is necessary to compare the
scanning delay and the broadcast delay. We use (2)and(3)to
calculate the broadcast delay upon sending an AP report for
each channel;
T
d
=
L
R
,
(2)
B
d
=
[
(
C
− 1
)
· SW
d
+ SC
1
· T
d
]
+
[
(
C
− SC
1
)
· SW
d
+ SC
2
· T
d
]
=
(
2C
− SC
1
− 1
)
· SW
d
+
(
SC
1
+ SC
2
)
· T
d
.
(3)
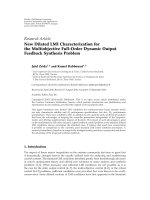
The context information of the AP report is shown in
Figure 3. Each AP report consists of BSSID (AP’s MAC
address), BSSID information, channel number (indicates the
current operating channel of the AP), channel band, and
PHY options as in [9]. Additional fields added to the AP
report are the AP’s location and the signal strength.
Thus, we use 15 octets for the frame size. Also, assuming
we use IEEE 802.11 b, we use 11 channels with a data rate of
11 Mbps. With current development, the channel switching
delay can be reduced to tens or hundreds of microseconds
[10, 11], but we set it to 1 msec. We assume that an AP
report was successfully transmitted on 5 channels during
the first cycle and 6 channels during the second cycle.
Using (2)and(3), the broadcast delay was calculated to be
16.12 msec. Compared to the minimum scanning delay of
120 ms measured in [4], we believe 16.12 msec of delay has
improved the overall network performance as shown by the
simulation results in Section 5.
Another possible issue may be the following. How are
MSs that are in scanning mode, that is, switching channel,
going to hear the relayed AP reports.
If mobile stations are located outside a communication
range (e.g., MS
3
), they are likely to be on a scan mode.
Table 1: Notations and Parameters.
T
d
Frame transmission time
L Length of the frame (bits)
R Transmission rate (bits per sec)
B
d
Broadcast time
C Total number of channels
SW
d
Channel switching time
SC
1
Number of channels that successfully transmitted
APR during the first cycle
SC
2
Number of channels that successfully transmitted
APR during the second cycle
Table 2: APR broadcast time.
Data rate Worst case Best case
1 Mbps 5.962 msec 3.498 msec
11 Mbps 4.818 msec 2.354 msec
Therefore, even though MS
4
broadcasts an AP report on
each channel, MS
3
may have trouble to hear this message
because they are on a scan mode, that is, constantly switching
channels. A question arises here; since MSs are switching
channels at an interval time, APR broadcast frames may not
be heard. Accordingly, it is necessary to compare the time
that a mobile waits on a channel for each scan mode and
the time that it takes to broadcast an APR on every available
channel.
First, the time that an MS stays on a channel is
determined by the MinChannelTime and MaxChannelTime.
In the active scanning mode, after a probe message is sent,
the MS will wait for MinChannelTime and if no response is
received, the next channel will be scanned. If the medium
is busy during the MinChannelTime, the MS will wait until
MaxChannelTime is achieved in order to allow the AP or
multiple APs to gain access to the medium and send a probe
response. The IEEE 802.11 standard does not specify a value
for both the MinChannelTime and MaxChannelTime.Both
times vary depending on vendors. However, an empirical
measurement shows that MinChannelTime is about 20 ms,
and 40 ms for MaxChannelTime [8]. In the passive scanning
mode, the time that an MS stays on a channel is 100 ms by
default, based on the standard [12].
Second, we use (2)and(3) to calculate the broadcast
delay upon sending an AP report for each channel. We use
15 octets for the frame size. Also, assuming we use IEEE
802.11 b, we use 11 channels with the fastest data rate of
11 Mbps and slowest data rate 1 Mbps. We assume that an
AP report was successfully transmitted on 0 channels during
the first cycle and 11 channels during the second cycle (worst
case). Also, we assume that an AP report was successfully
transmitted on 11 channels during the first cycle and did
not needed to enter the second cycle (best case). Ta bl e 2
shows the results for the best and worst case for 11 Mbps and
1Mbps.
As shown in Ta bl e 2 , at the lowest rate and worst case
scenario the time to broadcast an APR on each channel is
EURASIP Journal on Wireless Communications and Networking 5
BSSID
BSSID
information
Channel
number
Channel
band
PHY
options
AP
geographical
location
AP
signal
strength
Octets:6211122
Figure 3: AP report frame structure.
if a STA receives an AP report x then
if no other AP report exists and queue is buffered then
cache AP report x
end if
if other AP reports exist then
compare with other received AP reports
if same AP report exists (x
= x) then
discard
else if there is no same AP report (x
/
= x) then
cache AP report x
end if
end if
end if
Algorithm 2: Deciding whether to use an AP report.
approximately 6 msec. Since 6 msec is smaller than 20 msec
for active scanning and 100 msec for passive scanning on
one channel, we can see that an APR can be broadcasted on
every channel before the receiving node switches channels in
either scan mode. Therefore, we show that broadcasting on
all channels does not affect other nodes from receiving it due
to being in a scan mode.
4.2.2. A Mobile Station Receiving AP Reports. An MS within
the radio range of a relaying MS will receive the AP
report since it is broadcasted on each available channel. The
receiving MS will then extract the contents but will not
return an ACK. This is when the receiving MS will determine
if it will use the AP report or not. The decision is made
according to Algorithm 2.
When a mobile station receives multiple AP reports, it
must decide which AP report to use. An example of this
scenario can be explained with Figure 1.AsMS
6
and MS
7
enter AP
4
and AP
5
,respectively,MS
5
will receive two AP
reports from both MS
6
and MS
7
.MS
5
will use Algorithm 2
and determine to cache both AP reports. Finally, MS
5
will
decide to use either MS
6
’s or MS
7
’s AP report depending on
its current location.
4.2.3. Decision Usage on Multiple AP Reports. As an MS
station travels along the road it can receive multiple APRs
as depicted in Figures 4 and 5. Deciding what APR to
use is shown in Algorithm 3. Algorithm 3 is based on the
assumptions and parameters given in Tab le 3.
In Algorithm 3, the MS will first calculate its distance
with the AP
n
’s location at time t for every APR it has received.
If we assume the MS’s GPS location is updated every second,
for n = 1toAPR
n
D
t
n
=
(x
n
− x
t
)
2
+(y
n
− y
t
)
2
D
t+1
n
=
(x
n
− x
t+1
)
2
+(y
n
− y
t+1
)
2
end for
for n
= 1toAPR
n
if D
t+1
n
− D
t
n
= D
t+1
n+1
− D
t
n+1
then
t++
else if D
t+1
n
− D
t
n
>D
t+1
n+1
− D
t
n+1
then
use APR
n+1
else if D
t+1
n
− D
t
n
<D
t+1
n+1
− D
t
n+1
then
use APR
n
end if
end for
Algorithm 3: Deciding which AP report to use.
y
3
y
y
2
y
1
AP1
MS 3
MS 1 MS 2
AP2
x
1
x
2
x
3
x
4
x
5
x
Figure 4: Multiple AP report usage scenario 1.
the MS’s location at time t+1 will again calculate the
distance with the AP
n
’s location, illustrating the first for
iteration in Algorithm 3. Both distances are then compared
to check whether the MS is moving toward (in both x and
y axis) or away AP
n
, illustrating the second for iteration in
Algorithm 3. If the MS is moving toward AP
n
then the APR
is utilized and if it is moving away, the APR is discarded.
Otherwise, if there is no movement of the MS or if the MS is
exactly in the middle of two comparing APs, time t +1and
time t + 2 are compared. This process is executed for every
received APR.
4.3. State Transition Diagram. Putting it all together, we
show the overall procedures in a state transition diagram
shown in Figure 6. As an MS scans each channel i and if a
packet is received on the corresponding channel, the packet
is checked whether it is an (a) ordinary beacon frame or
(b) an APR. If it is (a) an ordinary beacon frame, then
6 EURASIP Journal on Wireless Communications and Networking
y
y
3
y
4
y
2
y
1
AP2
AP1
MS 3
MS 1
MS 2
x
1
x
2
x
3
x
4
x
Figure 5: Multiple AP report usage scenario 2.
Table 3: Parameters and Assumptions.
Dimension 2
x axis, y axis Positive
Location update 1 sec interval
APR is received at time t
Number of APR APR
n
AP
n
’s geographical location (x
n
, y
n
)
MS’s geographical location at time t (x
t
, y
t
)
Distance from AP
n
to MS at time tD
t
n
this means that it will collaborate and notify other MSs
of the AP’s information, thus constructing an APR frame.
The MS will then broadcast it on each channel according
to Algorithm 1 which is equivalent to the right bottom
box in the state transition diagram. After broadcasting the
APR, the MS will then follow the legacy 802.11 procedure,
that is, authentication and association to the AP. When the
corresponding AP’s signal strength decreases, the MS will
then search for an adjacent AP within its vicinity. If an AP
is detected, it will use existing handoff algorithms to initiate
handoff to the next AP, which is illustrated on the left bottom
corner of the transition diagram. If it is (b) an APR, the
MS will check to decide whether it will use the APR or
not by using Algorithm 2 and if multiple APRs are received
then which to use or discard is based on Algorithm 3. If the
APR is useful, then it will broadcast it to other MSs and
then skip the scanning phase and directly associate to the
corresponding AP. Again, if the corresponding AP’s signal
strength decreases, it will initiate handoff if an AP is available
within its vicinity or if no AP is available, signal lost will
occur.
5. Simulations
5.1. Vehicle TrafficModel.In Mobile Ad hoc Networks
(MANETs), mobile nodes tend to move randomly and, thus,
the network topology changes rapidly and unpredictably.
However, with vehicles, rather than moving randomly,
vehicles tend to move in an orderly manner because they
are limited to move within a paved road. As a result, much
research to analyze and predict the mobility patterns of
vehicles is in progress [13–15].
5.1.1. Car-Following Model. In civil engineering, the Car-
Following Model [13]isusedtodescribetrafficbehavioron
a single lane. It is a class of microscopic models that uses (4)
to describe the behavior of one vehicle following another on
a single lane of roadway. This model assumes that a car’s
mobility follows a set of rules in order to maintain a safe
distance from a leading vehicle. The mathematical model can
be represented by the following equation:
S
= α + β · V + γ · V
2
,(4)
where S is the average spacing from rear bumper to rear
bumper. The coefficients α,β,and γ are the effective vehicle
length, reaction time, and reciprocal of twice the maximum
average deceleration of a following vehicle, respectively. The
term, γ
· V
2
, is used so that a following vehicle has sufficient
spacing to completely stop without collision if the leading
vehicle comes to a full stop.
5.1.2. TrafficVolumeModel. To accurately calculate realistic
traffic models we use a set of traffic volumes (veh/hr)
produced in [14] which used empirical traffic data. We are
interested in the 4 types of traffic volumes produced in [14].
(a) Rush hour traffic with high traffic volume of approx-
imately 3300 veh/hr.
(b) Nonrush hour trafficwithmoderatetrafficvolumeof
approximately 2500 veh/hr.
(c) Night trafficwithlowtrafficvolumeofapproximately
500 veh/hr.
(d) Steady trafficwithtraffic volume between (b) and (c),
approximately 1000 veh/hr.
According to [14], the traffic volume in (a) is usually seen
during 8 am
∼9 am, for (b) is 10 am∼12 pm, and 1 am∼3am
for (c). We use this set of traffic volumes to produce a realistic
traffic flow behavior for simulation inputs.
5.1.3. Poisson-Distributed Arrival Model. In the classical
vehicular traffic theory, vehicles’ arrival process is assumed to
be Poisson distributed with mean arrival rate λ in veh/sec [14,
15]. Thus, the interarrival time of vehicles are shown to be
exponentially distributed with probability density function
(pdf),
f
τ
(
t
)
= λ · e
−λt
,(5)
with the distribution of time gaps between vehicles, we can
find the pdf of distance d,
f
d
(
d
)
=
λ
v
m
· e
−(λ/v
m
)d
,(6)
where d
= v
m
· τ in meters and v
m
is the mean speed of
vehicles in m/sec.
EURASIP Journal on Wireless Communications and Networking 7
Start
Scan channeli
No
i ++
Frame
received on
channel i
Ye s
Check frame
APRBeacon frame
Construct APR
frame
Broadcast APR
Estimate AP
range
Moving
towards AP
Cycle 1
For channel i to C
i
= skipped channel;
C
= total number of
skipped channels
Channel i is
idle
Ye s
Busy
C :totalnumber
of channels
i ++
Cycle 2
Broadcast on
channel i
Skip channel i
Cache APR Discard APR
Ye s N o
APR is
received
Other APR
exists
Same APR
exists
Compare
MS & AP location
Ye s
Ye s
No
No
Broadcast APR
before entering
AP range
Authenticate &
associate with AP
APR is
received
Discard APR
Connect with AP
RSS decrease
Handoff
inititation
Signal lost
Use existing
handoff
algorithms
APR: access point report
RSS: received signal strength
MS: mobile station
AP: access point
Figure 6: AP report state transition diagram.
8 EURASIP Journal on Wireless Communications and Networking
0
100
200
Average scanning delay (msec)
300
400
500
600
700
800
900
0
Active scan
Active scan w/o APR
10 20
Speed (m/sec)
30 40 50
Figure 7: Active scan for car-following model.
With (6), and the cumulative distribution function (cdf)
of d,
F
(
d
)
= 1 − e
−(λ/v
m
)d
≡ p,0<p<1, (7)
we obtain the distance in terms of λ and v
m
(8)whichwill
be used in the following simulation with the inputs based on
the car-following model and trafficvolumemodel,
d
=−
v
m
λ
· ln
1 − p
. (8)
5.2. Simulation Model
5.2.1. Simulation Setup. In our simulation we measured the
average scanning delay for 100 vehicles. Vehicles are placed
on a straight single lane, moving in one direction based on
a constant speed, where the inter-arrival time follows the
distribution given in (5). The communication range of a
vehicle is set to 200 m and placed in the center of the road.
We set the total number of channels to 11 as in 802.11 b.
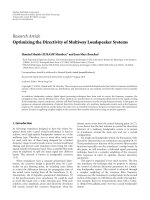
For comparison, we use the mean scanning time of 750 msec
in [5] for active scanning, that is, the active scan w/o APR
in Figure 7. For passive scanning we use 1200 ms, that is, the
passive scan w/o APR in Figure 8, since the default beacon
interval is 100 msec and each channel listening time must be
longer than the beacon interval. Ta bl e 4 is a summary of our
simulation settings.
5.2.2. Applying Vehicle Models. Using the car-following
model equation (4), we set α to a value between 3
∼6
meters, which expresses various vehicle lengths and the
reaction time, β, is randomly selected from 0.7
∼1.5 sec for
each vehicle [16], respectively. For speeds of up to 55 m/sec
(approx. 200 km/h), we simulate 1000 samples with 1000
vehicles. We calculate the average spacing (S) for each speed
of up to 55 m/sec for 1000 vehicles. Two parameters, S and
v
m
, are used in varying λ in the Poisson-distributed arrival
model. Figures 7 and 8 illustrate the results of this simulation.
0
200
400
Average scanning delay (msec)
600
800
1000
1200
1400
0
Passive scan
Passive scan w/o APR
10 20
Speed (m/sec)
30 40 50
Figure 8: Passive scan for car-following model.
0
100
200
Average scanning delay (msec)
300
400
500
600
700
800
900
0
500 veh/hr
1000 veh/hr
2500 veh/hr
3000 veh/hr
w/o APR
10 20
Speed (m/sec)
30 40 50
Figure 9: Traffic Volume Model.
Table 4: Simulation settings.
Simulation environment C++
AP’s communication range 200 m
Number of vehicles 1000
Number of samples 1000
Mean scanning time (Active) 750 msec
Mean scanning time (Passive) 1200 msec
Ve l o c i t y ( v)1m/sec
∼55 m/sec
Vehicle length (α)3
∼6m
Reaction time (β)0.7
∼1.5 sec
Maximum average deceleration (γ) 0.0075 sec
2
/m
On applying the traffic volume model to the Poisson-
distributed arrival model we vary λ based on the 4 types of
traffic volume, as shown in Figure 9.
EURASIP Journal on Wireless Communications and Networking 9
5.2.3. Results and Analysis. Since our main focus is to
analyze the overall average scanning delay, we assumed an
ideal PHY/MAC layer, where all packets are received within
the communication range, to simplify our implementation.
Therefore, it is expected that the average scanning delay will
be higher than what is presented in this paper, since it will be
likely that more vehicles will not receive an AP report.
First, the car following model has seen improvements
in using AP reports. Compared with vehicles with no AP
reports, vehicles at even speeds up to 55 m/sec (about
200 km/hr), which means that the spacing between vehicles
is high and thus implies less vehicles/hour, have an average
scanning delay of 295 msec (active) and 495 msec (passive)
per vehicle. This is an improvement reducing the average
scanning delay per vehicle by approximately 60% regardless
of the scanning mode compared to the mean scanning time
of 750 msec in [5] for active scanning and 1200 ms for passive
scanning.
In the trafficvolumemodel,4typesoftrafficvolume
have been measured for active scanning alone, because the
improvements are similar in both scanning modes. In the
night traffic scenario we can see that the average scanning
delay can be improved by 48% and for the steady traffic
scenario, by 71%. For both nonrush and rush hours, since
there are more vehicles per hour, we can easily see that the
average scanning delay is nearly negligible. In short, this
implies that the more vehicles per hour the more vehicles
collaborate and share the AP’s information to reduce the
overall scanning delay.
Our approach may be even more favorable for 802.11 a
than for 802.11 b, since the scanning delay will be even higher
for 802.11 a with 32 channels.
6. Conclusions
Much research has been conducted and concluded that
intermittently connected WLAN networks are capable of
providing a variety of applications, especially those that can
tolerate intermittent connectivity. However, due to the high
mobility of vehicles, users connect to a network for only a
short period of time. Also, because MSs have no information
on when connectivity is available, MSs will continuously
search for beacon frames or transmit probe requests. In
this paper, we proposed an AP report protocol that can
reduce the scanning delay for fast connection establishments
and provide hints to users on when connections can be
established. When vehicles have higher density, our approach
reduces the scanning delay even more, thus contributing
to the overall network efficiency. To fully utilize the short
connection periods, potential areas of future work include
reducing the IP acquisition time.
Acknowledgments
This work was supported in part by the National Research
Foundation of Korea (NRF) Grant funded by the Korea gov-
ernment (MEST) (no. 2010-0016192) and in part by Broma
ITRC of the MKE, Korea (NIPA-2010-(C1090-1011-0011)).
References
[1] J. Ott and D. Kutscher, “A modular access gateway for manag-
ing intermittent connectivity in vehicular communications,”
European Transactions on Telecommunications, vol. 17, no. 2,
pp. 159–174, 2006.
[2] J. Ott and D. Kutscher, “A disconnection-tolerant transport
for drive-thru internet environments,” in Proceedings of the
24th Annual Joint Conference of the IEEE Computer and
Communications Societies (INFOCOM ’05), vol. 3, pp. 1849–
1862, Miami, Fla, USA, March 2005.
[3] J. Ott and D. Kutscher, “Drive-thru internet: IEEE 802.11b
for ”automobile” users,” in Proceedings of the 23rd Annual
Joint Conference of the IEEE Computer and Communications
Societies (INFOCOM ’04), vol. 1, pp. 362–373, March 2004.
[4] V. Bychkovsky, B. Hull, A. Miu, H. Balakrishnan, and S.
Madden, “A measurement study of vehicular internet access
using in situ Wi-Fi networks,” in Proceedings of the 12th Annual
International Conference on Mobile Computing and Networking
(MOBICOM ’06), pp. 50–61, September 2006.
[5]D.Hadaller,S.Keshav,T.Brecht,andS.Agarwal,“Vehicular
opportunistic communication under the microscope,” in
Proceedings of the 5th International Conference on Mobile
Systems, Applications and Services, pp. 206–219, June 2007.
[6] M.Wellens,B.Westphal,andP.M
¨
ah
¨
onen, “Performance eval-
uation of IEEE 802.11-based WLANs in vehicular scenarios,”
in Proceedings of the IEEE 65th Vehicular Technology Conference
(VTC ’07), pp. 1167–1171, Irl, April 2007.
[7] D. N. Cottingham, I. J. Wassell, and R. K. Harle, “Performance
of IEEE 802.11a in vehicular contexts,” in Proceedings of the
IEEE 65th Vehicular Technology Conference (VTC ’07), pp. 854–
858, April 2007.
[8] A. Mishra, M. Shin, and W. Arbaugh, “An empirical analysis
of the IEEE 802.11 MAC layer handoff process,” ACM
SIGCOMM Computer Communication Review, vol. 33, pp. 93–
102, 2003.
[9] IEEE 802.11k, “Wireless Medium Access Control (MAC) and
Physical Layer (PHY) Specifications: Specifications for Radio
Resource Measurement,” 802.11k/D4.0, March 2006.
[10] Maxim 2.4GHz 802.11b Zero-IF Transceivers, http://pdfserv
.maxim-ic.com/en/ds/MAX2820-MAX2821.pdf.
[11] F. Herzel, G. Fischer, and H. Gustat, “An Integrated CMOS RF
Synthesizer for 802.11a Wireless LAN,” IEEE Journal of Solid-
State Circuits, vol. 38, no. 10, pp. 1767–1770, 2003.
[12] IEEE 802.11, “Part11: Wireless LAN Medium Access Control
(MAC) and Physical Layer (PHY) Specifications,” June 2003.
[13] R. Rothery, “Car following models,” in Traffic Flow Theory,
N. Gartner, C. Messer, and A. Rathi, Eds., Chapter 4, 1992,
Transportation Research Board Special Report 165 (newest
edition).
[14] N. Wisitpongphan, F. Bai, P. Mudalige, and O. K. Tonguz,
“On the routing problem in disconnected vehicular ad Hoc
networks,” in Proceedings of the 26th IEEE International
Conference on Computer Communications (INFOCOM ’07),
pp. 2291–2295, May 2007.
[15] M. Rudack, M. Meincke, and M. Lott, “On the dynamics of
ad hoc networks for inter vehicle communications,” in Pro-
ceedings of the International Conference on Wireless Networks
(ICWN ’02), Las Vegas, Nev, USA, June 2002.
[16] M. Green, “How long does it take to stop? Methodological
analysis of driver perception-brake times,” Transportation
Human Factors, vol. 2, no. 3, pp. 195–216, 2000.