Báo cáo hóa học: " Research Article Indoor Positioning Using Nonparametric Belief Propagation Based on Spanning Trees" pdf
Bạn đang xem bản rút gọn của tài liệu. Xem và tải ngay bản đầy đủ của tài liệu tại đây (1.74 MB, 12 trang )
Hindawi Publishing Corporation
EURASIP Journal on Wireless Communications and Networking
Volume 2010, Article ID 963576, 12 pages
doi:10.1155/2010/963576
Research Article
Indoor Positioning Using Nonparametric Belief Propagation
Based on Spanning Trees
Vladimir Savic (EURASIP Member), Adri
´
an Poblaci
´
on, Santiago Zazo (EURASIP Member),
and Mariano Garc
´
ıa
Signal Processing Applications Group, Polytechnic University of Madrid, Avenida. Complutense 30, 28040 Madrid, Spain
Correspondence should be addressed to Vladimir Savic,
Received 25 January 2010; Accepted 14 June 2010
Academic Editor: Davide Dardari
Copyright © 2010 Vladimir Savic et al. This is an open access article distributed under the Creative Commons Attribution License,
which permits unrestricted use, distribution, and reproduction in any medium, provided the original work is properly cited.
Nonparametric belief propagation ( NBP) is one of the best-known methods for cooperative localization in sensor networks. It
is capable of providing information about location estimation with appropriate uncertainty and to accommodate non-Gaussian
distance measurement errors. However, the accuracy of NBP is questionable in loopy networks. Therefore, in this paper, we propose
a novel approach, NBP based on spanning trees (NBP-ST) created by breadth first search (BFS) method. In addition, we propose
a reliable indoor model based on obtained measurements in our lab. According to our simulation results, NBP-ST performs better
than NBP in terms of accuracy and communication cost in the networks with high connectivity (i.e., highly loopy networks).
Furthermore, the computational and communication costs are nearly constant with respect to the transmission radius. However,
the drawbacks of proposed method are a little bit higher computational cost and poor performance in low-connected networks.
1. Introduction
The belief propagation (BP) algorithm, proposed by Pearl
[1], is a way of organizing the global computation of
marginal beliefs in terms of smaller local computations
within the graph. It is one of the best-known graphical
model for distributed inference in statistical physics, artificial
intelligence, computer vision, error-correcting codes, posi-
tioning, and so forth. The whole computation takes a time
proportional to the number of links in the graph, which is
significantly less than the exponentially large time that would
be required to compute marginal probabilities naively.
Due to the presence of nonlinear relationships and highly
non-Gaussian uncertainties, the standard BP is undesirable.
In addition, in order to obtain acceptable spatial resolution
for the sensors, the discrete space (grid) in the deployment
area must be made too large for BP to be computationally
feasible. However, particle-based approximation via non-
parametric belief propagation (NBP), proposed by Ihler et al.
[2–4], makes BP acceptable for inference in sensor networks.
The main features of this approach are easy implementation
in a distributed fashion and sufficiency of a small number
of iterations to converge. Furthermore, NBP is capable of
providing information about location uncertainties and to
accommodate non-Gaussian measurement errors. This is
the main advantage of NBP comparing with well-known
deterministic methods [5–8]. In our application (indoor
positioning), the distance error model is not even close to
Gaussian model, thus this is our motivation for choosing
NBP.
However, BP convergence; is not guaranteed in a network
with loops [1, 9] or even with convergence; it could provide
us less accurate estimates. Regarding localization using NBP,
the convergence is usually sufficient, but the accuracy is
questionable. In the current state of the art, there are few
solutions for networks with loops, but mostly they have not
been used for the localization. Well-known solutions based
on generalized belief propagation (GBP) [9–12], which are
based on clusters or cliques, are still very complex for the
large-scale ad hoc/sensor networks. Another option, tree-
based reparameterization (TRP) [13, 14], is the method
based on the message-free version of BP which requires
formation of two-node trees and then merging them via an
update rule. The problem with this method is the lack of the
2 EURASIP Journal on Wireless Communications and Networking
nonparametric representation. Nevertheless, the idea for our
method comes from the TRP, but the core of our method is
standard NBP method (i.e., message-passing version) based
on optimal spanning tree formation.
In this paper, we propose NBP based on spanning trees
(NBP-ST) created by breadth first search (BFS) method
[15, 16] which is optimal for the unweighted graphs.
NBP-ST algorithm represents two (or more) independent
runnings of the NBP algorithm based on formed spanning
trees. In order to obtain realistic distance measurements
for indoor scenario, we performed experiments in our lab
using IRIS wireless sensor nodes equipped with AT86RF230
transceiver [17, 18]. This setup is specially designed for the
low-cost applications based on ZigBee/IEEE802.15.4 [19].
Using obtained data, we create a reliable indoor model and
import all data into Matlab. According to our simulation
results, NBP-ST performs better than NBP in terms of
accuracy and communication cost in the networks with
high connectivity (i.e., highly loopy networks). Furthermore,
the computational and communication costs are nearly
constant with respect to the transmission radius. However,
the drawbacks of the proposed method are a little bit higher
(10%–30%) computational cost and poor performance in
low connected network. Anyway, this is not a problem since
for the low-connected networks we can keep using NBP.
The remainder of this paper is organized as follows.
In Section 2, we provide a background and related work
on the cooperative localization in WSN, localization using
NBP, and its correctness in loopy networks. In Section 3,we
propose NBP method based on spanning trees. Experimental
results for indoor scenario are presented in Section 4.
Finally, Section 5 provides some conclusions and future work
perspective.
2. Background and Related Work
We start with description of the main classes of cooperative
localization techniques [20, 21]. Then, we describe the
statistical framework for cooperative localization using NBP
proposed by Ihler et al. [2–4]. Finally, we explain the
correctness of BP methods in loopy networks using results
from [1, 22]. The readers familiar with this subject can skip
this section.
2.1. Cooperative Localization Techniques for
Wireless Sensor Networks
2.1.1. Range-Based versus Range-Free Methods. Range-free
or connectivity-based localization methods [5, 6]relyon
connectivity between the nodes. The principle of this
algorithm is to determine whether or not a sensor is in the
transmission range of another sensor. The most attractive
feature of the range-free algorithms is their simplicity.
However, they can only provide a coarse-grained estimate of
each node’s location, which means that they are only suitable
for applications requiring an approximate location estimate.
Range-based or distance-based localization algorithms [5, 7,
8] use the intersensor distance measurements in a sensor
network to locate the entire network. This type of algorithms
is usually more accurate, but sensitive to measurement
errors.
2.1.2. Centralized versus Distributed Methods. Based on the
approach of processing the individual inter-sensor data,
localization algorithms can be also considered in two main
classes: centralized and distributed algorithms. Centralized
algorithms [6, 7] utilize a single central processor (i.e.,
fusion center) to collect all the individual inter-sensor data
and produce a map of the entire sensor network, while
distributed algorithms [5, 7, 8] rely on self-localization of
each node in the sensor network using the local information
it collects from its neighbors. From the perspective of loca-
tion estimation accuracy, centralized algorithms are likely to
provide more accurate location estimates than distributed
algorithms. However, centralized algorithms suffer from the
scalability problem and generally are not feasible to be
implemented for large scale sensor networks.
2.1.3. Anchor-Based versus Anchor-Free Methods. Anchor-
based [5, 7] methods assume that a certain minimum
number of the nodes know their position, for example, by
manual placement or using some other location mechanism
such as GPS. This localization method has the limitation
that it needs another method to bootstrap the anchor node
positions, and cannot be easily applied to any context in
which another location system is unavailable. In contrast,
anchor-free [6, 8] algorithms use local distance infor mation
to attempt to determine node coordinates when no nodes
have predefined positions. Of course, any such coordinate
system will not be unique and can be embedded into
another global coordinate space in infinitely many ways,
depending on global translation, rotation, and flipping.
Therefore, the main problem with anchor-free methods is an
additional algorithm for transformation from the relative to
the absolute coordinates.
2.1.4. Probabilistic versus Deterministic Methods. Determin-
istic algorithms [5–8] use the measurements to estimate
directly the positions by applying classical least square,
multidimensional scaling, multilateration, or other methods.
In favor of computational simplicity, they often lack a
statistical interpretation, and as one consequence rarely
provide an estimate of the remaining uncertainty in each
sensor location. However, iterative least-squares methods,
like N-hop multilateration [7], do have a straightforward
statistical interpretation, but assume a Gaussian model for
all uncertainties, which may be questionable in practice.
Non-Gaussian uncertainty is a common occurrence in real-
world sensor localization problems, where there is usually
some fraction of highly erroneous (outlier) measurements.
On the other hand, probabilistic methods [2–4, 23, 24
]take
into account uncertainty of the measurements, so given the
probability density function (pdf) of, for example, measured
distance and prior pdf of positions of a ll unknown nodes,
they estimate posterior pdf of positions of all unknown
EURASIP Journal on Wireless Communications and Networking 3
nodes. However, the main drawback of the probabilis-
tic methods is high computational and communication
cost which, in some applications, makes these methods
unacceptable in low-power sensor networks. Nevertheless,
the particle-based approximation via nonparametric repre-
sentation makes probabilistic methods acceptable for the
inference in sensor networks. In addition, nonparametric
representation enables us to estimate any pdf that does not
exist in analytical (parametric) form (see, e.g., Figure 9(b)).
We decided to implement NBP (which is naturally
probabilistic and dist ributed method) as anchor-based and
range-based method, but straightforward modifications can
make NBP to perform as anchor-free and/or range-free
method.
2.2. Localization Using Nonparametric Belief Propagation
2.2.1. Measurements. We consider the case in which some
small number of anchor nodes, obtain their coordinates via
GPS or by installing them at points with known coordinates,
and the rest, unknown nodes, must determine their own
coordinates. We suppose that all sensors with u nknown posi-
tions obtain noisy distance measurements of nearby subset
of the other sensors in the network. This measurements can
be obtained using a broadcast transmission from each sensor
as all other sensors listen. Typical measurements techniques
[20, 25–27] are time of arrival ( TOA), time differenc e of
arrival (TDOA), receive signal strength (RSS) and angle of
arrival (AOA). In this paper, we use RSS measurements.
Let us denote this received power by P
r
(d). It is
empirically accepted to model P
r
(d)asarandomandlog-
normally [28] distributed random variable with a distance
dependent mean value
P
r
(
d
)
[
dBm
]
= P
0
(
d
0
)
[
dBm
]
− 10n
p
log
10
d
d
0
+ X
σ
,
(1)
where P
0
(d
0
) is known reference power value in dB milliwatts
at a reference distance from the transmitter, n
p
is the path loss
exponent that measures the rate at which the RSS decreases
with distance, typically between two and four depending on
the environment, X
σ
is a zero-mean Gaussian distributed
random variable with standard deviation σ which accounts
for the random effects of shadowing. It is trivial to conclude
from (1) that, given P
r
(d) [dBm], the estimated distance
between a transmitter and receiver is
d
= d
0
· 10
−(P
r
(d)[dBm]−P
0
(d
0
)[dBm])/10n
p
· 10
X
σ
/10n
p
.
(2)
As we can see, the distance error is multiplicative (i.e., log-
normally distributed) which means that RSS-based distance
estimates have variance proportional to their true distance.
Therefore, RSS is most valuable in high-density sensor
networks which we target in this paper.
2.2.2. Statistical Framework. Having defined measured dis-
tance, we can now define the framework for localization.
Let us assume that we have N
s
sensors (N
a
anchors and N
u
unknowns) scattered randomly in a planar region and denote
the two-dimensional (2D) location of sensor t by x
t
.The
unknown node u obtains a noisy measurement d
tu
of its
distance from node t with some probability P
d
(x
t
, x
u
)
d
tu
=x
t
− x
u
+ v
tu
, v
tu
∼ p
v
(
x
t
, x
u
)
,(3)
where, for the noise v
tu
, we can use the log-normal (for
RSS) or Gaussian (for TOA) distribution p
v
.However,it
is advisable to use real measurements done in appropriate
deployment area. In that case, it is not necessary to use any
parametric form of the error distribution.
The binary variable o
tu
will indicate whether this obser-
vation is available (o
tu
= 1) or not (o
tu
= 0). Finally,
each sensor t has some prior distribution denoted p
t
(x
t
).
This prior could be an uninformative one for the unknowns
and the Dirac impulse for the anchors. Thus, the joint
distribution is given by
p
x
1
, , x
N
u
, {o
tu
}, {d
tu
}
=
(
t,u
)
p
(
o
tu
| x
t
, x
u
)
(
t,u
)
p
(
d
tu
| x
t
, x
u
)
t
p
t
(
x
t
)
.
(4)
For large-scale sensor networks, it is reasonable to assume
that only a subset of pairwise distances will be available,
especially between sensors which are located within some
radius R. In this case, probability of detection is given by
P
d
(
x
t
, x
u
)
=
⎧
⎨
⎩
1, for x
t
− x
u
≤R,
0, otherwise.
(5)
Another option is exponential model [3]whichrep-
resents a good approximation of the real-world systems.
However, it is advisable to estimate P
d
using training data
from appropriate deployment area.
Moreover, it is necessary to exchange information
between the nodes which are not directly connected (n-step
neighbors; n>1) because they contain some information
(also known as negative information [24]) about the distance
between them. Therefore, if two nodes do not observe
the distance between them, they should be far away from
each other. It is sufficient to include all 1-step and 2-
step neighbors. Others could be neglected without losing
accuracy of the results.
The relationship between the graph and joint distribu-
tion may be represented in terms of potential functions ψ
which are defined over graph’s cliques. A clique (C)isasubset
of nodes such that for every two nodes in C, there exists an
link connecting the two. So the joint distribution is given by
p
x
1
, , x
N
u
∝
cliques C
ψ
C
(
{x
i
: i ∈ C}
)
.
(6)
We can now define potential functions which can express
this joint posterior distribution. This only requires potential
functions defined over var iables associated with single nodes
and pairs of nodes. Single-node potential (prior information
about position) at each node t, and the pairwise potential
4 EURASIP Journal on Wireless Communications and Networking
(probabilistic information about distance) between nodes t
and u, are respectively given by
ψ
t
(
x
t
)
= p
t
(
x
t
)
,
ψ
tu
(
x
t
, x
u
)
=
⎧
⎨
⎩
P
d
(
x
t
, x
u
)
p
v
(
d
tu
−x
t
− x
u
)
,ifo
tu
= 1,
1
− P
d
(
x
t
, x
u
)
, otherwise.
(7)
Finally, the joint posterior distribution is given by:
p
x
1
, , x
N
u
|{o
tu
, d
tu
}
∝
t
ψ
t
(
x
t
)
t,u
ψ
tu
(
x
t
, x
u
)
.
(8)
Of course, the proposed framework is not unique, so we
also refer the reader to an alternative version based on factor
graphs [23].
2.2.3. Belief Propagation. Having defined a statistical frame-
work for sensor positioning, we can now estimate the
sensor positions by applying the BP algorithm. We apply
BP to estimate each sensor’s posterior marginal and use the
minimum mean square error estimate (MMSE) (i.e., mean
value) of this marginal a nd its associated uncertainty to
characterize the sensor positions.
Each node t computes its belief M
i
t
(x
t
), the posterior
marginal distribution of 2D position x
t
at iteration i,by
taking a product of its local potential ψ
t
with the messages
from its set of neighbors G
t
M
i
t
(
x
t
)
∝ ψ
t
(
x
t
)
u∈G
t
m
i
ut
(
x
t
)
.
(9)
The messages m
ut
,fromnodeu to node t,arecomputedby
m
i
ut
(
x
t
)
∝
x
u
ψ
ut
(
x
t
, x
u
)
M
i−1
u
(
x
u
)
m
i−1
tu
(
x
u
)
. (10)
In the first iteration of this algorithm it is necessary to
initialize m
1
ut
= 1andM
1
t
= p
t
for all u, t, and then repeat
computation using (9)and(10) until sufficiently con verge.
For tree-like graphs, the number of iterations should be at
most the length of the longest path in the graph. However,
it is usually sufficient to run until all unknown nodes obtain
information from minimum 3 noncolinear anchor nodes.
2.2.4. Nonparametric Belief Propagation. Due to the reasons
explained in Section 1, we use the NBP method. Thus,
the belief and message update equations, (9)and(10),
are performed using particle-based approximations, in two
phases: first, drawing weighted particles (
{W
j,i
t
, X
j,i
t
})from
the belief M
i
t
(x
t
), then using these particles to approximate
each outgoing message m
i
tu
.
Given N weighted particles
{W
j,i
t
, X
j,i
t
} from the belief
M
i
t
(x
t
) obtained at iteration i,wecancomputeanestimateof
the outgoing BP message m
i
tu
. The distance measurement d
tu
provides information about how far sensor u is from sensor
t, but no information about its relative direction. To draw a
particle of the message (x
j,i+1
tu
), given the particle X
j,i
t
which
represents the position of sensor t, we select a direction θ
j,i
randomly in the interval [0, 2π). We then shift X
j,i
t
in the
direction of θ
j,i
by an amount which represents the estimated
distance between nodes u and t (d
tu
+ v
j
)
x
j,i+1
tu
= X
j,i
t
+
d
tu
+ v
j
sin
θ
j,i
cos
θ
j,i
. (11)
Using kernel density estimate (KDE) (Approximation
of distribution p(x):
p(x) =
j
w
j
K
h
(x − x
j
). The
most common kernel function (K
h
) is spherically symmetric
Gaussian kernel: K
h
(x) = N(x,0,hI), where bandwidth
h controls the variance [29].) of potential function, and
assuming that there is detection between sensor nodes t and
u, the particles are weighted by the reminder of(10)
w
j,i+1
tu
= P
d
X
i, j
t
, x
u
W
j,i
t
m
i
ut
X
i, j
t
. (12)
The optimal value for bandwidth h
i+1
tu
could be obtained in a
number of techniques. The simplest way is to apply the “rule
of thumb” estimate [29]
h
i+1
tu
= N
−1/3
Var
x
i+1
tu
. (13)
It is also necessary to define messages coming from
anchor nodes, using (10) and the belief of the anchor node
x
∗
t
(M
i
t
(x
t
) = δ(x
t
− x
∗
t
), where asterisk denotes anchor)
m
i+1
tu
(
x
u
)
∝ ψ
tu
x
∗
t
, x
u
.
(14)
Messages along unobserved edges (2-step, )mustbe
represented as analytic functions since their potentials have
the form 1
− P
d
(x
t
, x
u
) which is usually not normalizable.
Using the probability of detection P
d
and particles from the
belief M
i
t
, an estimate of outgoing message to node u is given
by
m
i+1
tu
(
x
u
)
= 1 −
j
W
j,i
t
P
d
X
j,i
t
, x
u
.
(15)
Finally, the messages along unobserved edges coming
from anchor nodes (W
j,i
t
= 1/N)aregivenby
m
i+1
tu
(
x
u
)
= 1 − P
d
x
∗
t
, x
u
. (16)
To estimate the belief M
i+1
u
(x
u
) using (9), we draw
particles from the product of Gaussian mixture and analytic
messages. However, it is very difficult to draw particles from
this product, so we use a proposal distribution, the sum of
the Gaussian mixtures, and then reweight all samples. This
procedure is well-known as mixture importance sampling [2].
Denote the set of neighbors of u, having observed edges
to u and not including anchors, by G
0
u
and the set of of all
neighbors by G
u
.InordertodrawN particles, we create
a collection of kN weighted samples (where k
≥ 1isa
parameter of the sampling algorithm) by drawing kN/
|G
0
u
|
samples from each message m
tu
with t ∈ G
0
u
and assigning
each sample a weight equal to the ratio
W
j,i+1
u
=
v∈G
u
m
i+1
vu
v∈G
0
u
m
i+1
vu
.
(17)
EURASIP Journal on Wireless Communications and Networking 5
Anchor
d
1
Samples drawn
within the box
Upper bound of the distance
between anchor
and unknown
d
2
d
3
Figure 1: Drawing samples within the box that covers the region
where anchors’ ranges overlap.
Some of these weights are much larger then the rest,
especially after more iterations. This means that any particle-
based estimate will be dominated by the influence of a few
of the particles, and the estimate could be erroneous. To
avoid this, we then draw N values independently from the
collection
{W
j,i+1
t
, X
j,i+1
t
} with probability proportional to
their weight, using resampling with replacement [30, 31]. This
means that we create N equal-weight particles drawn from
the product of all incoming messages.
A node is located when a convergence criteria is met.
We can use the Kullback-Leibler (KL) divergence, a com-
mon measure of difference between two distributions. For
the particle-based beliefs in our algorithm, KL divergence
between beliefs in two consecutive iterations is given by
KL
i+1
u
=
j
W
j,i+1
u
log
⎡
⎣
W
j,i+1
u
M
i
u
X
j,i+1
u
⎤
⎦
. (18)
The detailed description of the algorithm can be found in
[3]. In addition, using the results from [7, 32], we constrain
the area from which the particles are drawn by building a
box that covers the region where anchors’ ranges overlap
(Figure 1) and, in each iteration, we filter out all particles
which get out of the appropriate box. This modification
increases the accuracy even after very small number of
iterations.
2.3. Correctness of Belief Propagation. The BP algorithm,
defined in Section 2.2,doesnotmakeareferencetothe
topology of the graph that it is running on. However, if
we ignore the existence of loops, messages may circulate
indefinitely around these loops, and the process may not
converge to a stable equilibrium [1]. One can find examples
of loopy graphs, where, for certain parameter values, the
BP algorithm fails to converge or predicts beliefs that are
inaccurate. On the other hand, the BP algorithm could
be successful in graphs with loops, for example, error-
correcting codes defined on Tanner graphs that have loops
[33]. Therefore, this problem is application dependent. In
this section, we intuitively explain this problem. However,
for extensive analysis of this problem, we refer the reader to
[9, 22, 34, 35].
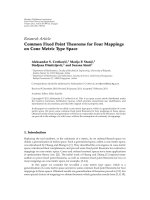
Let us consider the example of network in Figure 2.In
this network, there are 3 unknown nodes (A, B and C)and
3 anchor nodes (E
A
, E
B
,andE
C
) which represent the local
evidence. The BP algorithm can be considered of as a way of
communicating local evidences between nodes such that all
nodes compute their beliefs given all the evidence.
In order for BP to be successful, it needs to avoid double
counting [1, 22], a situation in which the same evidence
is passed around the network multiple times and mistaken
for new evidence. Of course, this is not possible in tree-like
network because when the node receives some evidence, it
will never receive that evidence again. In a loopy network,
double counting could not be avoided. For example, in
Figure 2(a),nodeB will send A’s evidence to C, but in the
next iteration, C will send that same information back to A.
Thus, it seems that BP in loopy network will always give the
wrong estimate.
However, BP could still lead to correct inference if
all evidence is “double counted” in equal amounts. This
could be formalized by unwrapped network corresponding
to as loopy network. The unwrapped network is a tree-
like network constructed such that performing BP in the
unwrapped network is equivalent to performing BP in the
loopy network. The basic idea is to replicate the nodes as
shown in Figure 2(b). For example, the message received
by node B after 3 iterations of BP in the loopy network
are identical to the final messages received by node B”in
the unwrapped network. In this way, we can create infinite
network. The importance of the unwr apped network is that
since it is tree-like, BP on it is guaranteed to give the correct
beliefs. However, usefulness of this beliefs depends on the
similarity between the probability distribution induced by
the unwrapped network and the original loopy network.
If the distributions are not similar, then the unwrapped
network is not useful and the results will be erroneous in
original loopy network.
Obviously, we can conclude the same for the NBP
method. Regarding localization using NBP, there is no
convergence problem, but the accuracy is questionable [11].
In order to overperform the NBP method in loopy networks,
we will break the loops using spanning trees.
3. NBP Based on Spanning Trees
3.1. Spanning Tree Formation. We start by describing the
basics of graphical models. An undirected graph G
= (V, E)
consists of a set of nodes V that are joined by a set of edges
E.Aloop is a sequence of distinct edges forming a path from
a node back to itself. A tree is a connected graph without any
loops. A spanning tree is an acyclic subgraph that connects
all the nodes of the original graph. A root node is a node
6 EURASIP Journal on Wireless Communications and Networking
1: Input:listofnodesQ and root node root
2: Set current root: r
← root
3: While Q is not empty do
4: for all nodes t
∈ G
r
do
5: if t
∈ Q then
6: Remove t from Q
7: Insert t in Q
r
8: Insert d
rt
in S
9: end if
10: end for
11: Set current root: r
← first unused node from Q
r
12: end while
13: Output: spanning tree
{Q, S}
Algorithm 1: Breadth First Search (BFS).
1: for all nodes do
2: Take sensing actions
3: Set all parameters to the initial values
4: Broadcast own and all received IDs
and listen for other sensor broadcasts
(until receive all IDs)
5: end for
6: Set a list of nodes for BFS (excluding anchors): Q
7: Choose root node: root
8: for all spanning trees do
9: Run BFS ( Algorithm 1)
10: Run NBP on defined spanning tree
11: Choose root node as far as possible from
the previous roots
12: end for
13: Fuse all beliefs into one and compute location estimates
Algorithm 2: NBP-ST method for localization.
without parent and leaf node is a node without children. In
order to define a graphical model, we place at each node
a random variable x
s
taking values in some space. In case
of localization, this random var iable represents the 2D or
3D position and each edge indicate that measurement is
available. If we exclude anchors, the graph is undirected, but
only for the first phase (spanning tree formation) we assume
that it is directed (starting from chosen root node).
The optimal method for spanning tree formation for
unweighted graphs is breadth first search (BFS) method
[15, 16, 36]. It begins at the root node and explores all the
neighboring nodes. Then, each of those neighbors explores
their unexplored neighbor nodes, and so on, until all nodes
are explored. In this way, there will not be a loop in the
graph because all nodes will be explored just once. The
detailed pseudocode is shown in Algorithm 1. The worst case
complexity is O(v + e), where v is the number of nodes and
e is the number of edges in the graph, since e very node and
every edge will be explored in the worst case. Note that there
are also other methods for breaking the loops, for example,
trellis-based iterative method [37].
3.2. Description of the Algorithm. In case of NBP localization,
we exclude all the anchors from the BFS algorithm since they
do not form the loops in the graph (they just send, and
never receive the messages). A graph generally has a large
number of spanning trees, but since our graph is unweighted
we choose few (minimum 2) of them in a partly random
way. In order to choose spanning tree, it is sufficient to
choose root nodes for all spanning trees, then the algorithm
will automatically set the spanning tree (see Algorithm 1).
Taking into account that we want to maximize the difference
between two spanning trees, the root nodes can be chosen in
two ways.
(i) The first root node we choose randomly from the
set of all unknown nodes. The second root node
has to be as far as possible from the first root node.
Thus, it should be one of the leaf nodes which is the
maximum-hop away from the root. Of course, hops
should be counted using original graph where the
number of hops represents approximated distance.
If we want to form more spanning trees, the analog
procedure can be used.
(ii) We choose two (or more) anchor nodes which are far
away from each other. The closest unknown nodes to
chosen anchor nodes will be chosen as roots.
Since we will apply this algorithm for the indoor scenario,
where the anchor nodes are usually fixed, we will use
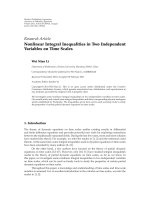
the second option. An example of a loopy graph and
two corresponding spanning trees, formed by BFS with
mentioned constraints, is illustrated in Figure 3. Note that
using BFS, it is not possible to form two spanning trees
with completely different edges, and that usually some of
the edges will be out of both spanning trees. Thus, if we
want to ensure that all edges are used, we have to add more
spanning trees, but it is usually not necessary since it would
only provide us a redundant information. It is especially the
case in highly connected networks which we target in this
paper.
The NBP method is naturally distributed through the
network which means that there is no central processor
which will handle all computations. Therefore, the proposed
BFS method has to be done in a distributed fashion. This
can be simply done if each unknown node initially broadcast
its ID to all neighbors, which will continue to broadcast
to others, and so on, until each unknown node has a list
of all unknown nodes in the graph. One anchor node (for
example, with lowest ID) has to be assigned to choose
the root node from that list and give him the permission
to start BFS algorithm. Then, the chosen root node has
all initial data to start the BFS algorithm, and, when it
is necessary, has only to broadcast all data (i.e., variables
from Algorithm 1) to all its neighbors. In the end, the last
visited node has the output result (spanning tree
{Q, S})
and it just has to start multihop broadcast until each
unknown node receives this result. Then, the second anchor
node will start the analog procedure. Note that since after
this phase NBP method starts, the connectivity should be
fixed.
EURASIP Journal on Wireless Communications and Networking 7
A
BC
E
A
E
B
E
C
(a)
E
C
E
C
E
A
E
A
E
B
E
B
C
ABC
B
A
E
B
B
(b)
Figure 2: (a) A simple loopy network, (b) Corresponding unwrapped network for the first 3 iterations.
(a)
Root 1
(b)
Root 2
(c)
Figure 3: (a) Example of loopy graph, (b), (c) Spanning trees created by BFS method.
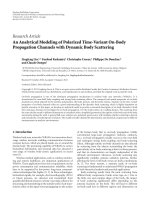
(a) (b)
Figure 4: (a) Crossbow’s IRIS wireless sensor node, (b) Illustration of the experiment in o ur lab.
Finally, NBP-ST algorithm represents two (or more)
independent runnings of the NBP algorithm based on
formed spanning trees. Each running will provide us
weighted particles of the node beliefs computed by (9).
The simplest way to fuse these beliefs is to resample with
replacement (see Section 2.2)fromweightedparticlesfrom
all spanning trees, which produces the particles with same
weights. The collection of particles from all spanning trees
represents our final output, from which we can easily extract
any parameter that we need (e.g, mean value for location
estimate). The pseudocode in Algorithm 2 illustrates the
NBP-ST method.
4. Experimental Results
In this section, we start with the description of the setup
used for the experiments performed in our lab. We then
create reliable indoor model using obtained measurements
and import all data into Matlab in order to check the
performance of the proposed method in high-density sensor
network. Furthermore, for the experimental results for
various localization algorithms, which are not topic of this
paper , we refer the reader to [38, 39].
4.1. Experimental Setup. For our experiments, we use Cross-
bow’s IRIS wireless sensor nodes (Figure 4(a)) equipped with
AT86RF230 transceiver. The AT86RF230 is hig h performance
RF-CMOS 2.4 GHz radio transceiver specially targeted for
low cost ZigBee/IEEE802.15.4 applications. The transmitter
provides programmable output power:
−17 dBm up to
3 dBm. The receiver, with
−101 dBm sensitivity, generates
digital signal with 3 dB granularity. The data is stored in a
128-byte dual port SRAM, from which 8 bytes are reserved.
More details in [17, 18].
In order to estimate the distance between sensors, we
placed two sensors, 2 m from the floor, in our 5 m
× 10 m
lab (Figure 4(b)) and set the transmission power to 3 dBm.
There are no obstacles between sensors, but the RSS will be
affected due to the multipath components and other devices
in vicinit y (e.g, WiFi). We obtained RSS measurements at 8
8 EURASIP Journal on Wireless Communications and Networking
01234567
0
1
2
3
4
5
6
Path-loss exponent
RMS error (m)
All data
All data above the threshold (
−64 dBm)
Figure 5: Path-loss exponent estimation.
012345678910
−80
−75
−70
−65
−60
−55
−50
True distance (m)
Received power (dBm)
Real model
Ideal model
Threshold power
Our model
Figure 6: Reliable model for distance estimation.
equidistant inter-sensor distances (k · 1.2m, k = 1, ,8).
For each of them, we obtained 1000 measurements. Because
of the 3 dB granularity of RSS, we assume that the real
power is a random variable uniformly distributed w ithin the
interval (RSS
− 1.5dB,RSS+ 1.5dB).
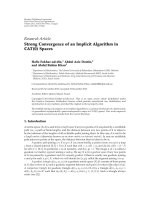
4.2. Indoor Modeling Using Distance Measurements. Using
obtained RSS measurements, our goal is to obtain all
necessary parameters for indoor model: path-loss exponent,
reliable distance estimation, probability of detection, and
potential functions.
4.2.1. Path-Loss Exponent. First, we define a reference point
(P
0
(d
0
= 2.4m) =−61 dBm). The path-loss exponent (n
p
)
could be easily obtained using another reference point, but
this is not an optimal way. The better option is to, using all
0.2 0.4 0.6 0.8 1 1.2 1.4 1.6 1.8
0
20
40
60
80
100
120
140
Distance estimation (m) (for 1.2m)
Figure 7: Histogram of distance estimation which corresponds to
thetruevalueof1.2m.
024681012
0
0.2
0.4
0.6
0.8
1
True distance (m)
Probability of detection
Forced
Real
Figure 8: Probability of detection.
measured data, minimize the root mean square (RMS) error
with respect to n
p
e
d
rms
n
p
=
1
n
n
i=1
d
i
measured
n
p
−
d
i
true
2
, ( 19)
where n is the number of intersensor distances (in our case,
n
= 8) and d
i
measured
(n
p
)isgivenby
d
i
measured
n
p
=
d
0
· 10
−(P
i
r
[dBm]−P
0
[dBm])/10n
p
.
(20)
Note that (2)and(20) are equivalent since the measured
power includes the noise which accounts for the random
effects of shadowing. According to Figure 5 (dashed line), the
optimal value of the path-loss exponent is n
p
= 2.7.
4.2.2. Reliable Distance Estimation. Using obtained measure-
ments and estimated n
p
, we can estimate the distance. As
EURASIP Journal on Wireless Communications and Networking 9
0
2
4
6
8
10
1
2
3
4
5
0.5
Anchor
0
1
0
(a)
0
2
4
6
8
10
1
2
3
4
5
0.5
Anchor
0
1
0
(b)
Figure 9: Pairwise potential function ψ
ut
(x
∗
t
, x
u
)(x
∗
t
: anchor, x
u
: unknown) using (a) log-normal model, (b) indoor model from our lab.
012345
0
1
2
3
4
5
6
7
8
9
10
(a)
01234
5
0
1
2
3
4
5
6
7
8
9
10
Root
(b)
0
12345
0
1
2
3
4
5
6
7
8
9
10
Root
(c)
Figure 10: (a) Original network, (b, c) two corresponding spanning trees. Connections between anchors (marked by red squares) and
unknowns (marked by black circles) are not shown.
we expected, our indoor model is not similar to the ideal
one (Figure 6), so the distance cannot be always trustfully
estimated using (20). For instance, the averaged received
power of
−66 dBm corresponds to three different distances
(4.6 m, 7 m and 9.6 m), so the sensor has no other option,
but to guess. This is because the power is not monotonically
decreasing function of the distance. Therefore, we have to
cut out the area below the threshold power (
−64 dBm)
because this area corresponds to the nonmonotonic part
of the function. Above the threshold, each received power
corresponds to the unique distance, which makes this model
reliable for our scenario. In addition, since we excluded
data below the threshold, we must reestimate n
p
using
only the remaining data. According to Figure 5, n
p
= 1.2.
We illustrated in Figure 7, the distance estimation which
corresponds to the true value of 1.2 m. As we can see, the
error distribution (d
measured
− d
true
) is not similar to the log-
normal distribution, so we will use nonparametric form of
the error distribution. Moreover, we have three different sets
of error samples (for 1.2 m, 2.4 m, and 3.6 m). Thus, in order
to import these samples into Matlab, we will simply draw the
sample from the nearest error distribution, and then add it to
the true distance (i.e., this is nearest neighbor interpolation,
so for the true value of, e.g, 2.9 m, we use the error sample
for 2.4 m). Note that we cannot use mean value because we
want to preserve the appropriate uncertainty.
4.2.3. Probability of Detection. For each inter-sensor distance,
we found that RSS is above the power defined by sensitivity
(Figure 8). This is expected because we set the transmission
10 EURASIP Journal on Wireless Communications and Networking
power to the maximum which could even provide us around
75 m radius, according to ZigBee standard. Anyway, we
have to follow defined reliable model, so we assume that
if the power is less than threshold (
−64 dBm), there is no
communication between nodes. This could be easily forced
by software. As we can see in Figure 6, the corresponding
distance is 4 m, so this will be the maximum value of
transmission radius. Note that in our case, we didn’t detect
communication failures (link quality indicator is always
maximum), so we set P
d
= 1 in the transmission range. This
is expected due to the very small distance between nodes.
4.2.4. Potential Functions. We have to define single-node
and pairwise potential function. Since we don’t have any
a priori information about positions of unknown nodes,
single-node potential of unknown node is equal to 1 in
the area defined by Figure 1. Regarding pairwise potential,
according to Section 2.2, given anchor node (or particle of
unknown node), the position of other node is shifted in
the random direction by measured distance between nodes.
We obtained density function using spherically symmetric
Gaussian kernel [29]. We illustrate theoretical (log-normal)
model in Figure 9(a), and our indoor model in Figure 9(b).
4.3. Simulations. We placed 50 unknowns and 10 anchors in
5m
× 10 m area (Figure 10). Unknown nodes are deployed
randomly within this area and anchor nodes are fixed (8
along the edges an 2 in center area). This constraint, realistic
for indoor scenario, helps the unknown nodes near the edges
which suffer from low connectivity. The number of iteration
is set to N
iter
= 3. According to our a nalysis, this number is
sufficient for good convergence. All simulations are done for
N
= 50 particles w ith respect to the transmission radius (R =
2 m–4 m). Finally, each point in the simulations represents
the average over 30 Monte Carlo trials.
Using the defined scenario, we compared NBP and NBP-
ST algorithms. For NBP-ST, we used 2 and 3 spanning trees.
The error is defined as Euclidean distance between true and
estimated location. As we can see in Figure 11, NBP-ST
performs better than N BP starting from some value of R,
which controls the connectivity. We can conclude the same
for the coverage (Figure 12), which represents the percentage
of located nodes with error less than predefined tolerance.
Obviously, for higher values of R, there is a large number of
loops in the network (hundreds, in our case) which decreases
the performance of the NBP method. For lower values of
R, we could expect that NBP-ST performs with higher (or
same) a ccuracy, but we cannot forget that, by using only
2 or 3 spanning trees, we did not include all information
(i.e., removed edges) that we have. Thus, in this case the
NBP overperforms NBP-ST (Figure 13). To measure the
communication cost, we count elementary messages,where
one elementary message is defined as simple scalar data.
We assumed that this data is represented in single precision
floating-point format that occupies 4 bytes in the memory.
As we have already mentioned, 8 bytes are already reserved,
so the size of elementary message is 12 bytes. Accord-
ing to Figure 14, NBP-ST performs better than NBP for
2 2.5 3 3.5 4
15
20
25
30
35
40
45
Transmission radius (m)
RMS error (%R)
NBP-ST-2 spanning trees
NBP-ST-3 spanning trees
NBP
Figure 11: Comparison of accuracy.
2 2.5 3 3.5 4
30
40
50
60
70
80
90
Transmission radius (m)
Average co verage (error < 0.2R) (%)
NBP-ST-2 spanning trees
NBP-ST-3 spanning trees
NBP
Figure 12: Comparison of coverage.
R>3.3 m only if we use 2 spanning trees. In order to
explain this we have to remember two main things we have
taken into account: removing the edges in order to form the
spanning trees and running NBP two times in these spanning
trees. First operation decreases the communication, but
the second one increases it. Therefore, in low-connected
networks the second operation predominates, but in high
connected networks the first one predominates. Regarding
computational cost (Note that we show joint computational
cost of both spanning tree formation and NBP method. The
cost of spanning tree formation is very small, around <5% of
total cost.), NBP overperforms NBP-ST, but the conclusion
is nearly the same. If we keep increasing R (R>4m), we
can overperfor m NBP. Since RSS is not reliable in this area,
EURASIP Journal on Wireless Communications and Networking 11
2 2.5 3 3.5 4
0.05
0.15
0.25
0.35
0.45
0.55
0.1
0.2
0.3
0.4
0.5
Transmission radius (m)
MFlops per node
NBP-ST-2 spanning trees
NBP-ST-3 spanning trees
NBP
Figure 13: Comparison of computational cost.
2 2.5 3 3.5 4
100
150
200
250
300
350
400
Transmission radius (m)
Kbytes per node
NBP-ST-2 spanning trees
NBP-ST-3 spanning trees
NBP
Figure 14: Comparison of communication cost.
it could be achieved using TOA measurements which usually
performs better [20]. Furthermore, it is important that the
computational and communication cost are nearly constant
with respect to the transmission radius. This feature provides
us more precise information about battery life. Finally, if
we use 3 or more spanning trees, both computational and
communication cost will be obviously significantly higher.
The final conclusion is that NBP-ST (with 2 spanning
trees) algorithm performs better than NBP in terms of
accuracy and communication cost, for R>R
min
. In our case,
R
min
= 3.4 m, but this parameter depends on the density in
the network (i.e., average connectivity). On the other hand, if
the unique goal is accuracy, user should increase the number
of spanning trees.
5. Conclusions and Future Work
As presented in this paper, NBP localization algorithm
has poor performance in highly loopy networks. Moreover,
the connectivity in these networks is very high which
makes communication burden for low-power applications.
Therefore, we proposed NBP-ST method based on spanning
trees created by the BFS method which is optimal for the
unweighted graphs. The BFS method is done in a distributed
way which makes the algorithm applicable in ad hoc sensor
networks. We can conclude that NBP-ST method performs
better than NBP in terms of accuracy, and communication
cost in highly connected networks. However, the drawbacks
of proposed method are a little bit higher computational
cost and p oor performance in low connected network. There
remain few open directions for the future work. One possible
future line is the implementation of localization algorithm
based on nonparametric generalized belief propagation
(NGBP). Some versions already exist [11], but they are still
very complex for the large-scale networks. Furthermore,
tree-reweighted BP [40] could be good alternative for this
problem. Finally, real-time tracking using these methods
could be an interesting direction. This will be a part of our
future research.
Acknowledgments
This work is supported by the FPU fellowship from Spanish
Ministry of Science and Innovation. Furthermore, we thank
partial suppor t by: ICT project FP7-ICT-217033 WHERE,
the Spanish National Project by the Spanish Ministry
of Science and Innovation under Grant TEC2009-14219-
C03-01, program CONSOLIDER-INGENIO 2010 under
grant CSD2008-00010 COMONSENS, ICT project FP7-ICT-
223994 N4C, National Project M3HF under Grant TEC2007-
67520-C02-01/02/TCM, and 4GBB project under grant TSI-
020400-2009-20.
References
[1] J. Pearl, Probabilistic Reasoning in Intelligent Systems: Networks
of Plausible Inference, Morgan Kaufmann, 1988.
[2] A. T. Ihler, J. W. Fisher III, R. L. Moses, and A. S. Willsky,
“Nonparametric belief propagation for self-calibration in
sensor networks,” in Proceedings of the 3rd International
Symposium on Information Processing in Sensor Networks
(IPSN ’04), pp. 225–233, April 2004.
[3] A. T. Ihler, J. W. Fisher III, R. L. Moses, and A. S. Willsky,
“Nonparametr ic belief propagation for self-localization of
sensor networks,” IEEE Journal on Selected Areas in Commu-
nications, vol. 23, no. 4, pp. 809–819, 2005.
[4] A.T. Ihler, Inference in sensor networks: graphical models
and particle methods, thesis, MIT, Department of Electrical
Engineering and Computer Science, June 2005.
[5] D. Niculescu and B. Nath, “Ad hoc positioning system (APS),”
in Proceedings of IEEE Global Telecommunicatins Conference
(GLOBECOM ’01), vol. 5, pp. 2926–2931, November 2001.
[6] Y. Shang, W. Ruml, Y. Zhang, and M. Fromherz, “Localization
from connectivity in sensor networks,” IEEE Transactions on
Parallel and Distributed Syste ms, vol. 15, no. 11, pp. 961–974,
2004.
12 EURASIP Journal on Wireless Communications and Networking
[7] A. Savvides, H. Park, and M. B. Srivastava, “The bits and flops
of the n-hop multilateration primitive for node localization
problems,” in Proceedings of the ACM Internati onal Workshop
on Wireless Sensor Networks and Applications, pp. 112–121,
September 2002.
[8] N. B. Priyantha, H. Balakrishnan, E. Demaine, and S. Teller,
“Anchor-free distributed localization in sensor networks,”
Tech. Rep., MIT Laboratory for Computer Science, 2003.
[9] J. S. Yedidia, W. T. Freeman, and Y. Weiss, “Understanding
belief propagation and its generalizations,” in Exploring Arti-
ficial Intelligence in the New Millennium, vol. 8, pp. 239–269,
Morgan Kaufmann, 2003.
[10] M. I. Jordan and Y. Weiss, “Graphical model: probabilistic
inference,” in The Handbook of Brain Theory and Neural
Networks, MIT Press, Cambridge, Mass, USA, 2nd edition,
2002.
[11] V. Savic and S. Zazo, “Sensor localization using nonparametric
generalized belief propagation in network with loops,” in
Proceedings of the 12th International Conference on Information
Fusion (FUSION ’09), pp. 1966–1973, July 2009.
[12] V. Savic and S. Zazo, “Sensor localization using gener alized
belief propagation in network with loops,” in Proceedings of
the 17th European Signal Processing Conference (EUSIPCO ’09),
pp. 75–79, August 2009.
[13] M. J. Wainwright, T. Jaakkola, and A. S. Willsky, “Tree-
based reparameterization for approximate inference on loopy
graphs,” in Advances in Neural Information Processing Systems,
pp. 1–8, 2001.
[14] M. J. Wainwright, T. S. Jaakkola, and A. S. Willsky, “Tree-based
reparameterization framework for analysis of sum-product
and related algorithms,” IEEE Transactions on Information
Theory, vol. 49, no. 5, pp. 1120–1146, 2003.
[15]A.Yoo,E.Chow,K.Henderson,W.McLendon,B.Hen-
drickson, and
¨
U. C¸ataly
¨
urek, “A s calable distributed parallel
breadth-first search algorithm on BlueGene/L,” in Proceed-
ings of the ACM/IEEE Supercomputing Conference (SC ’05),
November 2005.
[16] D. A. Bader and K. Madduri, “Designing multithreaded
algorithms for Breadth-First Search and si-connectivity on the
Cray MTA-2,” in Proceedings of the International Conference on
Parallel Processing (ICPP ’06), pp. 523–530, August 2006.
[17] />[18] />documents/
doc5131.pdf.
[19] IEEE Std 802.15.4-2006(Revision of IEEE Std 802.15.4-2003),
“IEEE Standard for Information Technology- Telecommuni-
cations and Information Exchange Between Systems- Local
and Metropolitan Area Networks- Specific Requirements Part
15.4: Wireless Medium Access Control (MAC) and Physical
Layer (PHY) Specifications for Low-Rate Wireless Personal
Area Networks (WPANs),” 2006.
[20] N. Patwari, J. N. Ash, S. Kyperountas, A. O. Hero III, R. L.
Moses, and N. S. Correal, “Locating the nodes: cooperative
localization in wireless sensor networks,” IEEE Signal Process-
ing Magazine, vol. 22, no. 4, pp. 54–69, 2005.
[21] G. Mao, B. Fidan, and B. D. O. Anderson, “Wireless sensor
network localization techniques,” Computer Networks, vol. 51,
no. 10, pp. 2529–2553, 2007.
[22] Y. Weiss, “Correctness of local probability propagation in
graphical models with loops,” Neural Computation, vol. 12, no.
1, pp. 1–41, 2000.
[23] H. Wymeersch, J. Lien, and M. Z. Win, “Cooperative localiza-
tion in wireless networks,” Proceedings of the IEEE, vol. 97, no.
2, Article ID 4802193, pp. 427–450, 2009.
[24] P. Rong and M. L. Sichitiu, “Robust, probabilistic, constraint-
based localization for wireless sensor networks,” in Proceedings
of the 2nd Annual IEEE Communications Society Conference
on Sensor and AdHoc Communications and Networks (SECON
’05), pp. 541–550, September 2005.
[25] A. H. Sayed, A. Tarighat, and N. Khajehnouri, “Network-based
wireless location: challenges faced in developing techniques
for accurate wireless location information,” IEEE Signal
Processing Magazine, vol. 22, no. 4, pp. 24–40, 2005.
[26] F. Gustafsson and F. Gunnarsson, “Mobile positioning using
wireless networks: possibilities and fundamental limitations
based on available wireless network measurements,” IEEE
Signal Processing Magazine, vol. 22, no. 4, pp. 41–53, 2005.
[27] D. Dardari, A. Conti, U. Ferner, A. Giorgetti, and M. Z.
Win, “Ranging with ultrawide bandwidth signals in multipath
environments,” Proceedings of the IEEE, vol. 97, no. 2, pp. 404–
425, 2009.
[28] T. S. Rappaport, Wireless Communications: Principles and
Practice, Prentice Hall, Upper Saddle River, NJ, USA, 2nd
edition, 2001.
[29] B. W. Silverman, Density Estimation for Statistics and Data
Analysis, Chapman & Hall, Boca Raton, Fla, USA, 1986.
[30] P. M. Djuri
´
c, J. H. Kotecha, J. Zhang et al., “Particle filtering,”
IEEE Signal Processing Magazine, vol. 20, no. 5, pp. 19–38,
2003.
[31] M. S. Arulampalam, S. Maskell, N. Gordon, and T. Clapp, “A
tutorial on particle filters for online nonlinear/non-Gaussian
Bayesian tracking,” IEEE Transactions on Signal Processing, vol.
50, no. 2, pp. 174–188, 2002.
[32] V. Savic and S. Zazo, “Nonparametric boxed belief prop-
agation for localization in wireless sensor networks,” in
Proceedings of the 3rd International Conference on Sensor
Technologies and Applications (SENSORCOMM ’09), pp. 520–
525, June 2009.
[33] B. J. Frey, “A revolution: belief propagation in graphs with
cycles,” in Advances in Neural Information Processing Systems,
vol. 10, pp. 479–185, 1997.
[34] J. M. Mooij and H. J. Kappen, “Sufficient conditions for con-
vergence of the sum-product algorithm,” IEEE Transactions on
Information Theory, vol. 53, no. 12, pp. 4422–4437, 2007.
[35] Y. Weiss and W. T. Freeman, “Correctness of belief propa-
gation in gaussian graphical models of arbitrary topology,”
Neural Computation, vol. 13, no. 10, pp. 2173–2200, 2001.
[36]T.H.Cormen,C.E.Leiserson,R.L.Rivest,andC.Stein,
Introduction to Algorithms, MIT Press and McGraw-Hill, New
York, NY, USA, 2nd edition, 2001.
[37] L. Lan, Y. Y. Tai, L. Chen, S. Lin, and K. Abdel-Ghaffar, “A
trellis-based method for removing cycles from bipartite graphs
and construction of low density parity check codes,” IEEE
Communications Letters, vol. 8, no. 7, pp. 443–445, 2004.
[38] A. Conti, D. Dardari, J. Lien, and M. Z. Win, “The effect
of cooperation on UWB-based positioning systems using
experimental data,” Eurasip Journal on Advances in Signal
Processing, vol. 2008, Article ID 513873, 11 pages, 2008.
[39] T. Pavani, G. Costa, M. Mazzotti, A. Conti, and D. Dard-
ari, “Experimental results on indoor localization techniques
through wireless sensors network,” in Proceedings of IEEE
Vehicular Technology Conference (VTC ’06), vol. 2, pp. 663–
667, May 2006.
[40] M. J. Wainwright, T. S. Jaakkola, and A. S. Willsky, “Tree-
reweighted belief propagation algorithms and approximate
ML estimation by pseudo-moment matching,” in Proceedings
of the Workshop on Artificial Intelligence and Statistics,January
2003.