báo cáo hóa học:" Quality assessment for mobile media-enriched services: impact of video lengths" potx
Bạn đang xem bản rút gọn của tài liệu. Xem và tải ngay bản đầy đủ của tài liệu tại đây (170.66 KB, 9 trang )
This Provisional PDF corresponds to the article as it appeared upon acceptance. Fully formatted
PDF and full text (HTML) versions will be made available soon.
Quality assessment for mobile media-enriched services: impact of video lengths
Communications in Mobile Computing 2012, 1:2 doi:10.1186/2192-1121-1-2
Jose Oscar Fajardo ()
Ianire Taboada ()
Fidel Liberal ()
ISSN 2192-1121
Article type Original submission
Submission date 27 December 2011
Acceptance date 1 February 2012
Publication date 1 February 2012
Article URL />This peer-reviewed article was published immediately upon acceptance. It can be downloaded,
printed and distributed freely for any purposes (see copyright notice below).
For information about publishing your research in Communications in Mobile Computing go to
/>For information about other SpringerOpen publications go to
Communications in Mobile
Computing
© 2012 Fajardo et al. ; licensee Springer.
This is an open access article distributed under the terms of the Creative Commons Attribution License ( />which permits unrestricted use, distribution, and reproduction in any medium, provided the original work is properly cited.
Quality assessment for mobile media-enriched services: im-
pact of video lengths
Jose Oscar Fajardo
∗
, Ianire Taboada and Fidel Liberal
Department of Electronics and Telecommunications, University of the Basque Country, Bilbao, Spain
Email: Jose Oscar Fajardo
∗
- ; Ianire Taboada - ; Fidel Liberal - fi;
∗
Corresponding author
Abstract
The inclusion of multimedia content in different web-based services has increased significantly. Through
an extensive subjective testing campaign, we analyse the quality of experience concerning video transmissions
associated to these types of services when accessed from mobile devices and mobile Internet connections. Contrary
to traditional normalised quality assessment studies, we point out the service context as a key aspect in quality
assessments. Specifically, we analyse the impact of the duration of the test material on quality assessments. We
find out that tolerance to visual degradations is higher in the specific context of use compared to when using
standardised methodologies for quality assessment, which has a significant impact in terms of commercial service
acceptability.
Quality in web–based media–enriched services
The explosion of multimedia content on the Internet has attracted a number of commercial players. New
media-enriched services are constantly being deployed on the web, such as mass media, online advertising in
web pages, user interaction in social networks, user-generated content sharing portals, etc. At the same time,
the segment of users who access these types of services through mobile connections is growing significantly.
1
The quality of experience (QoE) as expressed by end users for these services is of paramount importance for
service and network engineers, since it eventually influences customers’ willingness to use the service.
Although quality in video transmissions has been thoroughly studied in recent years, it has been commonly
associated to visual quality [1,2] instead of addressing the problem from a pure service standpoint. Ibarrola
proposes in [3] a general model for the management of quality of service (QoS) based on ITU-T E.802,
where the concept of service is linked to the service context since it modifies both users’ expectations and
perceptions. Less work has been devoted to the study of multimedia services in their context of use. In [4]
authors overview several studies concerning the key influence of the context in service quality evaluations:
the upper and lower thresholds of satisfaction seem to be attenuated in the specific context of use. In [5],
users are requested to watch full length movies with different types of degradations along the video track.
Results show that the perceived visual quality is considerably different when compared to the traditional
short duration tests. Additionally, users show different tolerance levels when movies are played at TV or PC
screens, which points out that users’ expectations play a major role in service evaluations.
User experimentation for mobile context of use
This paper illustrates a series of experiments aimed at analyzing the QoE for different media-enriched web-
based services in a mobile context. An extensive subjective testing campaign was carried out to gauge the
satisfaction as expressed by end users. 20 subjects participated in the tests (13 male, 7 female) with ages
ranging from 21 to 44 years old (average at 28). Context of use was explored using (1) video property
and length (2) mobile access and (3) the methodology for assessing user experience. Users were asked to
evaluate the impact of similar visual impairments in two contexts: (1) using common test video sequences
and including typical wireless degradations, and (2) including similar loss conditions into video sequences
extracted from considered online services.
Video lengths were inferred from the analysis of different online sources, namely BBC news mobile, YouTube
Mobile and Facebook. The duration of clips ranged from 20 s to 600 s, with average values between 94 s and
197 s. In [6] authors found average duration of videos hosted in Daum (popular service for user-generated
content in Korea) from 30 s for advertisements to 203 s for music videos. Concerning viewing conditions, all
sequences were displayed in a mobile handset (screen size of 2.8 inches, resolution of 320*240 pixels) instead
of a normalised LCD display, and users were asked to hold the handset on their hands with a free viewing
distance (commonly 6-8 times the height of the display). For quality assessments, we decided not to use the
recommended continuous assessment method for long video sequences, since quality evaluation tasks may
2
distort the results from a service perspective. Instead, absolute category rating (ACR) was used at the end
of each sequence. In addition to quantitative assessments, qualitative evaluations were considered allowing
users to add comments and to stop the play out if quality was perceived as unacceptable.
Short video sequences
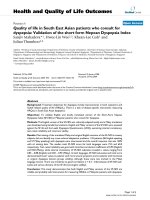
In the initial phase, users were asked to evaluate the visual quality of impaired short video sequences.
Common test video sequences in traditional visual quality studies have been selected, namely ”football”,
”stefan”, ”carphone” and ”suzie”. According to the classification in [7], these four video sequences provide a
goo d sample for the different quadrants in the spatio-temporal complexity grid in order to take into account
different content types. Video sequences were degraded based on the wireless error model therein presented
for mobile Internet connections. Fig. 1 illustrates the set of impaired video sequences selected for the aims
of this paper and the results from the quality evaluations. For each considered video clip, we show the
evolution of the resulting structural similarity index (SSIM) respect to the original sequence, as a means for
estimating the severity of the impairments from an objective quality metric standpoint. At the rightmost
subplots, we present the results obtained from the subjective tests in terms of mean opinion score (MOS). All
the obtained quality assessments are quite poor and are considered unacceptable for a commercial service.
Long video sequences
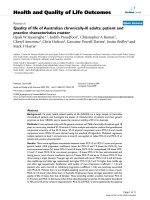
During the second phase, two different types of videos were considered in order to capture different spatio-
temporal characteristics. We first analyse the results with a severe degradation of 6 s in the middle of a ”high
complexity”-”high motion” video sequence, corresponding to an ”nba top ten plays of the week” clip of 100
s. Fig. 2 illustrates the degradation pattern and the subjective assessments as provided by users. In general,
the quality evaluations are considerably higher compared to short video sequences. In terms of MOS the
video clip scores 3.31, which can be considered in the lower range of acceptability for commercial services.
However, the variability of quality assessments is substantial compared to short clips with the same group
of individuals. These results indicate that user segmentation shall be necessary for an accurate inclusion of
users’ expectations, as described in [3]. Taking into account the qualitative evaluations provided by users,
some of them state that ”Very good quality, except a severe degradation in the middle” or ”If repeated, it
would be unacceptable”. As a result, one isolated severe impairment in such service contexts is not enough
to ab ort the session, but the provider should maximise the quality policies to assure an accurate network
performance for rest of session lifetime.
3
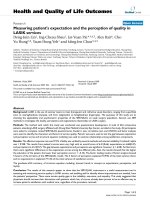
The second experiment introduces diverse degradations in a ”low complexity” clip, namely a ”talkshow”
sketch of 120 s. Fig. 3 illustrates the different levels of degradations used in the subjective tests. In
the left-top plot three different sequences are illustrated, ranging from several light 2 s degradations to
one severe 10 s degradation. The associated boxplot (right top) gathers the statistics for the aggregated
quality assessments. Obtained results are considerably different to short video clips: the visual quality is
perceived from fair to excellent with no comments about acceptability. Hence, results from traditional quality
studies are not directly applicable to these media-enriched services. Central plots illustrate the evolution of
image impairments with additional degradations (left) and the associated subjective quality scores (right).
Although obtained quality scores are lower, the experienced quality is indeed higher compared to short clips
with less severe degradations. Two individuals stated that ”I would stop the video if degradations persist”.
Thus, once again the variability of quality scores may advise towards user segmentation for an optimal
management. Finally, the left bottom plot shows the SSIM for a highly degraded video sequence. 80% of
people who evaluated the sequence stopped the reproduction before the end of the transmission, and the
remaining subjects provided the lowest quality score as well However, as illustrated with vertical dotted
lines, the acceptability threshold is variable and difficult to gauge with the limited set of tests.
Conclusion
We show the QoE results concerning video transmissions associated to a series of media-enriched web services
in a mobile context of use. We revisit the relevance of traditional visual quality assessment studies from
a service deployment standpoint. From an extensive subjective testing campaign we find out that users’
tolerance to visual degradations is quite higher when video sequences of 100-120 s are considered, as typical
values for the considered services. This effect should be taken into account when deploying mobile media
services or proposing real-time adaptation actions. As well, the variability of users’ assessments indicates
that user segmentation could be a good input for defining these kinds of management strategies.
4
References
1. Winkler S, Mohandas P (2008) The evolution of video quality measurement: From PSNR to hybrid metrics. IEEE
T Broadcast 54:660–668.
2. Lin W, Jay-Kuo CC (2011) Perceptual visual quality metrics: A survey. J Vis Commun Image R 22:297–312.
3. Ibarrola E, Liberall F, Ferro A, Xiao J (2010) Quality of service management for ISPs: A mo del and implementation
metho dology based on the ITU-T recommendation E.802 framework. IEEE Commun Mag 48:146–153.
4. Jumisko-Pyykk¨o S, Utriainen T (2010) A Hybrid Method for Quality Evaluation in the Context of Use for Mobile
(3D) Television. Multimed To ols Appl 55:185–225.
5. Staelens N, Moens S, van den Broeck W, Mari¨en I, Vermuelen B, Lambert P, van de Walle R, Demeester P (2010)
Assessing quality of experience of IPTV and video on demand services in real-life environments. IEEE T Broadcast
56:458–466.
6. Cha M, Kwak H, Rodriguez P, Ahn YY, Moon S (2009) Analyzing the Video Popularity Characteristics of Large-
Scale User Generated Content Systems. IEEE/ACM T Network 17:1357–1370.
7. Khan A, Sun L, Ifeachor E, Fajardo JO, Liberal F (2010) Video quality prediction models based on video content
dynamics for H.264 video over UMTS networks. Int J Digital Multimedia Broadcasting 2010:608138.
Figures
Figure 1 - Evolution of SSIM and quality scores for impaired short sequences
Left top (LT) and central top (CT): ”high complexity”-”high motion” video sequences; left bottom (LB):
”low complexity”-”high motion” video sequence;.central bottom (CB): ”low complexity”-”low motion” video
sequence; right top (RT) and right bottom (RB): boxplots of quality assessments.
Figure 2 - Evolution of SSIM and quality scores for impaired long sequence – high spatial complexity
Figure 3 - Evolution of SSIM and quality scores for impaired long sequences – low spatial complexity
5
0 1 2 3
0
0.2
0.4
0.6
0.8
1
"fotball"
SSIM
time, s
0 2 4 6 8
0
0.2
0.4
0.6
0.8
1
"stefan"
SSIM
time, s
1
2
3
4
5
1 2
Quality Boxplots
MOS
0 5 10
0
0.2
0.4
0.6
0.8
1
"carphone"
SSIM
time, s
0 1 2 3 4
0
0.2
0.4
0.6
0.8
1
"suzie"
SSIM
time, s
1
2
3
4
5
1 2
Quality Boxplots
MOS
"football" "stefan"
"carphone" "suzie"
Figure 1
1
2
3
4
5
1
Quality Boxplot
MOS
0 10 20 30 40 50 60 70 80 90 100
0
0.2
0.4
0.6
0.8
1
SSIM
time, s
"nba"
"nba"
Figure 2
1
2
3
4
5
1
MOS
Quality Boxplot
1
2
3
4
5
1
MOS
Quality Boxplot
0 20 40 60 80 100 120
0
0.5
1
time, s
SSIM
"talkshow"
seq1
seq2
seq3
0 20 40 60 80 100 120
0
0.5
1
time, s
SSIM
seq4
seq5
1
2
3
4
5
1
MOS
Quality Boxplot
0 20 40 60 80 100 120
0
0.5
1
time, s
SSIM
Sequence values
Aggregated values
Aggregated values
Figure 3